State of the Industry and More Restaurant Research
15 Min Read
In a State of the Restaurant industry report, the Natiional Restaurant Association sees a return to normal with predicted sales growth in 2023. Other top research lists how impactful the Super Bowl was for restaurants, the state of gift cards and top pizza cities.
A Return to Normal
The National Restaurant Association released its 2023 State of the Restaurant Industry report, which examines key factors impacting the industry including the current state of the economy, operations, workforce, and food and menu trends to forecast sales and market trends for the year ahead. The report is an authoritative look at the industry and its opportunities based on a range of national surveys of restaurant owners, operators, chefs, and consumers.
Key findings illustrating the industry's economic conditions include:
Growth will continue: The foodservice industry is forecast to reach $997 billion in sales in 2023, driven in part by higher menu prices.
Industry help wanted: The foodservice industry workforce is projected to grow by 500,000 jobs, for total industry employment of 15.5 million by the end of 2023.
Building on a Solid Foundation: For 70 percent of operators, business conditions have settled into or are on the path to their new version of normal.
Consumers want restaurant experiences: 84 percent of consumers say going out to a restaurant with family and friends is a better use of their leisure time than cooking and cleaning up.
Rising costs create challenges: 92 percent of operators say the cost of food is a significant issue for their restaurant.
Competition is heating up: In 2023, 47 percent of operators expect competition to be more intense than last year.
"The restaurant and foodservice industry is fueling the American economy. Our hiring rate and wage increases are outpacing the overall private sector, and this year our industry will contribute nearly $1 trillion to the economy," said Michelle Korsmo, president & CEO of the National Restaurant Association. "The 2023 State of the Restaurant Industry report offers an in-depth analysis of what's driving this growth and the tremendous opportunities for restaurant owners, operators, and team members who want to grow their businesses and expand their careers."
Pandemic Pivots Become Permanent
The temporary "pivots" developed during the pandemic — expanded delivery services, outdoor dining options, to-go alcohol offerings, and investments in technology — are the foundation of the industry's "new normal." At least 4 in 10 operators in each of the three limited-service segments — quickservice, fast casual, and coffee and snack — believe the addition of drive-thru lanes will become more common in 2023. For others, outdoor dining and alcohol-to-go are becoming table stakes. Across all six major segments, more than 9 in 10 operators plan to continue offering outdoor seating and the same number of operators are also likely to continue offering alcohol-to-go, if their jurisdiction allows it.
Despite widespread investment in technology in the last few years, the restaurant industry is still far from becoming a tech-centric sector. Most operators still consider their use of technology as mainstream rather than leading edge.
In 2023, many operators want to keep moving toward the edge, with more than four in ten planning investments in equipment or technology to increase front- and back-of-the-house productivity. These investments are anticipated mostly in the order and payment space, rather than automated systems or robots that prepare and serve food. Other operational takeaways include:
- Among fine-dining restaurants that offered delivery during the pandemic, 79 percent added it for the first time; 8 in 10 of those plan to continue.
- Two-thirds of adults say they're more likely to order takeout food from a restaurant than they were before the pandemic.
- Off-premises-only locations are expected to grow in popularity; more than 4 in 10 limited-service operators think they will be more common this year.
- 69 percent of adults say they like the option to dine outside.
An Industry of Opportunity
The restaurant and foodservice industry added 2.8 million jobs over the past 24 months, bringing the industry total to 15 million at the end of 2022; however, the foodservice industry remains 400,000 jobs below pre-pandemic levels.
Most restaurant operators will be actively looking to boost staffing levels in 2023, while carefully balancing staffing needs with business conditions. Eighty-seven percent of operators say they'll likely hire additional employees during the next 6–12 months if qualified applicants are available. Key figures on the restaurant workforce include:
- Between 2023 and 2030, the foodservice industry is projected to add an average of roughly 150,000 jobs a year, with total staffing levels projected to reach 16.5 million by 2030.
- Only one in ten operators think recruiting and retaining employees will be easier in 2023 than it was in 2022.
- The restaurant industry has long been the primary training ground for new entrants to the workforce and in 2022, nearly a quarter of jobs were filled by first-time employees.
- 58 percent of operators say using tech and automation to alleviate labor shortages will become more common in their segment in 2023; however, technology is generally complementary to human labor and primarily intended to enhance rather than replace workers in the restaurant industry.
Flexibility to Accommodate Rising Food Costs and All-Hours Dining
Demand for restaurant experiences remains strong among consumers who are hungry to connect over shared meals. Operators are taking creative cost-saving approaches to temper elevated expenses, including food, labor, occupancy, and utilities, by streamlining their menus. With the rise of remote work blurring traditional meal times, operators are focusing on new opportunities to entice customers at all hours with engaging offerings, including off-hours or slow-day value deals, flexible pricing, multi-course meal bundles, meal kits and subscriptions, apparel, and more. Meanwhile, many operators plan to add to their menus more healthier and nutritious meal options, eco-friendly items, and dishes tailored to takeout in 2023. Key data points on food and beverage trends include:
- 93 percent of operators say their restaurant's total food costs are higher than they were in 2019.
- A majority of operators across all segments expect to keep their menus in 2023 similar in size to last year.
- 69 percent of adults say they are likely to purchase a meal kit (measured ingredients with cooking instructions), including more than eight in ten
- Gen Z adults and millennials.
- Eco-friendly business practices continue to draw consumers, especially millennials.
"As the restaurant industry adapts to a new normal, operators' ability to be flexible and diversify their operations is essential to thriving," said Hudson Riehle, senior vice president of Research for the National Restaurant Association. "With profitability under pressure, operators are launching new business models within the industry, re-engineering current concepts, and allocating more space to off-premises business in order to satisfy customers in 2023."
Click here to download the 2023 State of the Restaurant Industry Report, supported by SpotOn and Sage.
Toast's Restaurant Trends
Toast's quarterly Restaurant Trends Report includes Q4 data from selected cohorts of restaurants on its platform, which serves approximately 79,000 restaurant locations in the U.S.
Among the results:
Tipping culture is here to stay, in fact 48 percent of card or digital payment transactions at QSR restaurants included a tip – up 11 percent since 2020.
New York City dining is growing with transaction counts growing 10 percent YOY -Toast analyzed the average number of transactions per restaurant location in select metropolitan areas and NYC led the way with over 10 percent growth. Chicago, Seattle, and New Orleans were close behind at 9 percent growth. San Francisco only saw approximately 2 percent growth.
The average Valentine’s Day dinner with food, drinks, and tip cost diners $121 in 2023. That’s up more than 75 percent since 2018, but down slightly since 2022.
Delivery transactions on Super Bowl Sunday were up in every metro area Toast analyzed except for Philadelphia. The Salt Lake City metro area took the prize for food delivery though, increasing the percentage of its delivery transactions by 13 percent YOY.
And the Eagles may have lost the Super Bowl, but the Philadelphia metropolitan areas crushed the Kansas City metro areas in beers ordered. At an average cost of $7.19 a pop, Philly metro area restaurants on average served 109 percent more beer during Super Sunday 2023 than in 2022, while Kansas City metro area was only up 67 percent.
How Do You Stack Up?
The hospitality industry is booming, and event professionals are driving its growth. To gain insight into the event and sales management role, Tripleseat surveyed 125 customers working at restaurants, hotels, and unique venues to learn about salaries, experience, benefits, the average number of event bookings, costs, and more.
Here are some of the highlights:
- The average annual salary plus commissions for event professionals is $72,000
- Employers are making the right moves, as 41 percent of event professionals always feel appreciated at work
- 58 percent of event professionals reported having a team of 2-5 people, which often supports 2-5 locations
- The average venue hosts more than 10 events per month at an average cost of $7,087
- Dinner and happy hours rank as the most popular event types."
Read the full findings and tips to navigate your hospitality career in our 2023 Career Guide for Event Professionals handbook, which you can download here.
Calmer Seas Ahead
The U.S. foodservice industry has had a perfect storm of challenges over the past few years, the lingering pandemic, labor shortage, inflation, higher operational costs, and an increasing number of meals eaten at home. Still, pockets of growth indicate calmer seas ahead. U.S. commercial foodservice customer traffic to restaurants and other foodservice outlets ended 2022 flat compared to a year ago. Consumer spending at foodservice outlets was up 4 percent due to higher prices, reports The NPD Group*.
Retail foodservice, specifically convenience store foodservice traffic, was a growth area for the industry. Convenience store visits for prepared beverages and foods were up two percent last year versus the year before. Restaurant traffic, representing most of all foodservice visits, was down one percent in the 12 months ending December versus a year ago, with most of the visit losses from full service restaurants. Visits to quick service restaurants, representing 82 percent of total restaurant traffic, were flat last year versus the prior year.
Morning meal has been a bright spot for foodservice over the past two years, and restaurants and retail foodservice have contributed to the growth. The breakfast and A.M. snack period traffic to restaurants and retail foodservice outlets increased by two percent in 2022, over a double-digit gain in 2021. Restaurant morning meal visits were up two percent in the 12 months ending December compared to the prior year’s double-digit increase. Traffic at the retail foodservice morning meal, most of which were to convenience stores, was up four percent last year, over a three percent gain in 2021.
The growth of technology-enabled ordering is evident in the popularity of digital ordering for carry-out. Digital ordering for carry-out has continued to grow since the height of the pandemic. Over the past three years, total restaurant digital orders for carry-out increased by 115 percent, and in the 12 months ending December, increased by 4 percent compared to the year before. Quick service digital orders for carry-out grew by nine percent in 2022 versus the prior year and have increased by 108 percent over the last three years.
Broadline foodservice distributors increased case shipments to commercial and non-commercial foodservice outlets by three percent, and dollars shipped increased by 17 percent in the 12 months ending December compared to a year ago. Commercial case shipments to restaurants and convenience stores were flat, and dollars shipped were up 13 percent compared to the year prior. Non-commercial broadline case shipments increased by 11 percent last year compared to 2021, with business and industry, education, lodging and casinos, and recreation being growth areas.
2023 Gift Card Report
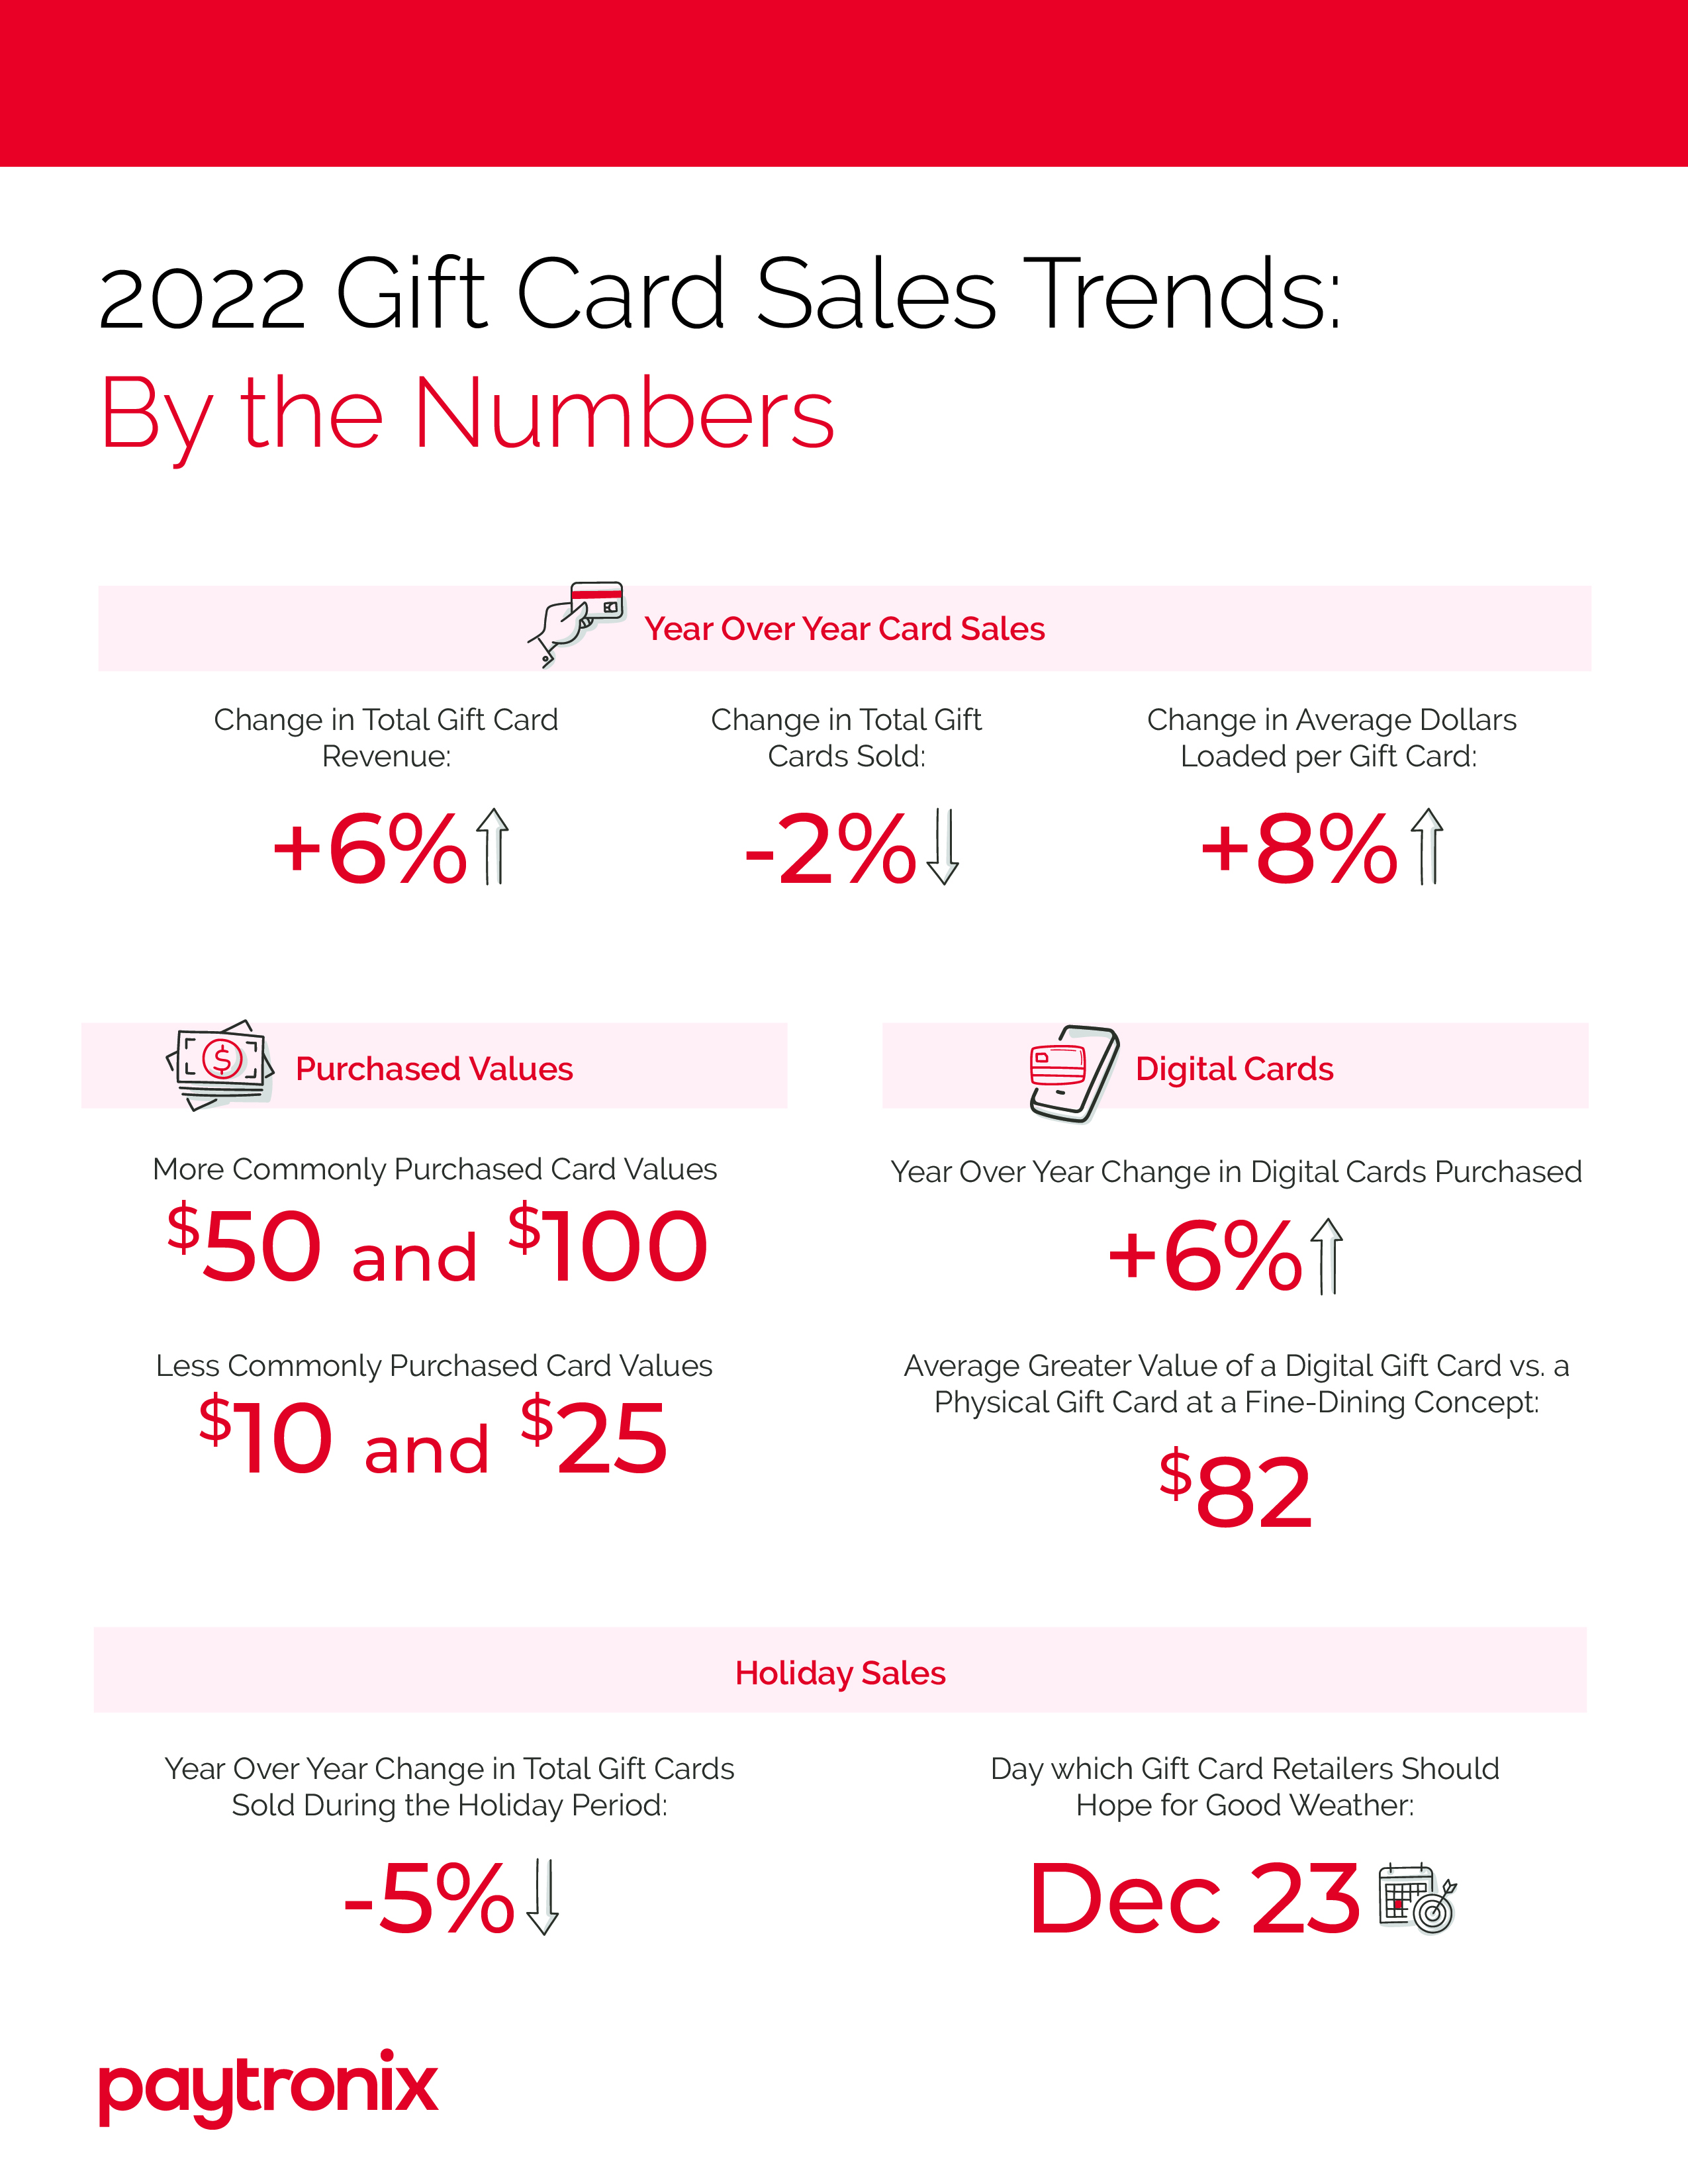
Paytronix published the Paytronix Restaurant Gift Card Report: 2023, which finds that restaurants have moved on from the pandemic, but face changes thanks to inflation. Those changes affect both how restaurants sell cards and how consumers purchase them. Download the Paytronix | Restaurant Gift Card Report: 2023
In 2022, dollars spent on gift cards rose six percent over 2021, a high-water mark for gift card value, yet the overall number of gift cards sold fell. That meant people loaded on more value, choosing more cards of over $25 and fewer that are under $10. Consumers also showed a preference for digital gift cards, not only by purchasing more, but loading them with higher values than on their physical counterparts.
While some of this change can also be attributed to customer preference and an overall shift in consumer behavior from quick-service restaurants (QSRs) to full-service restaurants (FSRs), some is driven by restaurant marketers.
Other report findings include:
- Average dollars loaded per gift card increased 8 percent from 2021.
- Digital cards outperformed physical cards in terms of value, with the average digital card loaded $82 more at a fine-dining establishment than a comparable physical card.
- Third-party retail sales grew, while in-store sales dropped, indicating a channel shift.
- Card sales also showed a shift toward FSRs, with that segment showing significant growth, even as QSRs, the segment that best weathered the pandemic, showed a five percent drop in revenue. This trend was particularly apparent for fine-dining restaurants.
Margarita Continues Dominance
CGA by NielsenIQ’s latest cocktail tracker reveals movement in the top-ranking cocktails in the US On Premise and the influence of seasonality and changing preferences to help suppliers build and maintain a winning cocktail strategy in 2023.
The Cocktail category has proved very lucrative for outlets across the US On Premise, boosting average earnings in Q4 vs Q3 2022 by +seven percent to $11,400. This uplift can be attributed to a promising increase in both traffic (+six percent) and check value (+five percent).
While sales remain at similar levels to Q3 last year, price is a factor in the increase in check value, with cocktails now $1.00 more expensive than last year on average.
Continuing to hold onto the top spot, Margaritas remain the country’s most popular cocktail, while Martinis have grown in popularity – now overtaking Moscow Mule for the #2 spot in the rankings of the top 10 Cocktails in the latest quarter.
CGA’s previous quarterly tracker highlighted the Espresso Martini’s strong performance, entering the top 10 and in the latest 12 week period*, value velocity has jumped up +26 percent vs Q3 and up by a significant +83 percent vs the same period last year. With prices remaining flat and check values down slightly, this is entirely due to an increase in traffic; seeing the cocktail nearly double in velocity over the past year.
Entering the colder months, there has been a slight shift in popularity and preferences of consumers, with Old Fashioned’s and Manhattans gaining velocity vs Q3 at the expense of some summer-based cocktails, such as Mojito and Pina Colada.
Growth vs Q3 has been driven by the performance of Whiskey, Gin and Vodka-based cocktails, with all three experiencing double-figure uplifts compared to previous quarter. While Rum-based cocktails have taken a hit, they remain slightly ahead of Q4 2021, showcasing their seasonality with stronger summer sales than in winter.
Eco-Friendly Food Packaging
The global eco-friendly food packaging market is expected to reach a size of US$ 380 billion by the end of 2032, as per data released by Fact.MR, a market research and competitive intelligence provider.
The market for eco-friendly food packaging is expanding as a result of rising consumer awareness of the harmful effects of utilizing single-use and non-biodegradable plastic goods for food packing. The environment is being negatively impacted by the widespread use of single-use and non-biodegradable plastic packaging materials. Plastic takes many years to disintegrate in a landfill, and throughout that time, it remains in the environment, harming the environment in various ways and ultimately endangering the lives of people, animals, and plants.
The food business is switching to products manufactured from paper or compostable substitutes for single-use plastic straws, lids, closures, caps, cups, and food trays. Due to shifting customer tastes towards packaged and convenient food items, product demand in the food industry will continue to rise.
Get To Know More: here
Market expansion has been fueled by consumer dissatisfaction with conventional packaging and government pressure to switch to eco-friendly materials. To lessen their ecological footprint, several firms recently embraced green packaging solutions. The market for eco-friendly food packaging is being driven by strict government restrictions and technological advancements in the packaging industry to produce packaging using non-petroleum goods. The market is also being fueled by advanced goods such as edible and water-soluble packaging.
Plant-Based Growth
The recent buzz about plant-based foods at retail and foodservice has many questioning if interest in plant-based foods is a fad or a long-term trend. Plant-based is a small but expanding category, and as more innovations and products become available and accessible, consumer interest broadens. According to The NPD Group*, about 25 million consumers eat plant-based beverages and foods occasionally or regularly, consuming these foods as part of a meal or as an ingredient. About one in five consumers say that they want more plant-based foods in their diet.
When it comes to eating plant-based foods, consumers are definite in which types of plant-based beverages and food they want to eat at home and which they eat from a restaurant or foodservice outlet. Although drinking dairy milk at home is still a more prominent behavior, about 93 percent of meals or snacks that include milk alternatives are consumed at home, and 7 percent are at/from a restaurant or foodservice outlet. Consumers eat more plant-based meat, poultry, and seafood analogues from restaurants because these foods are prepared in the same way animal protein menu items are, which means the consumer isn’t sacrificing taste for what they believe to be a healthier option.
At retail, the total volume sales of milk alternatives were down threepercent in the 52 weeks ending January 1, 2023, compared to a year ago, according to IRI. Almond and coconut milk alternatives were among the top declining products. Oat milk alternatives offset steeper declines for the total category, with volume sales up 22 percent versus a year ago. Volume sales of meat alternatives in the frozen aisle were down three percent from a year ago, with lunchmeat, meatball, and breakfast sausage alternatives the top decliners. Frozen meat alternative formats growing were wings, ingredient cuts, and nuggets. Fresh meat alternatives were down 15 percent compared to the prior year; breakfast sausage, meatball, and patty alternatives were the top declining categories. The growth formats in the fresh retail case during the period were wings, ingredient cuts, and nugget alternatives.
In foodservice, plant-based foods represent less than one percent of all foods shipped through broadline foodservice distribution to commercial and non-commercial foodservice outlets, with many categories growing. Plant-based meat analogues have expanded from primarily beef alternatives to poultry, seafood, and pork. Pound sales of chicken and fish analogues shipped from broadline foodservice distributors increased by 38 percent and 5 percent, respectively, in the 12 months ending December compared to a year ago. Grain alternative pizza crusts, like cauliflower crust, grew broadline foodservice pound sales by 35 percent in 2022 compared to a year ago.
NPD forecasts dairy and meat alternatives to grow through 2024, driven almost entirely by Millennials and Gen Zs, who choose these products because of their interest in sustainability, animal welfare, and better health. The deep-rooted values of Gen Zs and Millennials behind their choice of plant-based foods enabled the category to continue to grow throughout the pandemic. These plant-based consumers look for various meat, poultry, or seafood analogues, flavor profiles, and formats.
America's Best Pizza Cities
According to Americas’ Best Pizza Cities Detroit comes in as the best pizza city in America for the 2nd year in a row!
A survey of what 1,000 Americans identify as cities with a top 5 pizza scene
The “pizza passion” score (a combination of the Google search volume of 25 different pizza terms)
- Average prices of a large cheese pizza and large pepperoni pizza
- Average Yelp rating of pizza restaurants in the city
- Pizza restaurants per 100,000 residents
- Cleveland has the most affordable pizza prices. A large cheese pizza costs about $12.40, much cheaper than the $30.67 you'd pay in New York.
Here are the most popular choices:
New York: 41 percent
Los Angeles: 40 percent
Chicago: 35 percent
San Diego 24 percent
San Francisco: 24 percent
Sacramento: 20 percent
Buffalo: 18 percent
Miami: 17 percent
Phoenix: 17 percent
Boston: 15 percent
Hawaii, Oregon, and New York are the most vegan-obsessed states in America.
Europe for Foodies
New research has revealed that Valletta is the best European capital for foodies.
The study, conducted by casino review site Bonusetu, gathered data for all 44 European capital cities to create their Foodie Index Score. This score took into account the total number of standard and Michelin Guide restaurants per square mile, the affordability of a three-course meal for two, the number of different cuisines on offer, and the percentage of restaurants that offer a vegan option in each city.
Valletta ranks as the best European capital city for foodies, with a Foodie Index Score of 78.36 out of 100. There were found to be 254 restaurants in total throughout the tiny Maltese capital, which has an area spanning just 0.24 square miles. Comparatively, this works out to 1,058 restaurants per square mile, far greater than any other European capital city. It also has a high number of Michelin Guide restaurants relative to its size, as its 10 Michelin Guide restaurants work out to 41.67 Michelin Guide restaurants per square mile. Meals are relatively affordable, with the cost of a three-course meal for two people averaging €75. Valletta also has the highest percentage of vegan food options, with 31.1 percent of its restaurants catering to vegans.
Paris ranks second on this list with a Foodie Index Score of 71.65 out of 100. The ‘City of Light’ has an average of 386 restaurants per square mile, and meals are relatively affordable, the average cost of a three-course meal for two is €60. The French capital offers much morvariety than Valletta, with 198 different cuisines available in the city, however, only 9.44 percent of restaurants in Paris offered vegan options. While there are 449 Michelin Guide restaurants in Paris, the most out of any European capital, it works out to an average of 11.03 Michelin Guide restaurants per square mile.
The Greek capital, Athens, ranks third on the list with a Foodie Index Score of 64.25 out of 100. There are 150 different cuisines on offer in Athens across its 2,596 restaurants, and the coastal city has an average of 1.80 Michelin Guide restaurants per square mile. 19.03 percent of its restaurants offer vegan options, and the average cost of a three-course meal for two people is €50.
The fourth most foodie-friendly European capital is Brussels, with a Foodie Index Score of 61.21 out of 100. Visitors to the Belgium capital can expect to pay a bit more on average for a three-course meal for two at €70, and the city offers 2.97 Michelin Guide restaurants per square mile. Of the 3,458 restaurants in Brussels, there are 155 different cuisines on offer and 9.89 percent of them were found to offer vegan options.
Lisbon ranks fifth on the list, with a Foodie Index Score of 60.89 out of 100. The Portuguese capital has 127 restaurants per square mile, 12 percent of which offer vegan options. Lisbon has 1.06 Michelin Guide restaurants per square mile and provides more variety of cuisine than Brussels and Athens, with 164 cuisines available across its 4,922 restaurants.
London ranks sixth, with a Foodie Index Score of 58.74 out of 100. London has the most variety of cuisine on the list, with 204 different cuisines on offer, and visitors to England’s capital can expect to spend €78.05 on average for a three-course meal for two. On average, there are 30 restaurants per square mile, 21.8 percent of which offer vegan options. London has 373 Michelin Guide restaurants in total, second only to Paris, however due to London's sheer size this works out at just 0.61 Michelin Guide restaurants per square mile.
Seventh on the list is Amsterdam, ranking right behind London with a Foodie Index Score of 58.14 out of 100. Foodies visiting the capital of the Netherlands can expect to spend an average of €67.50 for a three-course meal for two. There are 47 restaurants per square mile, 20.05 percent of which offer vegan options, and the city has 0.84 Michelin Guide restaurants per square mile.
The Spanish capital of Madrid ranks eighth, with a Foodie Index Score of 57.26 out of 100. Madrid has 45 restaurants per square mile and 0.56 Michelin Guide restaurants per square mile. Those visiting the city can expect to spend €50 on average for a three-course meal for two, with 11 percent of its restaurants offering vegan options.
Monaco is the ninth-best European capital city for foodies, with a Foodie Index Score of 55.93 out of 100. While it has the highest average cost on the list for a three-course meal for two people at €100, foodies visiting Monaco will be spoilt for choice, as its 13 Michelin Guide restaurants work out to 16.67 restaurants per square mile, the second highest number of Michelin Guide restaurants relative to its size in any European capital. Monaco’s 286 restaurants also work out to 367 restaurants per square mile, the third highest number of restaurants per square mile, after Valletta and Paris.
Tenth on the list is Dublin with a Foodie Index Score of 54.99 out of 100. The Irish capital has an average of 51.47 restaurants per square mile, 22.03 percent of which offer vegan options. It also has 0.79 Michelin stars per square mile and 148 cuisines on offer. Foodies visiting Dublin can expect to spend an average of €80 for a three-course meal for two people.