MRM Research Roundup: Valentine and Galentine Momentum, Brand Value, and Cautious Optimism
15 Min Read By MRM Staff
This edition of Modern Restaurant Management (MRM) magazine's Research Roundup features projected industry growth, independent restaurant challenges, flavor trends, plate waste, Valentine's and Galentine's spend, and cold weather impact.
Modest Growth Expected
America’s restaurant industry is poised for a year of measured growth, though a cooling labor market, persistent cost pressures, and cautious household spending will continue to challenge operator margins. According to the National Restaurant Association’s 2026 State of the Restaurant Industry report, total restaurant and foodservice sales are projected to reach $1.55 trillion and restaurant operators are forecast to add more than 100,000 jobs.
This projected growth reflects an industry navigating a mixed economic landscape: operators are facing uneven traffic and elevated operating expenses, while consumers – particularly those in lower- and middle-income households – are increasingly stretched. Even so, restaurants remain deeply woven into American culture, with the majority of adults continuing to prioritize dining out, takeout, and delivery, even when budgets tighten.
Key findings from this year’s report include:
-
Modest growth is projected, but under continued pressures. Operators remain cautiously optimistic, even as rising costs and softer traffic persist. Many operators expect sales to hold steady or improve this year, and the Association forecasts modest real sales growth of 1.3 percent.
-
Consumer demand remains solid, but their spending power is restrained. Consumers have strong pent-up demand for restaurant experiences. More than 7 in 10 consumers say they would use restaurants more frequently if they had more disposable income. This desire is especially strong among Gen Z and millennials, who continue to lead the industry’s off-premises growth.
-
The industry workforce will continue to grow, though it will be challenging to fill the open positions. Restaurant and foodservice employment is projected to reach 15.8 million jobs in 2026. Nearly three quarters of operators plan to hire but expect difficulties finding experienced managers and chefs. Longer term labor force challenges—particularly the shrinking 16-to 24-year-old population—underscore the need for sustained workforce development and immigration reform.
-
Rising costs remain the industry’s key stressor and is limiting operator margins. More than 9 in 10 operators cite food, labor, insurance, energy, and swipe fees as significant challenges. Last year, 42 percent of operators reported their restaurant was not profitable – highlighting the need for operational innovation, workforce investment, and smart policy solutions.
-
Workforce development and technology could help release some of the margin pressure. In the current economic environment, restaurant operators are investing in training and tools to support hospitality with technology-driven efficiency. Advances in ordering, AI, and data analytics are helping operators streamline operations, manage costs, and enhance the customer experience.
A Snapshot of the Year Ahead
The uncertainty of 2025 will persist in 2026, requiring operators to rely on their creativity and adaptability to stay agile in the shifting operating environment. This will mean balancing restrained consumer spending and elevated costs by leveraging technology to create efficiencies that bring down costs and free up staff to focus on consumer experiences.
Operators will be focused on investments in innovative solutions like digital ordering and payments, loyalty programs, automation, and targeted marketing that are strengthening guest engagement and removing friction points from the dining experience.
When it comes to the workforce guiding the consumer experience, operators are committed to building skilled adaptable employees through training and technology. This investment continues to shape the entire U.S. workforce, because more people have worked in restaurants than in any other industry, highlighting the industry’s role in individual career growth.
All of this comes together to serve a customer hungry with curiosity and looking for value, not only in price, but in experience.
Independent Restaurant Report Expresses Cautious Optimism
The James Beard Foundation® (JBF), in collaboration with Deloitte, detailed findings of its 2026 Independent Restaurant Industry Report, a comprehensive analysis of the independent restaurant industry, synthesizing insights from independent owners and chefs, to reveal the industry's top challenges and opportunities. Drawing from interviews with leading chefs and a nationwide survey of hundreds of owners and operators across the nation, the report provides a wide-ranging view of the current state of the industry, emerging trends, and critical factors that restaurants can leverage to thrive in 2026.
The findings paint a picture of an industry moving into 2026 with cautious optimism. Not because pressures have eased, but because independent operators have demonstrated remarkable endurance and adaptability in the face of cost pressures, shifting consumer behavior and expectations, workforce complexity, and rapid technological change. Despite these hurdles, most restaurateurs are implementing innovative strategies to meet current market demands, deepen guest connection, and ensure long-term sustainability.
The study identified four major trends that are helping reshape the industry landscape:
-
Protecting Margins Amidst Volatility: Fluctuations in ingredient prices, combined with persistent cost pressures, is making margin management increasingly inflexible and reactive.
-
Supporting the Workforce Beyond Wages: Labor pressures have largely shifted from mitigating shortages to navigating retention, cost management, and regulatory complexity.
-
Navigating An Expanding Technology Ecosystem: A rapidly growing and increasingly costly technology ecosystem is resulting in more disciplined adoption and intentional investment.
-
Managing the Consumer Expectation Gap: Converging and increasing consumer experience expectations seems to be widening the disconnect between guest assumptions and operational realities.
The research synthesizes insights from a survey of over 380 independent restaurant owners, chefs, and operators conducted September to November 2025, as well as interviews with 40 chefs. Participants represented a broad cross-section of the industry across 47 states and all four census regions, ranging from fine dining establishments to fast-casual venues, breweries, and caterers.
Value of Restaurant Brands
The world’s top 25 restaurant brands are now worth a combined $190.1 billion, marking a new high for the sector, according to a new report from Brand Finance, the world's leading brand valuation consultancy.
In 2026, the global restaurants sector continues to grow in value, supported by store expansions and the normalisation of takeout, delivery, and quick-service dining. Since the inaugural Brand Finance Restaurants 25 report in 2015, the combined brand value of the Top 10 has increased by around 20 percent, even as brand strength has come under increasing pressure.
Fast-food and quick-service brands continue to dominate the ranking, with the top five remaining largely unchanged. McDonald’s (brand value up five percent to $42.6 billion) leads the rankings for the second consecutive year, supported by its vast global footprint and steady franchise income. However, Brand Finance’s Global Brand Equity Monitor (GBEM) data shows that affordability concerns are beginning to weigh on consumer perceptions in several key markets like US and UK.
Starbucks holds on to second place, but its brand value slipped four percent to USD37 billion, as intensifying competition in key markets, particularly China, blunted gains from improving store performance. KFC rounds off the top three, recording an eight percent brand value growth to $16.5 billion, supported by strong momentum in China and the expansion of its footprint.
Chick-fil-A emerged as the fastest growing brand, rising 44 percent to $8.1 billion, supported by strong revenue performance and disciplined expansion across the US, which strengthened future earnings expectations.
The success of Luckin Coffee (brand value up 40 percent to $2.4 billion) and Mixue (new entrant at $4.6 billion) ranked 19th and 12th respectively, also points to a distinct Chinese growth model, where scale and affordability take precedence over premiumisation. As many Western brands grapple with declining price acceptance, these value-led brands have continued to expand rapidly by aligning closely with everyday consumption and price expectations. Their performance suggests that in highly competitive, cost-conscious markets, disciplined pricing and operational efficiency can translate into sustained brand growth.
From a brand strength perspective, Haidilao (brand value up 22 percent to $4.4 billion) remains the world’s strongest restaurant brand in 2026, with a Brand Strength Index (BSI) score of 89.5/100 and an AAA brand strength rating, supported by high awareness and strong perceptions of service quality in its home market of China. However, like many leading brands in the ranking, its BSI declined year-on-year, underscoring growing pressure on brand strength across the sector.
Greggs (brand value up 11 percent to $1.4 billion) ranks second strongest scoring 88.2/100, driven by strong familiarity and everyday relevance in the UK, although rising price sensitivity in 2025 weighed on consumer perceptions. McDonald’s completes the top three, with a BSI score of 88.1/100, despite a year-on-year decline reflecting affordability pressures and softer engagement in key markets, particularly the US.
Together, the top three strongest brands highlight a broader trend within the sector, where the brands are finding it increasingly difficult to sustain brand strength amid rising costs and more value-conscious consumers. While the Restaurants 25 ranking highlights the sector’s impressive ability to grow and monetise at scale, Brand Finance’s findings suggest that sustaining brand strength will be increasingly critical as competition intensifies and consumer expectations evolve.
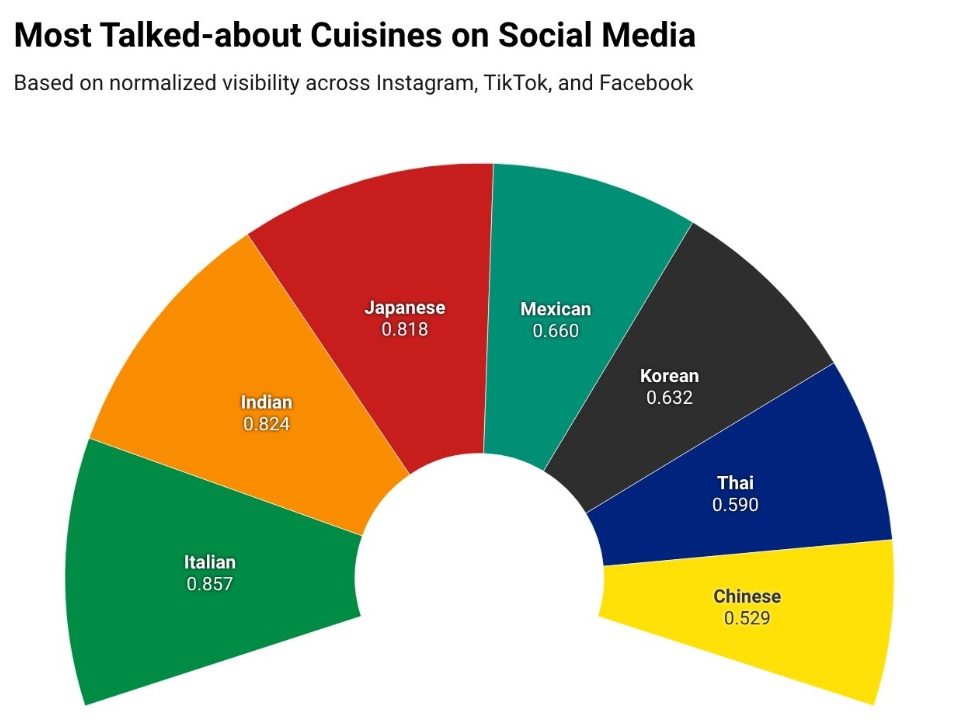
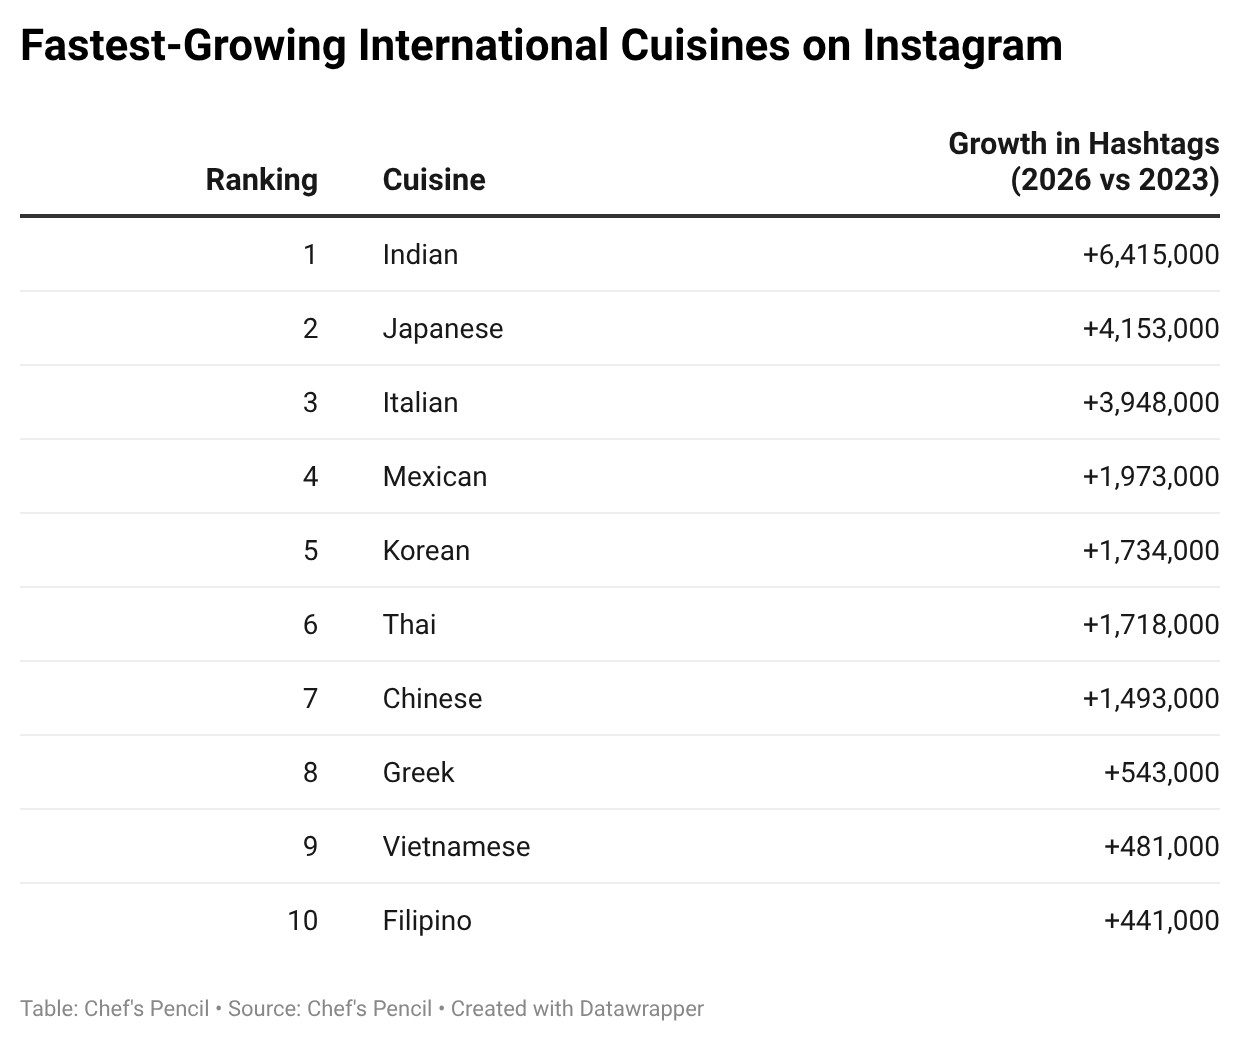
Most Visible International Cuisines
Chef’s Pencil has published a new global analysis of food trends on social media, ranking the most visible international cuisines across Instagram, TikTok, and Facebook in 2026.
Key findings include:
-
Italian, Indian, and Japanese food dominate across platforms
-
Mexican and Korean cuisines lead TikTok
-
Indian cuisine is the fastest-growing international cuisine
-
Community-driven cuisines outperform expectations
-
French cuisine underperforms despite fine-dining prestige
The analysis goes beyond raw numbers, exploring how cultural influence, fine dining, and everyday cooking shape online visibility. It also features expert insights from Michelin-starred chefs, including Sumant Sharma (Musaafer) and Daeik Kim (Jungsik).
January Menu Prices and Super Bowl Report
Toast just released two data reports: its January Menu Price Monitor, offering a granular view of how inflation is truly impacting restaurant menus, and a Super Bowl LX report analyzing how chicken wing pricing and sales performed on game day compared with last year’s event.
January Menu Price Monitor highlights include:
-
🍔 Burger Prices Rise Again: The median price of a burger in January was $14.62, up 0.1 percent from December 2025. Year-over-year, prices are up 2.9 percent since January 2025.
-
🧊 Cold Brew Prices Stall: The median price of cold brew in January was $5.55, which remained flat (0.0 percent) from December 2025. Year-over-year, prices are up 3.9 percent since January 2025.
-
☕️ Regular Coffee Hold Steady: The median price of regular coffee in January was $3.61, which remained flat (0.0 percent) from December 2025. Year-over-year, prices are up 3.4 percent since January 2025.
-
🌯 Burrito Prices Tick Up: The median price of a burrito in January was $13.51, up 0.1 percent from December 2025. Year-over-year, prices are up 3.2 percent since January 2025.
-
🍻 Beer Prices Dip Slightly: The median price of a beer in January was $6.48, down 0.3 percent from December 2025. Year-over-year, prices are up 2.0 percent since January 2025.
-
🍗 Chicken Wings Prices Cool Off: The median price of chicken wings in January was $13.82, down 0.6 percent from December 2025. Year-over-year, prices are up 1.8 percent since January 2025.
Super Bowl LX Chicken Wings report highlights include:
-
🍗 Prices Stayed Surprisingly Stable: Wing prices rose just 1.3 percent year-over-year ($14.99 → $15.18), a modest increase despite inflationary pressures.
-
🗺️ Regional Price Gaps: Nevada ($16.99) and New Jersey ($16.80) had the most expensive wings, while Wisconsin ($13.21) and Kansas ($13.62) scored some of the best deals.
-
📊 State-Level Price Swings: Idaho (+9.1 percent), West Virginia (+8.2 percent), and Oregon (+6.8 percent) saw the sharpest year-over-year increases in wing prices, while Arkansas (-4.5 percent), Oklahoma (-3.7 percent), and Missouri (-0.9 percent) experienced declines.
Is Plate Waste Eating Profit Margins?
At a time when rising food costs, shifting consumer appetites, and mounting sustainability pressures are converging on the restaurant industry, research reveals that one of the most overlooked profit levers may be hiding in plain sight: what’s left on the plate.
A new white paper, Customizable Portions: A Cost-Conscious Approach to Reducing Plate Waste, from Georgetown University’s Business for Impact Portion Balance Coalition and Earth Commons Institute, makes a data-driven case for rethinking portion size as a strategy to cut waste, improve financial margins, and better meet evolving consumer demand.
The paper, which was created in collaboration with Menus of Change University Research Collaborative and supported by ReFED, shifts the food waste conversation from the kitchen to the dining table, finding that nearly 70 percent of restaurant food waste stems from food that is prepared, served, and never eaten.
Hidden Costs and Market Shifts
Historically, restaurants have concentrated food waste efforts on back-of-house operations, but the research suggests that front-of-house plate waste represents a major blind spot. According to the white paper’s findings, in 2023 alone, restaurants and foodservice operators generated 12.7 million tons of surplus food in the United States, contributing to 64.6 million metric tons of carbon emissions. The financial impact is equally staggering: $162 billion in annual waste-related costs, including food, packaging, labor, and disposal. Yet only 20 percent of surveyed operators report tracking what customers leave on their plates.
That gap matters because by the time food reaches a customer’s table, the restaurant has already absorbed the full cost of ingredients, labor, and preparation. Every untouched side of fries, uneaten bowl of rice, or half-finished entrée represents revenue that has already been lost.
At the same time, consumer preferences are rapidly evolving. The industry stands at a pivotal moment. Nearly half of diners say they have been surprised by oversized portions, and 59 percent report they would be more likely to visit restaurants offering flexible portion sizes. Additionally, the rise of GLP-1 medications, used by an estimated 12 percent of U.S. consumers, is reshaping dining habits, with many users consuming fewer calories and seeking smaller, lighter meals when eating out.
Yet among 70 major restaurant chains analyzed in the study, only 43 percent offer any form of portion customization — such as excluding sides and offering multiple portion sizes — and just 18 percent provide build-your-own options for adults beyond children’s menus.
For an industry long defined by abundance and value perception, this poses a risk and an opportunity.
The Customizable Portions Project
This white paper analyzed the current state of food waste management to uncover opportunities to reduce food waste by offering customizable portions in retail foodservice environments.
Here are some of the statistics:
- 70 menus received a desktop analysis
- 20 survey respondents at commercial and non-commercial foodservice operations
- 13 months spent on the research project
In addition, the study combines 11 expert interviews and in-house food waste audits at four popular restaurant locations in the Washington, D.C., metropolitan area, combined with a detailed cost analysis and projection modeling. Rather than positioning portion flexibility solely as a sustainability initiative, the report frames it as a margin strategy: in this context, waste reduction becomes not only an environmental imperative but a competitive advantage.
Valentine’s Day Spending
Valentine’s Day spending was projected to hit a record $27.7B in 2026, according to an estimate by Capital One. But InMarket’s latest 2026 Valentine’s Day InSights found that most consumers kept budgets modest, with only 11 percent of consumers planning to spend over $100.
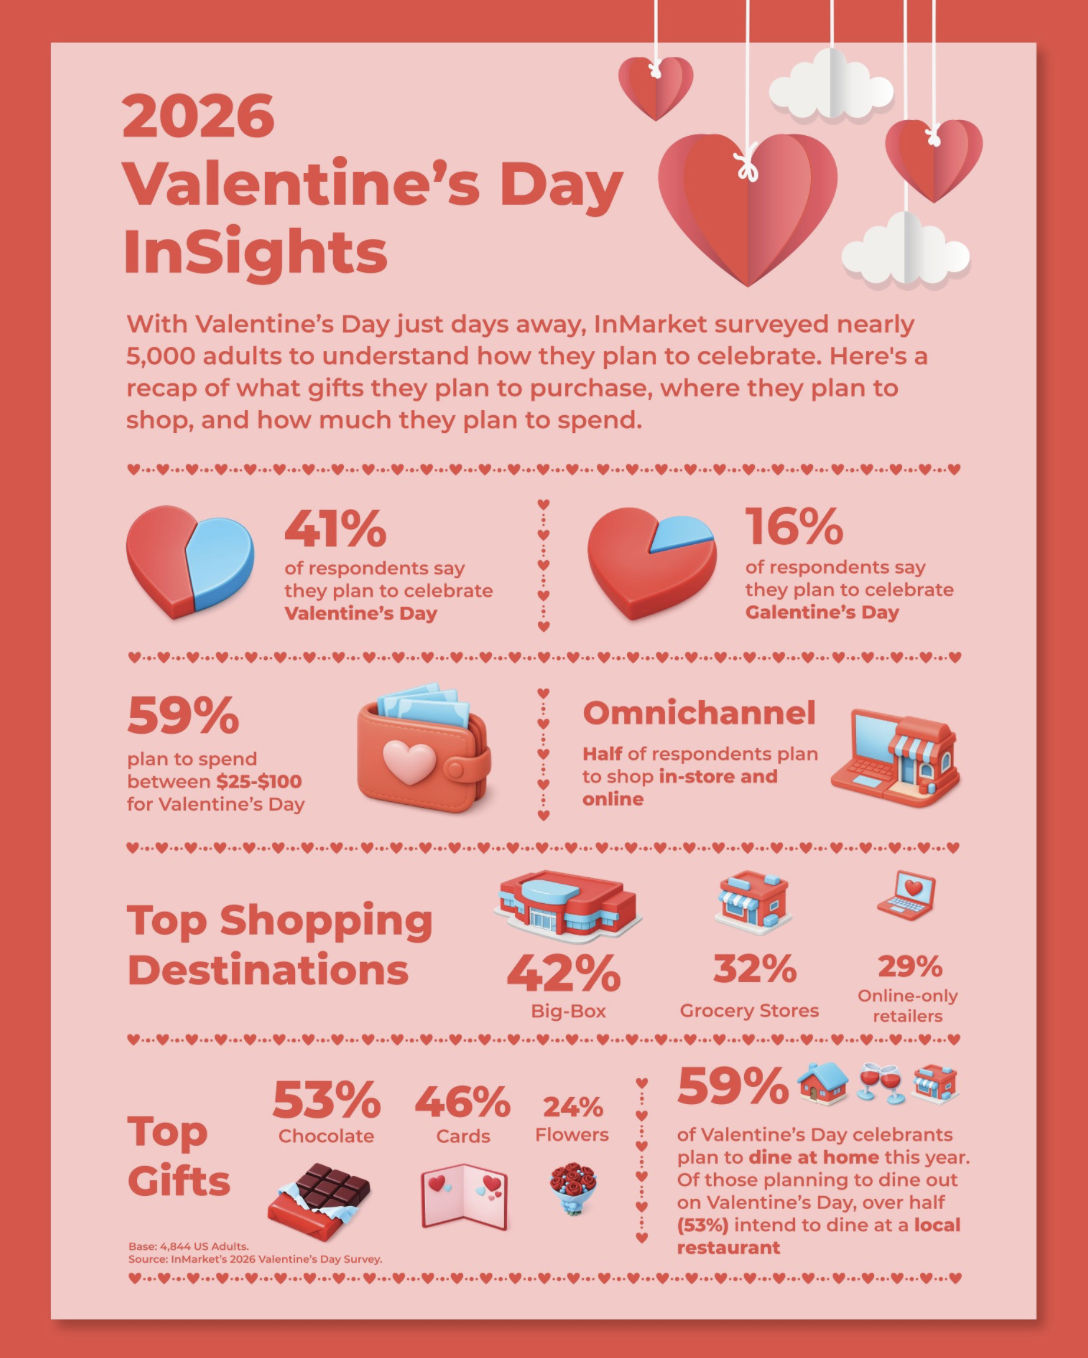
Some highlights from the Valentine’s Day InSights Report:
-
The top priorities for shoppers and how brands can adjust their strategy to capture interest (spoiler alert: thoughtfulness beats price this year, with 55 percent saying that thoughtfulness is their top purchase factor)
-
Despite ongoing price pressures, most Valentine’s Day shoppers remain undeterred, with 61 percent saying higher prices haven’t changed their plans to celebrate
-
But among those impacted by higher prices, the biggest shift is eating in: 39 percent say they’ll dine at home instead of dining out
-
Spending spikes for various categories, including a 39 percent increase in chocolate spending in early February 2025 vs. late January 2025
Venue Spike for Valentine’s Week
Experiential venues see spike in group demand during Valentine’s week, with New York, Chicago, Austin and LA leading the shift
Valentine’s Day is no longer just for couples. New data from venue booking platform Tagvenue reveals that today (February 13th ) marks “Galentine’s Day” – the celebration of friendship – is reshaping how Americans celebrate Valentine’s week, driving a significant rise in group event bookings and demand for experiential venues across major US cities.
While Valentine’s Day has traditionally been considered a low-relevance holiday for venue hire platforms, dominated by restaurant reservations and couples’ dining, Tagvenue’s latest analysis shows a marked shift toward group-led, experience-driven celebrations.
Group Bookings Surge During Valentine’s Week:
According to Tagvenue data comparing Valentine’s week to standard February weeks:
- Group event bookings increase significantly during Valentine’s week
- Average group size grows, with more bookings for 6+ guests
- Demand shifts away from traditional private dining toward interactive and experiential spaces
Key cities including New York, Chicago, Austin, and Los Angeles show the strongest growth in group celebrations. The findings point to a broader cultural trend: Valentine’s is evolving into a social occasion centered on friendship, community, and shared experiences with activities such as sip & paint studios, Pottery and craft workshops, wine tasting rooms, and cocktail-making spaces. These venue types see a clear uplift compared to standard February booking patterns, reflecting a growing appetite for shared, activity-led celebrations.
In New York, Valentine’s week bookings show a clear increase in group-based celebrations, with experiential venues particularly in demand across Manhattan and Brooklyn. Creative workshops and tasting rooms are outperforming traditional private dining spaces, suggesting that New Yorkers are opting for social experiences over classic romantic dinners.
Chicago and Austin are emerging as leaders in the experiential Valentine’s trend. Both cities show strong growth in bookings for hands-on venues such as craft workshops, cocktail classes, and private event spaces designed for mid-sized groups.
The data suggests that in these cities, Valentine’s week is increasingly being treated as a social event rather than a romantic one.
Los Angeles also demonstrates a notable shift, with rising demand for private event spaces suitable for friend groups. Wine tastings, creative studios, and flexible private dining spaces are among the fastest-growing categories during Valentine’s week.
Galentine’s Day has evolved into a mainstream celebration. As friendship-focused events grow in popularity, Valentine’s week is becoming more inclusive and experience-led.
Cold Weather Impact
Fiserv’s January Small Business Index, released today, shows how Winter Storm Fern and extended cold weather during the second half of January impacted the restaurant industry, with sales falling -1.8 percent YoY and foot traffic falling sharply -3.6 percent compared to 2025. When adjusted for inflation, sales fell -5.6 percent YoY.
Highlights:
-
Bars and Pubs: Saw a sales decline of -0.8 percent MoM, but the opposite with a +0.8 percent YoY sales increase. Foot traffic fell -1.0 percent MoM and rose +0.5 percent YoY.
-
Quick-service: Sales dropped ‑3.4 percent YoY and ‑2.0 percent MoM, alongside steep foot traffic losses of -1.9 percent MoM and -5.0 percent YoY.
-
Full-service: Sales fell -0.6 percent MoM and -0.7 percent YoY, with foot traffic falling -0.4 percent MoM and -1.0 percent YoY.
What does this mean?
Severe weather and the "holiday hangover" have created a significant hurdle for SMB restaurants, as evidenced by the sharp year-over-year decline in foot traffic. While nominal sales fell slightly, the bigger decline in inflation-adjusted sales reveals that diners are pulling back on spending even more than the headline numbers suggest.
Hospitality and Leisure Job Stats
New data from ADP Research revealing that job stayer pay growth in leisure and hospitality is outpacing job changer pay growth year-over-year more than any other industry (chart pasted below). In January, leisure and hospitality workers who stayed with their employers saw a 2.5 percent pay premium over the sector’s job-changers (chart pasted below).
These numbers indicate that competition in the field is still super strong. In the restaurant industry specifically, what was once a sector dominated by part-time workers in their teens has seen many young adults in their 20s begin making it a long-term career.

Top Ten Flavor Influences
Tastepoint by IFF identified ten flavors expected to shape the North American food and beverage landscape in 2026. These predictions spotlight flavors anticipated to trend in retail, food service and beyond throughout the coming year.
At the intersection of science and creativity, Tastepoint draws on decades of experience to guide brands in developing trend-driven food and beverage products that ignite inspiration and delight consumer palates.
Each year, Tastepoint forecasts ten flavor trends based on data-driven market analysis, food service menu tracking, social listening and changes in consumer behavior. The 2026 list offers insights across categories including confectionery, beverages, dairy, culinary, snacks and bakery. It reflects key trend movements such as nostalgia and better-for-you and identifies global flavors expected to gain traction in North America.
The top 10 flavors to watch in 2026 are:
-
Mandarin: Already popular in juices and sparkling beverages, this citrus favorite is poised to expand into cocktails, coffee, frozen novelties, salad dressings and sauces.
-
Cherry: The sweet and tart flavor of cherry delivers a powerful sense of nostalgia and is expected to lead the way in new beverage launches and appear in snack bars and mixes, confectionery, and dairy applications.
-
Sweet Corn: Historically a staple dish worldwide, sweet corn is seeing renewed interest. Driven by the popularity of Mexican street corn, or Elote, and other global favorites, its versatility continues to expand.
-
French Onion Soup: A timeless comfort food, its deep, savory profile is projected to move into new menu applications.
-
Cola: With its iconic flavor profile currently experiencing a resurgence, cola is expected to move beyond beverages and into unexpected categories such as ice cream and bakery.
-
Limoncello: As consumers seek authentic, premium experiences, this quintessential Italian liqueur is expected to influence new categories, from baked goods to ready-to-drink teas and coffees.
-
Sweet Heat: Often known as “swicy”, the crave-worthy combination of sweet and spicy flavors is gaining traction, expanding beyond culinary and snacks, into ice cream, cocktails and beyond.
-
Pancake: This comforting, sweet flavor is predicted to break free from breakfast and appear in a wide range of new formats fit for scoop shops or late-night snacks.
-
Tiramisu: Offering a decadent, layered flavor experience, tiramisu-inspired products are well positioned to appear in categories beyond the bakery space.
-
Chai Spice: With chai’s rise as a global favorite, its sweet-and-spicy profile is gaining popularity in food and beverage applications. Its aromatic depth offers a comforting yet elevated alternative to traditional warming spices.
U.S. Spirits Market
The Distilled Spirits Council of the United States (DISCUS) reported during its annual economic briefing that U.S. spirits maintained its market share lead in 2025, even as the overall beverage alcohol market softened. Spirits ready-to-drink cocktails (RTDs) continued to surge in popularity, emerging as the industry’s strongest growth category.
Spirits supplier sales in the United States totaled $36.4 billion in 2025, down -2.2 percent from the year before, while volumes rose 1.9 percent to 318.1 million 9-liter cases.
For the fourth year in a row, the spirits sector maintained its market share lead, reaching 42.4 percent in 2025. The spirits sector has gained more than 13 points of market share since 2000, with each point representing $860 million in supplier revenue.
In an overview of the spirits sales trends in 2025, DISCUS reported that spirit ready-to-drink cocktails were a bright spot for the industry growing to a nearly $4 billion category.
Premixed cocktails including spirits RTDs reached $3.8 billion, up 16.4 percent year‑over‑year. Spirits RTDs have more than doubled their market share since 2021 and are up 11 percentage points in market share in 2025, while malt-based seltzers are down 14 points. All other major categories showed declines.
Top Spirits
-
Vodka sales total $7 billion (-3 percent)
-
Tequila/Mezcal sales total $6.4 billion (-4.1 percent)
-
American Whiskey sales total $5.1 billion (-0.9 percent)
-
Premixed cocktails including spirits RTDs up to $3.8 billion from $540 million (+16.4 percent)
-
Cordials sales $2.7 billion (- 3.2 percent)
Trade Tensions
During the briefing, DISCUS reported that global trade tensions continue to weigh on distillers including unresolved retaliatory tariff threats, the removal of American spirits from most Canadian retail shelves, and broader uncertainty that hinders long‑term planning. 2025 also marked some positive trade developments including the continued protection of American spirits from retaliatory tariffs and reduced tariffs in India and Turkey.
Gen Z and AI Ads
According to research from the Interactive Advertising Bureau (IAB), 82 percent of advertising executives think Gen Z feels positive about AI-generated ads, but the truth is that only 45 percent feel that way. These findings illustrate a disconnect between the perception of AI use in advertising and how it is received by the demographics it aims to reach. Experts forewarn that executives need to rethink how they connect with Gen Z in a bid not to lose touch with key audiences.
While 71 percent of Gen Z believe they have seen AI-generated ads online, a 17 percent increase since 2024, sentiment toward the technology remains cautious. 39 percent reporting negative feelings toward AI-created advertising, nearly double the Millennial rate.
The perception gap extends to brand trust, with nearly 1 in 3 (30 percent) of Gen Z describing AI-ad brands as inauthentic, while 24 percent rate AI use in this way as unethical.
This perception gap reflects a broader psychological shift. According to the latest research published in Cyberpsychology, Behavior, and Social Networking, for decades, video and photography served as digital proof, a visual evidence that something had truly happened. But with the rapid evolution of AI-generated video, realism no longer guarantees authenticity.
As media psychologists warn, society is entering a post-visual-certainty era in which emotional realism can exist without reality. In that environment, younger, AI-fluent consumers are becoming more skeptical rather than more impressed.
Of older consumers, studies find they too dislike the use of AI in advertising, but report lower confidence in their ability to spot AI-generated ads, with 13 percent of 56-75 year olds responding positively when asked if they could tell when an ad is made using AI, versus 44 percent of 18-35 year olds opening the gate to manipulation.