MRM Research Roundup: To-Go Trends, State of the Plate, and Black Market Reservations
27 Min Read By MRM Staff
This edition of Modern Restaurant Management (MRM) magazine's Research Roundup features trends in off-premise, coffee wars, the AI lifeline, the return of lunch, and how teens spend their dollars.
Off-Premises Dining Is Essential
Nearly 75 percent of all restaurant traffic now happens off-premises—meaning that almost three out of four restaurant orders are taken to go. New data from the National Restaurant Association’s2025 Off-Premises Restaurant Trends report highlights how off-premises dining has become both a consumer preference and business essential, with the convenience and availability of takeout, delivery, and drive-thru now deeply embedded in everyday life.
“Off-premises dining has become a key revenue driver and an essential way to engage consumers,” said Dr. Chad Moutray, Chief Economist at the National Restaurant Association. “It now accounts for a larger share of sales for 58 percent of limited-service and 41 percent of full-service operators compared with 2019—providing a critical path to restaurant resilience and growth despite ongoing economic pressures.”
Who’s Driving Demand – and Where
- Gen Z and millennials are leading the way: Two-thirds say takeout is essential to their lifestyle, and nearly 6 in 10 use takeout or drive-thru at least weekly. More than 60 percent say they’re ordering off-premises more often than a year ago.
- Demand spans regions: Most urban consumers say takeout or drive-thru is essential, while 67 percent of rural consumers wish they had more options for takeout—highlighting areas for growth.
With off-premises already accounting for most of the traffic, it’s not just a trend—it’s a critical pathway for operators to drive growth, meet evolving expectations and stay competitive.
- Preferences vary by age and format: Mobile ordering is mainstream, used by 57 percent of adults recently including 74 percent of millennials and 65 percent of Gen Z adults. Older adults still prefer in-person ordering. Takeout is the most frequent off-premises method, followed by drive-thru and delivery.
- Restaurants are responding: 65 percent of limited-service operators now offer delivery, with many expecting curbside and dedicated takeout areas to be even more common in 2025. Fewer fullservice restaurants currently offer off-premises services; however, these operators see potential in the trend—43 percent expect curbside pickup to grow, 31 percent anticipate more dedicated takeout counters, and 12 percent foresee more drive-thru lanes. Many see these options not just as operational updates, but as strategic growth opportunities in a changing market.
What Customers Want and How Operators Can Deliver
Consumers want speed, ease of use and rewarding experiences. 94 percent of all consumers say speed is critical, with over 9 in 10 citing customer service as a top priority. Three-quarters of delivery customers value tech-enabled ordering and payments.
Value matters, too—over 80 percent of consumers utilize deals like "Buy One, Get One” offers, combo meals, or real-time specials. Loyalty programs also matter: 65 percent of drive-thru users and over 60 percent of takeout and delivery users say membership affects where they order.
Meanwhile, according to consumers, here are some opportunities for restaurants:
- Packaging: 90 percent say they’d order a greater variety of items if the food maintained on-premises quality during delivery; over half would pay more for premium packaging that supported quality during transport.
- Real-time deals: Nearly 9 in 10 would use limited-time app-only offers.
- New formats: 67 percent are interested in bundled meals, 70 percent in meal kits, and 62 percent in subscriptions.
- New tech: Half of Gen Z adults (50 percent) and millennials (52 percent) say they’d consider ordering from an AI-generated video assistant.
With off-premises already accounting for most of the traffic, it’s not just a trend—it’s a critical pathway for operators to drive growth, meet evolving expectations and stay competitive.
Signs of Restaurant Recovery
The restaurant industry showed promising signs of recovery in March 2025, as large-chain restaurant transactions saw notable improvement, according to Circana, LLC. Transactions for the four weeks ending April 6, 2025, were flat (0 percent) year-over-year. This marks a significant gain over February’s four-percent decline, showcasing the industry’s remarkable resilience in the face of economic uncertainty and low consumer confidence.
“March's performance is an encouraging indication of the restaurant industry’s strength and adaptability,” said Tim Fires, president of Global Foodservice for Circana. “Restaurants introduce us to new culinary adventures with international flavors and creative takes on classic dishes. They deliver convenience when cooking isn't an option and offer fantastic moments to celebrate with loved ones, which is crucial during periods of uncertainty.”
Key Highlights
Insights from Circana’s CREST Performance Alerts reveal several positive trends contributing to the restaurant sector’s renewed momentum in March:
-
Improved Transaction Decline: For the four weeks ending April 6, 2025, large-chain restaurant transactions were flat (0 percent) YoY, a notable improvement from February’s 4 percent decline.
-
All Dayparts Contributed to Improvements:
-
The morning meal was the best performing daypart and made the most progress, recovering from -6 percent in February to 3 percent in March. This rebound is largely driven by an increase in office occupancy rates as more companies implement stronger return-to-office policies.
-
Along with the morning meal, snacking was a top-performing daypart, with transactions slightly growing YoY during the March period.
Strength Across Restaurant Formats:
-
Both quick-service restaurants (QSRs) and full-service restaurants (FSRs) showed performance improvement relative to February.
-
Within QSRs, fast-casual restaurants led the way, growing transactions by 2 percent in March.
Resilience Amid Uncertainty
Despite ongoing economic challenges, the March results highlight the enduring relevance of restaurants in consumers’ lives. From morning coffee runs to afternoon snacks and sit-down dinners with family, restaurants continue to be essential for both convenience and experiences that go beyond what can be recreated at home.
“The positive momentum we saw in March shows how adaptable the restaurant industry is and how it can thrive even when market conditions are constantly changing,” added Fires.
State of the Plate
Olive Garden is the most popular casual dining restaurant with Americans in 2025, with 19 percent having dined at the Italian-themed restaurant in the past 90 days, according to a new report from YouGov.
YouGov’s State of the plate: US casual dining report 2025 finds Olive Garden leading the highly competitive restaurant category, especially middle class Americans. The Darden Restaurant-owned brand rated top for fast service, fresh food, accurate orders, and customizable menu options.
Drawing on surveys of 9,400+ American adults conducted for YouGov’s new QSR CategoryView solution, the report reveals that 66 percent go to a casual dining restaurant at least once per month. Of those diners, 51 percent spend more than $100 per month, and 28 percent spend more than $200.
“Casual dining is a fast-moving, high-pressure category—and marketing leaders are feeling that pressure more than ever,” says Mark Fantino, SVP and Head of Commercial at YouGov America. “With CMO tenure at a low, success depends on being able to cut through the noise and prove what’s working, fast. YouGov helps marketers keep pace with shifting consumer preferences, brand perceptions, and campaign performance in real time—so they’re not just reacting, they’re anticipating. In a world where marketing is expected to deliver both brand equity and measurable growth, that clarity is mission-critical.”
The report found that:
-
Chili’s Grill & Bar is winning over young diners, with 23 percent of those aged 18-29 visiting the Brinker International-owned brand in the past 90 days.
-
Applebee’s Neighborhood Grill + Bar is the most popular brand in the Northeast and Midwest, with 20 percent of Americans in each region having visited in the past 90 days.
-
Texas Roadhouse rated highest for great tasting food with a net agreement score of 31.0 percent, ahead of Olive Garden (30 percent) and The Cheesecake Factory (25 percent).
-
The Cheesecake Factory rated highest for innovation with a net agreement score of 8 percent, beating out Texas Roadhouse (7 percent) and Chili’s (4 percent).
-
Quality of food (78 percent) is the top reason why Americans select a casual dining restaurant, ahead of good service (62 percent) and value (51 percent).
-
A clean dining area (65 percent) is the most important feature for diners, ahead of a short wait for a table (55 percent) and value/discount menus (44 percent).
-
Frequent weekly diners are more likely to consider features like in-restaurant TVs (64 percent more likely), mobile ordering (36 percent more likely), and alcohol / bars (27 percent more likely) to be important drivers for restaurant choice.
State of the plate: US casual dining report 2025 draws upon online surveys of 9,400 Americans aged 18+ between November 1, 2024 and March 31, 2025, as part of YouGov’s QSR CategoryView solution. QSR CategoryView is updated monthly and provides a comprehensive view of trends across Fast Food, Casual Dining and Specialty Dining. Brand tracking surveys provide an up-to-date view of consumer perceptions of 75+ restaurants across a variety of brand health metrics and attributes. For more details on the study’s methodology, please see the full report.
Who's Winning the Coffee Wars
Dutch Bros outperformed rival coffee chains Starbucks and Dunkin’ in an AI-powered analysis of customer feedback completed by Chatmeter, the multi-location customer intelligence platform.
Chatmeter analyzed more than 300,000 customer reviews using its new AI-powered competitive analysis tool, Pulse Ai: Competitive Intelligence, to identify the strengths and weaknesses of the three biggest coffee chains and rank them in several categories. Chatmeter’s Competitive Intelligence, available this spring, will enable every multi-location brand to understand their competitive positioning, with the ability to filter by city, state and region to identify competitive opportunities.
Dutch Bros came out on top in every category, including customer service, in-store experience, value, drinks, lattes, iced coffee, cold brew and frozen beverages. While Starbucks and Dunkin’ dominate the United States market with 17,000 and 9,700 locations, respectively, Dutch Bros has emerged as a formidable competitor, with plans to double its footprint to over 2,000 stores by 2029.
Customers love Dutch Bros for the friendly service provided by its “broistas” and its wide variety of unique and customizable drinks, the report found. Starbucks and Dunkin’ faced criticism for rude, slow customer service and inconsistent drink quality. Starbucks saw the biggest decline in sentiment toward its customer service in 2024 (6.2 percent) compared to 2023, while Dunkin’ saw a slight improvement (0.5 percent).
Operational issues may threaten Dutch Bros’ ascent. The analysis found the chain’s drive-thrus can be a major choke point, with customers complaining of excessive wait times and disorganized order-taking. Dutch Bros saw a decline in consumer sentiment toward its customer service of about 2.5 percent in 2024.
Nearly half of consumers (45 percent) said they had to cut back on their coffee shop spending in the past year, a Chatmeter survey found. And customers questioned the value they got for their money at all three chains in written reviews, citing high prices, watery drinks and dissatisfying customer service. A common complaint was that drinks were not full or had too much ice. While Dutch Bros was seen as offering the best value by its customers, sentiment around value declined for all three brands–6.3 percent for Starbucks, 4.3 percent for Dunkin’ and 2.6 percent for Dutch Bros.
Consumers ranked affordability the top factor for choosing a coffee shop (25 percent), followed by quality of food and beverage (17 percent), convenience (8 percent), friendly service (8 percent) and quick service (7 percent). The median price they would pay for a medium cup of coffee was $4. Over one-third (36 percent) visited a coffee shop in the past year to treat or reward themselves, while 23 percent did so to socialize and 15 percent to use the wifi or get work done.
However, many reported the experience didn’t meet expectations, with nearly a quarter reporting that the drink they wanted was out of stock (23 percent) or that a coffee shop got their order wrong (22 percent).
“As impending tariffs threaten to inflate prices, coffee shops must prove their value to consumers,” said Mazur. “In an environment where you can’t compete on price, being able to pinpoint the right customer experience investments to position yourself competitively is essential. AI now allows you to do this across all your locations, at scale.”
AI in Restaurants
It's barely overkill to say restaurants are in crisis — with labor and rent pressures, plus tariffs that could cost U.S. restaurants over $12 billion, cutting the average small operator’s profits by 30 percent.
With few options left for restaurant operators, AI is becoming a real lifeline, softening the impact by helping operators streamline manual tasks, reduce costs and run leaner operations — without sacrificing the guest experience.
AI in restaurants is no longer an experiment but an essential tool. A study from SevenRooms reported 79 percent of U.S. restaurant operators say they are already using AI, and 99 percent of those using AI report tangible benefits:
-
Faster response times to guest inquiries (48 percent)
-
Quicker decision making (47 percent)
-
Reduced operational costs (39 percent)
-
Greater team efficiency (e.g., shorter hours, more work gotten done) (37 percent)
By delegating tasks that don’t require a human touch, operators can maintain their focus on the art of hospitality and delivering superb guest experiences – despite juggling the impacts of external factors.
The Return of Lunch
Lunch is back! At least that’s what you might think by looking at the data from a recent QSR and fast-casual-focused report from Placer.ai. That report analyzes numerous QSR and fast-casual chains, and finds that during Q1 2025, several saw solid foot traffic growth — including popular lunch chains like CAVA and sweetgreen.
Here are the Q1 2025 year-over-year foot traffic growth figures:
- Dave’s Hot Chicken: 59.3 percent
- CAVA: 19.7 percent
- Raising Cane’s Chicken Fingers: 12.3 percent
- sweetgreen: 11.2 percent
- Chipotle: 4.6 percent
- Panda Express: 3.8 percent
- Taco Bell: 3.7 percent
- Jersey Mike’s Subs: 3.1 percent
- Qdoba Mexican Grill: 1.5 percent
- Chick-fil-A: -0.7 percent
- Jack in the Box: -2 percent
- McDonald’s: -2.6 percent
- KFC: -2.8 percent
- Popeye’s: -3.2 percent
- Burger King: -3.4 percent
- Panera Bread: -3.8 percent
- Five Guys:-4 percent
- Wendy’s: -4.6 percent
Spending and Tipping Trends
New research released today by consumer research platform Attest finds Americans split on financial stability, with 39 percent reporting they feel financially secure and 38 percent sharing they feel financially insecure. In terms of their broader outlook on the future and economic prosperity, just 54 percent of Americans believe that the ‘American dream’ is still attainable.
The research is found within the second annual 2025 US Spending Trends Report and sheds light on consumer spending behaviors since President Donald Trump took office in January and began to enact his economic vision for the country. It explores key elements of personal finance—such as disposable income, spending intentions, debt levels, savings, credit usage, tipping habits, and payment preferences—to give a current snapshot of consumer financial well-being.
The survey consists of 2,000 nationally representative working-age US consumers and key findings include:
Disposable incomes remain low:
-
With only 39 percent of consumers reporting feeling either ‘very’ or ‘somewhat’ financially stable, the amount of disposable income Americans have after bills, rent, and mortgages is a critical factor driving spending habits.
Across all age groups, under half of consumers (41 percent) have monthly disposable income of less than $200, and 18 percent have less than $50 per month. Just a third of Americans have more than $500 disposable income per month, but 16 percent of high earners say they have more than $3000 per month.
But Americans resist the urge to run up their credit:
The number of Americans who say they have no credit cards, store cards or short-term loans has fallen from 25 percent in September to 22 percent today. Despite this, Americans are largely keeping debt under control: 42 percent have no debt on credit cards, 28 percent of consumers have less than $1,000 in debt and only 7 percent have more than $5,000.
The majority of Americans have less than $1,000 saved: The average American’s rainy day fund is looking incredibly dry, pointing to a population that is severely strapped for cash and vulnerable to sudden economic emergencies. The majority of those polled (51 percent) share that they have less than $1,000 saved, with 27 percent of this group sharing they have no savings at all.
Surprisingly, young people are the best at saving, with just 23 percent of 18-30-year-olds not having money put aside, while 29 percent of over-50s do not have any.
And plans to buy big ticket items are put on ice:
With the prospect of tariffs making consumer goods more expensive, purchase intent for big ticket items is down.
The number of Americans planning to buy a smartphone in the next 12 months has dropped 5 percentage points to 37 percent between September last year and March this year. The number planning to buy a new TV has dropped from 30 percent to 25 percent and the number planning to buy a computer or tablet has dropped to 28 percent from 31 percent. When faced with a big-ticket purchase, the majority of consumers (61 percent) say they are simply willing to‘wait and save up for it’.
U.S. consumers are still eating out and tipping more, but spending on clothing is down But while Americans may be counting the pennies, they are still spending at restaurants, and tipping more than ever. Takeout food remains the top ‘luxury’ spending item for Americans with 57 percent of consumers spending on to-go food every month (a slight drop from 59 percent in September last year).
A slightly smaller number (51 percent) eat out in restaurants each month. And in potentially good news for tipped workers, tips are rising as President Trump doubles down on his plans to enact‘no
tax on tips’. The largest percentage (29 percent) of people now tip 20 percent when visiting a restaurant, with just 21 percent tipping 10 percent.
The research found that 60 percent of Americans tip bartenders, 44 percent tip taxi drivers, 33 percent tip hotel cleaners and 24 percent tip hotel bellhops, while just 17 percent claim not to tip anybody.
Despite economic woes, nearly half of consumers still spend monthly on clothing (46 percent) and personal care (44 percent). But these figures have declined by -4 percentage points since September, potentially signaling trouble for these categories as tariffs drive price increases.
2025 Paytronix Loyalty Report
Paytronix published the 2025 Paytronix Loyalty Report, which finds that while loyalty check size is rising across both restaurant concepts and c-stores, flat check sizes are common. The report recommends a combination of AI-enhanced data analytics, qualitative behavior feedback along with gamification, AR and mobile loyalty tools to increase engagement and grow loyalty spend.
The report explores the forces shaping guest loyalty in 2025. It offers data-backed insights, real-world case studies, and actionable strategies to help restaurant and convenience store brands of all sizes harness the full potential of their loyalty programs.
While loyalty check size growth is promising, it's important to understand what this number means. Loyalty check size measures per-visit spend among loyalty members—not overall average order value (AOV). This distinction matters because a growing check size within loyalty programs doesn't always mean members are spending more than non-loyalty guests or that programs are driving net-new profitability.
Loyalty check sizes are growing, but not universally – 50 percent of FSRs, 44 percent of QSRs, and 31 percent of c-stores saw loyalty check sizes rise by more than 10 percent year-over-year.
Some brands saw declines – 12–25 percent of brands, across segments, saw declines in loyalty checks, which indicates that without good strategy, check size can stagnate or shrink, even as membership grows.
Flat check sizes are common – Around a quarter of QSR and FSR brands saw little movement, clarifying loyalty alone isn't enough to grow spend.
The report finds that AI-powered personalization, smart upsells, and relevant offers are key to increasing both loyalty check sizes and visit frequency, and ensures that loyalty program participation turns into revenue.
The report also discusses the following trends in data analytics and solutions that can provide brands with new opportunities to segment guests and further personalize guest interactions based on their behaviors.
It recommends the following three drivers for better personalization, which, in turn, helps programs align offers with guest preferences and deliver high-quality, thoughtful dining experiences.
AI-enhanced data analytics are a loyalty program game-changer that makes getting to the crux of customer motivations both quicker and more accurate. Smart brands are deploying it to explore different demographics, whether B2B, B2C, generational, or lifestyle-based, to create new opportunities.
Qualitative behavior feedback is software dedicated to scanning guest reviews across social media and analyzing voice/text messages, using sentiment analysis algorithms to read between the lines. It goes beyond spoken or written words to read the emotions behind them, indicating whether a guest was frustrated, angry, severely stressed, friendly, or enthusiastic.
“It is obvious that today more and more brands are becoming increasingly focused on one-to-one messaging and how to be as granular as possible when segmenting their audiences. It is so crucial for success, specifically when trying to increase the likelihood of visitation in the early parts of your relationship with a new customer,” said Rachel Peterson, loyalty strategist, Paytronix. “Personalization is key to impacting behaviors and determining who is more likely to visit versus someone who is unlikely to open your doors again. The more information you have, the more targeted you can be with your messaging and offers that get them to convert again, and again.”
Black Market Reservatons
In recent years, a black market for hard-to-get restaurant reservations has spread across the country. Technology has made it easy for individuals and companies to scoop up reservations from legitimate restaurant websites or restaurant-approved reservation sites like high-demand concert tickets. They then sell the reservations on unauthorized online resale sites and social media. This disconnect in the reservation process is causing operational challenges for restaurant operators, like costly no-shows, staffing needs to manage the expectations of customers who purchase these third-party reservations, and potential damage to a restaurant’s brand and reputation from a process outside of the restaurant operator’s control. For customers, these third-party reservations are making dining out at certain restaurants artificially more expensive or reservations impossible to obtain.
“Unlike ticket scalpers in entertainment, these third-party reservation sellers contribute nothing to the dining experience,” said Steve Woodruff, general manager of Commander's Palace in New Orleans. “They don’t make the food better, the service more seamless, or the atmosphere more enjoyable—they simply make it more expensive and frustrating."
As this emerging reservation black market proliferates across the country, customers and restaurants are growing frustrated with the practice. Over the past year, state governments have been working with the restaurant industry to create a regulatory framework to fix the system by giving control over their own reservations back to restaurants.
In a newly released survey of diners who had recently dined in a fullservice restaurant, nearly two in five were aware that there were third-party websites that charged diners for reservations. In fact, nearly 15 percent said they had been charged for a reservation.
More than two-thirds of consumers believe that unauthorized third-party restaurant reservations are harmful, and they are worried about the impacts that unauthorized third-party restaurant reservation companies are having on both customers and restaurants.
- 72 percent were concerned that certain restaurants are out of reach to even more customers because of reservation resale websites
- 70 percent were concerned that these middlemen reservations harm restaurants financially because they increase the number of no-show reservations for restaurants.
- Eighty percent of consumers want restaurants and customers to be protected from reservations made by third-party restaurant reservation companies, and seven in ten of them support legislation to prevent the unauthorized sale of restaurant reservations in their city.
“The more technology helps us find efficiency in our daily lives, the more it also creates new ways for people to game the system,” said Mike Whatley, vice president of State Affairs and Grassroots Advocacy for the National Restaurant Association. “We saw something similar in the early days of third-party delivery, when some companies were putting restaurants on their platforms without contracts or permission from the restaurant. This created chaos for the restaurant and the consumer. To solve this, many states took steps to regulate the relationship between the operator and the delivery companies to give control back to the restaurant. We believe the same kind of relationship between reservation sites and an operator should be required here.”
In 2024, the state of New York was the first to regulate the relationship, passing the Restaurant Reservation Anti-Piracy Act, which requires third-party online reservation sites to enter into a written agreement with restaurants before being able to list reservations. Several state legislatures have introduced similar legislation this year including California, Florida, Illinois, Hawaii, Louisiana, and Nevada.
"What these third-party reservation scalpers are doing is not helping restaurants—it’s an entirely separate business that exploits the system without contributing to the experience in any way,” said Rob Mosher, co-owner of Monteverde in Chicago. "Restaurants are built on hospitality—on making people feel welcome, on ensuring they have an incredible experience from the moment they walk in. When third-party scalpers and bots scoop up reservations, it completely negates that. Guests go online and see no availability and assume they’re shut out. We want people—whether they’re locals or visitors—to be able to book a table easily, without extra fees, without insider knowledge, and without jumping through hoops just to enjoy a meal with us."
“We are encouraged by the legislation that state legislatures are introducing to give control over restaurant reservations back to restaurants,” Whatley said. “Customers and restaurants want the system fixed so that it is fair and works for everyone.”
Teen Spending Trends
Piper Sandler Companies completes its 49th semi-annual Taking Stock With Teens® survey in partnership with DECA. The Piper Sandler equity research team now has more than 64 million data points around teen preferences and spending in the 24 plus years of researching teens.
Technology and social media
Instagram remains the most used social media app with 87 percent monthly usage among teens. TikTok ranks number two at 79 percent and Snapchat number three at 72 percent. Netflix holds strong as the number one choice for daily video consumption. 88 percent of teens currently own an iPhone with 25 percent expecting to upgrade to an iPhone 17 this upcoming fall/winter.
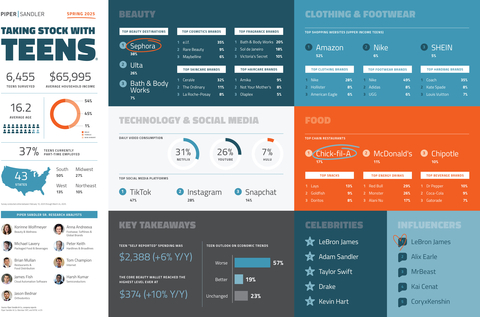
Restaurants and food
Chick-fil-A holds strong in its number one spot as the preferred chain restaurant among teens while McDonald’s and Chipotle Mexican Grill rank number two and three. Teens continue to prefer energy drinks over coffee and soda as their source of energy. Dr. Pepper is the number one favorite beverage brand followed by Coca-Cola and Gatorade.
Loyalty Trends
New research from Klaviyo found that 75 percent of diners are only loyal to one to five restaurants. The key to survival isn’t just great food, it's turning first time diners into regulars through smart, personalized marketing and loyalty programs.
Klaviyo research found:
-
74 percent of consumers expect restaurants to provide more personalized experiences in 2025, and yet only 34 percent say they have had a personalized experience in the past six months
-
40 percent of consumers prefer personalized discounts or want personalized dining suggestions
-
29 percent of diners actively participate in more than one restaurant loyalty program, while 22 percent participate in just one
-
37 percent of consumers subscribe to restaurant marketing updates for exclusive discounts or promotional offers
American Spirits Exports Report
U.S. spirits exports achieved a record $2.4 billion in 2024, up nearly 10 percent compared to 2023, according to the American Spirits Exports Report released today by the Distilled Spirits Council of the United States (DISCUS).
The growth in U.S. exports in 2024 was driven by a 39 percent increase in exports to the European Union (EU), which has zero tariffs on spirits imports. Exports to the rest of the world declined by nearly 10 percent, reflecting a softening of the global spirits market.
The report attributes the surge in exports to the EU to concerns over the potential return of tariffs on American Whiskeys in 2025, which were suspended in 2022. Another factor included the uncertainty at East and Gulf Coast ports due to labor negotiations and a brief port strike in the fall.
Driven in large part by the EU’s and UK’s retaliatory tariffs, total U.S. spirits and American Whiskey exports tumbled by 12 percent and 18 percent, respectively, between 2018-2021. American Whiskey exports to the EU, the largest American Whiskey export market, plunged 20 percent, from $552 million to $439 million during the same time.
Since the tariffs were suspended in 2022, American Whiskey exports to the EU surged nearly 60 percent, climbing from $439 million in 2021 to $699 million in 2024.
The report showed that U.S. spirits exports have quintupled since 2000, rising from $478 million in 2000 to more than $2.4 billion in 2024. Growth of U.S. spirits exports is due, in large part, to the U.S. spirits sector having a fair and reciprocal playing field with 51 countries that have provided tariff-free access for U.S. spirits, including the EU, Canada, Mexico, Japan and many others.
Nearly 86 percent of U.S. spirits exports go to countries that have eliminated tariffs on U.S. spirits. Additionally, approximately 98 percent of spirits imports originate from countries that have eliminated tariffs on U.S. spirits exports.
Other factors that have driven long-term growth in exports include the shift by consumers in key markets towards premium American spirits, the continued strengthening of the globalhospitality sector following the pandemic, and the rise in U.S. distilleries – from less than 100 in 2005 to nearly 3,100 today, many of which now export.
Uncertain Outlook for 2025
Swonger stated that the outlook for 2025 U.S. spirits exports is highly unpredictable due to ongoing trade disputes, negotiations and retaliatory tariffs. Canada, the second largest market for U.S. spirits exports, began imposing a 25 percent tariff on all U.S. spirits on March 13, and most Canadian provinces have removed all U.S. alcohol products from retail stores.
Additionally, U.S. spirits are being hit with a 160 percent retaliatory tariff in China and a 70 percent retaliatory tariff by Türkiye.
“We are thankful for President Trump’s early success in securing India’s reduction of its tariff on Bourbon from 150 percent to 100 percent,” said Swonger. “It’s our hope that the administration builds on this positive momentum by securing additional tariff reductions in India and reducing trade barriers in other countries.”
Continued long-term growth for the industry will be dependent on ensuring a permanent return to zero-for-zero spirits tariffs with the 51 countries and securing new market opening agreements with countries where high spirits tariffs are still applied, such as India, Vietnam, South Africa and others.
Among the report’s other key findings:
The EU is the largest export market for U.S. spirits.
-
Approximately 50 percent of U.S. spirits were exported to the EU (totaling $1.2 billion), making itthe largest export market.
-
The top five markets for U.S. spirits in 2024 were: 1) European Union ($1.2 billion); 2) Canada ($221 million); 3) United Kingdom ($137 million); 4) Australia ($131 million); and 5) Mexico ($126 million).
American Whiskey exports declined in 2024 but continue to lead U.S. spirits exports.
-
American Whiskey exports, which accounted for 54 percent of all U.S. spirits exports, dipped 5.4 percent to $1.3 billion.
-
The top five markets for American Whiskeys in 2024 were: 1) European Union ($699 million); 2) Australia ($113 million); 3) United Kingdom ($86 million); 4) Japan ($79 million); and 5) Canada ($73 million).
Cordials and Vodka exports reached record levels and drove overall U.S. spirits exports growth in 2024.
-
In 2024, exports of cordials and vodka reached new records, with cordials rising by 128 percent to $367 million and vodka increasing by 82 percent to $292 million compared to 2023.
Distilled spirits were exported from 43 states in 2024.
-
The top 10 states exporting U.S. spirits were: 1) Tennessee ($934 million); 2) Kentucky ($751 million); 3) Texas ($354); 4) Florida ($334 million); 5) Indiana ($142 million); 6) Illinois ($128 million); 7) California ($70 million); 8) Arkansas ($46 million); 9) Maine ($37 million); and New York ($29 million).
BeerBoard's Q1 2025 On-Premise Insights Report
BeerBoard released its Q1 2025 On-Premise Insights Report. All comparisons are same locations for the Q1 2025 (Jan1 – March 31, 2025) vs Q1 2024 (Jan1 – March 31, 2024).
BeerBoard’s proprietary data uncovers powerful trends and shifts in consumer behavior, giving key stakeholders — from brewers and distillers to chain operators — a real-time pulse on what’s happening at the tap and beyond.
Key Highlights from the Report
-
Draft Beer Volume: -8.5 percent
-
Packaged Beer Volume: +6.4 percent
-
Beyond Beer (RTDs, Seltzers, NA Beer): +15.8 percent in share, +24.7 percent in units sold
-
Wine Volume: +27 percent
-
Spirits Volume: +2 percent
-
Dry January Impact: NA beer up +33 percent in dollar sales YoY
Q1 2025 Trends:
-
Lager and Light Lager styles (imported and domestic) led sales across both draft and packaged. IPAs on draft were the third most popular style poured.
-
While still a small share compared to traditional beer, non-alcoholic beer and RTD cocktails are growing in share of on-premise packaged.
-
Whisky is still the most popular subcategory with tequila holding steady, while vodka slipped in overall share.
-
Pinot Grigio, Cabernet and Chardonnay were the top volume wine styles poured. In the ‘Others’ segment, reds like Pinot Noir and Merlot lead volume share.
Draft Beer
Draft Beer saw a -8.5 percent volume decline YoY in Q1. Despite this, certain brands delivered significant gains:
-
Corona Premier:
-
Golden Road Mango Cart
-
Pacifico
-
Modelo Especial
-
Michelob Ultra
Top Draft Styles by share:
-
Light Lager
-
Lager
-
IPA
-
Euro Ales
-
Amber Ale
Packaged Beer
Packed Beer performed strongly, up +6.4 percent in units.
Top Packaged Beer:
-
Michelob Ultra
-
Corona Extra
-
Miller Lite
-
Coors Light
-
Bud Light
Beyond Beer (RTDs, Seltzers)
Beyond Beer categories outpaced expectations, especially RTD cocktails which surged in both volume and rate of sale.
Top RTDs:
-
High Noon Sun Sips Pineapple
-
Surfside Iced Tea and Lemonade + Vodka
-
Nutrl Vodka Seltzer Watermelon
-
High Noon Sun Sips Peach
-
Stateside Vodka Soda Orange
Top Hard Seltzers:
-
White Claw Hard Seltzer Black Cherry
-
White Claw Hard Seltzer Mango
-
Truly Hard Seltzer Wild Berry
-
Topo Chico Strawberry Guava
-
Happy Dad Fruit Punch
Non-Alc Beer
In BeerBoard tracked on-premise channels, dollar non-alcoholic beer sales were up 33 percent and volume 27 percent in January 2025 vs. January 2024.
There was also a notable 66 percent increase in rate of sale (# of bottles/cans sold per location).
Top 10 non-alcoholic beer products make up 6.4 percent of total packaged volume.
Top 10 NA Beers
-
Heineken 0.0
-
Athletic Run Wild
-
Athletic Upside Dawn
-
Corona Non-Alcoholic
-
Athletic Free Wave
-
Samuel Adams Just the Haze
-
Guinness 0.0
-
Athletic Lite
-
Blue Moon Belgian White Non-Alcoholic
-
Budweiser Zero
Top RTDs by Volume:
Wine & Spirits
Wine saw a Q1 rebound with a +27 percent volume increase. Leading gainers were:
-
Pinot Grigio: +6.4 percent YoY
-
Sauvignon Blanc: +3.1 percent YoY
-
Sangria: +0.9 percent YoY
Spirits held steady at +2 percent growth in volume. Top categories by share:
-
Whisky: 27 percent share (+3.6 percent YoY)
-
Tequila: 21 percent share (+5.5 percent YoY)
-
Vodka: 16 percent share (-2.8 percent YoY)
Top Spirits Brands by Volume Growth:
-
Tito’s Vodka
-
Lunazul Blanco Tequila
-
Sauza Gold Tequila
-
Jameson Irish Whiskey
-
Jack Daniel’s
Top Cocktail:
-
Margarita (tequila-based): Dominant on-premise choice
Supply Chain Confidence
New research by GS1 US, the neutral not-for-profit information standards organization best known as the administrator of Universal Product Code (UPC) barcodes, reveals that supply chain professionals are highly confident (64 percent) or moderately confident (35 percent) in their ability to manage disruptions. However, confidence does not always equate to effective supply chain management, with nearly half (43 percent) reporting that they struggle to maintain supply chain visibility. The study, titled “Powering Supply Chain Confidence: The Role of Data and Standardization,”examines critical areas for driving supply chain confidence, resilience and effectiveness.
The survey supports that supply chain confidence is closely tied to key operational capabilities that strengthen supply chain management. Those companies with “high confidence” in their supply chains report having:
-
Centralized systems to manage disruption in real time (56 percent), which is further improved when they trust the accuracy and consistency of data in centralized systems (68 percent)
-
Full supply chain automation (72 percent), which gives them the ability to manage supply chain agility very well (61 percent)
-
The ability to handle consumer demand fluctuations very well (51 percent)
-
GS1 Standards use, which makes them very confident in their ability to respond to supply chain disruption (77 percent)
The survey also showcases that companies that implement real-time tracking technologies are 68 percent more likely to report improved visibility and better inventory control. Additionally, while 99 percent of all companies consider sustainability to be important, only half have taken steps to implement sustainability practices within their supply chains. Those advancing sustainability initiatives are prioritizing:
-
Waste management and recycling programs (52 percent)
-
Sustainable packaging (48 percent)
-
Certifications and impact accounting (48 percent)
-
Sustainable sourcing of materials (45 percent)
“Geopolitical tension, fluctuating demand and supply chain disruptions are putting immense pressure on organizations, forcing them to rethink and transform their supply chain strategies,” said Bob Carpenter, president and CEO, GS1 US. “To remain competitive, organizations must adopt greater agility, innovation and sustainability throughout the entire supply chain. Success now depends on real-time adaptability, enhanced visibility and operational innovation, all while maintaining a strong focus on sustainable business practices.”
The report, conducted by Redpoint exclusively for GS1 US, is based on a national survey of more than 500 supply chain professionals ranging from directors to C-level executives in the retail grocery, foodservice, healthcare, apparel and general merchandise industries.
Green Restaurant Awards
On the eve of Earth Day 2025, the prestigious 2025 Green Restaurant Awards recognize the restaurants and organizations in the restaurant industry which have accomplished a high level of environmental achievement in their respective categories. The Green Restaurant Awards include categories such as:
- Greenest Restaurant
- Greenest University
- Greenest Caterer
- Energy Efficiency Award
Greenest Restaurant
MUSE Global Kitchen is a 4 Star Certified Green Restaurant® in Calabasas, California which has implemented 71 environmental steps and earned 573.08 GreenPoints™, the most GreenPoints™ of any Certified Green Restaurant®. MUSE Global Kitchen serves 100 percent vegan food and has on-site solar panels that produce more than 65 percent of its annual energy usage. Along with those extraordinary steps, they compost pre-consumer and post-consumer food waste, purchase organic food products, use reusable products, and much more.
Greenest Caterer
4 Star Certified Green Caterer™ Big Delicious Planet (BDP) is the Greenest Caterer in America, earning more GreenPoints™ than any caterer. BDP has earned 454.66 GreenPoints™ by implementing 113 environmental steps since they became a 4 Star Certified Green Caterer™ in 2013. This caterer offers 25.66 percent vegetarian and an additional 14.16 percent vegan food options. With a geothermal heat pump, a heat recovery system, and windows covered in window film that blocks solar heat, BDP is making significant strides in saving energy.
Greenest Small Chain
Barcade’s chain of nine restaurants across the U.S. are all Certified Green Restaurants®. With an average of 46 environmental steps and 198 GreenPoints™ per restaurant, this chain is making significant sustainability strides. Barcade requires each of its new locations to open as a Certified Green Restaurant®.
Greenest University
Harvard University has 19 Certified Green Restaurants® located in Cambridge and Boston, MA. Collectively, these Certified Green Restaurants® have taken more than 1,000 environmental steps to earn over 4,200 GreenPoints™.
Greenest University Restaurant
4 Star Certified Green Restaurant® Village Center Dining at University of Colorado Boulder is the 2025 Greenest University Restaurant. Village Center Dining has implemented 71 environmental steps to earn 402.86 GreenPoints™. This Certified Green Restaurant® generates 16 percent of its energy usage with on-site solar panels. The dining hall composts in back-of-house and front-of-house, has 100 percent LED lights, reuses greywater for irrigation, and uses bulk packaging for 80 percent of condiments and 100 percent of milks and creamers.
Greenest Independent Restaurant
Independent Certified Green Restaurant® that received the most GreenPoints™
4 Star Certified Green Restaurant® Maine Beer Company, located in Freeport, ME, has implemented 65 environmental steps to earn 406.07 GreenPoints™. This Certified Green Restaurant® is making significant strides in the Energy Category, earning over 238 GreenPoints™ for Energy Star appliances, occupancy sensors, 100 percent LED lights, on-site renewable solar energy that generates over 37 percent of its energy usage, and more.
Greenest NYC Restaurant
4 Star Certified Green Restaurant® Well& By Durst, located in New York, NY, has implemented 73 environmental steps to earn 302.36 GreenPoints™. This Certified Green Restaurant® has 100 percent LED lights, Green-e Energy Certified Green Wind Power that offsets 100 percent of energy usage, and BOH and FOH composting.
Greenest Zoo Restaurant
4 Star Certified Green Restaurant® Base Camp Café at the Cincinnati Zoo in Cincinnati, OH has implemented 93 environmental steps to earn 367.20 GreenPoints™. This 4 Star Certified Green Restaurant® is significantly reducing its energy usage with window film that blocks solar heat, duct sealing, low flow restroom hand sinks, over 94 percent LED lighting, Energy Star appliances, and more.
Greenest National Park Restaurant
4 Star Certified Green Restaurant® Carvers’ Café at Mt. Rushmore in Keystone, South Dakota has implemented 80 environmental steps and earned 477.65 GreenPoints™. Carvers’ Cafe has on-site solar panels that produce over 57 percent of its annual energy usage, on-site BOH composting, and much more.
Greenest Corporate Cafeteria
4 Star Certified Green Restaurant® Mars Wrigley GIC – Better Moments Cafe, located in Chicago, IL, has implemented 80 environmental steps to earn 352.07 GreenPoints™. This café is making significant strides in the Energy Category, earning 130.88 GreenPoints™ for a heat recovery system, Energy-Star appliances, occupancy sensors, and more.
Greenest K-12 School Cafeteria
MUSE Global Kitchen, also the winner of the 2025 Greenest Restaurant Award, is the greenest K-12 School Cafeteria in North America. This 4 Star Certified Green Restaurant® in Calabasas, California has implemented 60 environmental steps and earned 573.08 GreenPoints™, the most GreenPoints™ of any K-12 Certified Green Restaurant®.
Greenest K-12 Contractor
Flik Hospitality has 25 Certified Green Restaurants® located across the U.S. in K-12 schools. These Certified Green Restaurants® have collectively taken over 1,080 environmental steps to earn more than 4,630 GreenPoints™.
Reusables & Green Disposables
4 Star Certified Green Restaurant® Chauncey’s Choice at Coastal Carolina University in Conway, South Carolina earned 128.58 GreenPoints™ in the Reusables & Disposables category. This restaurant serves all to-go orders in reusables, supplies reusable dishes in-house, uses 100 percent reusables for staff meals, and more.
Energy Conservation & Renewable Energy
4 Star Certified Green Restaurant® Carvers’ Café at Mt. Rushmore in Keystone, South Dakota earned 339.66 GreenPoints™ in the Energy category. This restaurant has an on-site solar array that generates more than 55 percent of its energy use, 100 percent LED lighting, and three walk-in coolers with strip curtains, each of which saves enough energy to power a residential home for an entire year.
Sustainable Food
4 Star Certified Green Restaurant® MUSE Global Kitchen earned 103 GreenPoints™ in the Food category. This restaurant purchases Certified Organic food, is 100 percent vegan, and has on-site food production.
Chemical & Pollution Reduction
4 Star Certified Green Restaurant® Putnam Dining at UConn earned 61.25 GreenPoints™ in the Chemicals & Pollution category. This Certified Green Restaurant® is located in a brownfield redevelopment building. Putnam Dining at UConn also uses a green certified pest management system, green hand soaps, and green cleaners.
Waste Reduction
4 Star Certified Green Restaurant® Cougar Woods Dining Commons at University of Houston in Houston, TX earned 99 GreenPoints™ in the Waste category by reducing the amount of waste that ends up in a landfill with back and front of house composting, weekly food bank donations, and reusable plates, cutlery, and recycling plastics, glass, aluminum, paper, cardboard, grease, batteries, electronics, appliances, and renovation materials.
Water Conservation
4 Star Certified Green Restaurant® at Cincinnati Zoo and Botanical Garden earned 44.75 GreenPoints™ in the Water category. This Certified Green Restaurant® has an underground water harvesting system to store rain water, uses high efficiency pre-rinse spray valves, low flow kitchen and restroom hand sinks, Energy Star qualified appliances, low water landscaping, and more.
Sustainable Seafood
This year, 4 Star Certified Green Restaurant® Cougar Woods Dining Commons at University of Houston and 4 Star Certified Green Restaurant® Mars Wrigley GIC – Better Moments Cafe in Chicago, IL, tied for the 2025 Sustainable Seafood Award. These two restaurants each earned 15 GreenPoints™ for serving 100 percent sustainable seafood.
Green Marketing
3 Star Certified Green Restaurant® Fresh Food Company at Western Kentucky University in has earned 19.5 GreenPoints™ in the Education & Transparency category. With certification signage, a sustainability event hosted on campus, and more, this Certified Green Restaurant® is implementing creative and effective marketing to be transparent about its sustainability and to educate its students and the public.
Green Social Media
Certified Green Caterer™ Tall Guy and a Grill showcases its certification across Instagram, Facebook, and LinkedIn. With regular social posts about its sustainability steps and a sustainability story highlight on Instagram, this Certified Green Caterer™ is promoting its certification in effective and creative ways.
Green Employee Leader
An employee in the restaurant industry who is a champion of sustainability at their Certified Green Restaurant® and in the restaurant community
We are proud to recognize Valerie Davis as the recipient of the 2025 Green Employee Leader Award. Through her exceptional leadership and dedication, Valerie has played a pivotal role in bringing numerous airports into the Green Restaurant Association’s certification program. Her passion for sustainability shines through in her relentless efforts to guide and encourage airport partners to adopt impactful environmental changes. Valerie’s commitment to upholding the GRA’s rigorous standards contributes meaningfully to a greener, more sustainable foodservice industry.
Green Leader
Gregory Godfrey, Vice President of Marketing & Communications at the Flatiron NoMad Partnership, and Deepka Sani, Director of Board Relations and Individual Giving at Madison Square Park Conservancy (MSPC), are the winners of the 2025 Green Leader Award! Greg and Deepka were instrumental in launching NYC’s First Green Dining Destination™ in the Flatiron and NoMAD neighborhoods. Due to their tireless dedication and support, the Green Restaurant Association, Flatiron NoMad Partnership, and MSPC were able to recruit a strong roster of highly reputable local restaurants in the Flatiron/Nomad. These restaurants succeeded in attaining the Certified Green Restaurant® and banded together to form NYC’s First Green Dining Destination™, a beacon of sustainability attracting people from all over the world to The Place to Dine Green™.
"I applaud all of the 2025 Green Restaurant Award winners on their commitment to improving their environmental impact,” said Michael Oshman, CEO and Founder of the Green Restaurant Association. “These Certified Green Restaurants®, organizations, and individuals have set an example for others across North America to follow. By taking great environmental leadership in the restaurant industry, the 2025 Green Restaurant Award winners are proving it’s possible for any restaurant, organization, or employee to dramatically improve their environmental footprint today.”