MRM Research Roundup: Tipping Trends, ‘Peak Personalization’ Era, and Cottage Cheese Comeback
11 Min Read By MRM Staff
This edition of Modern Restaurant Management (MRM) magazine's Research Roundup features World Cup revenue, summer hiring, tipping trends, cottage cheese popularity, and
Yelp’s Fastest Growing Brands
Key takeaways from Yelp's 2026 Fastest Growing Brands report include:
● Drive-thru chain 7 Brew tops the list as America's fastest growing brand, with 244 percent growth in consumer interest.
● We’ve reached peak personalization: the fastest growing brands invite consumers to take part in creating their experience, from mixing the perfect beverage to customizing spice levels.
● The "dirty soda" trend has gone fully mainstream — Yelp searches increased 675 percent in 2025 — with brands like 7 Brew, Sonic Drive-In, and Taco Bell adding customizable sodas and energy drinks to their menus.
● Chicken dominates the list with eight brands, including Bojangles, Wingstop, and Dave's Hot Chicken, making it the most represented cuisine category. Across the country, a mix of emerging concepts and household names are rapidly expanding.
They’re drawing crowds and earning the kind of consumer loyalty that drives Yelp reviews, searches, and repeat visits. Yelp's third annual list of the Fastest Growing Brands spotlights the 50 companies that achieved the most impressive growth and consumer momentum over the past year.
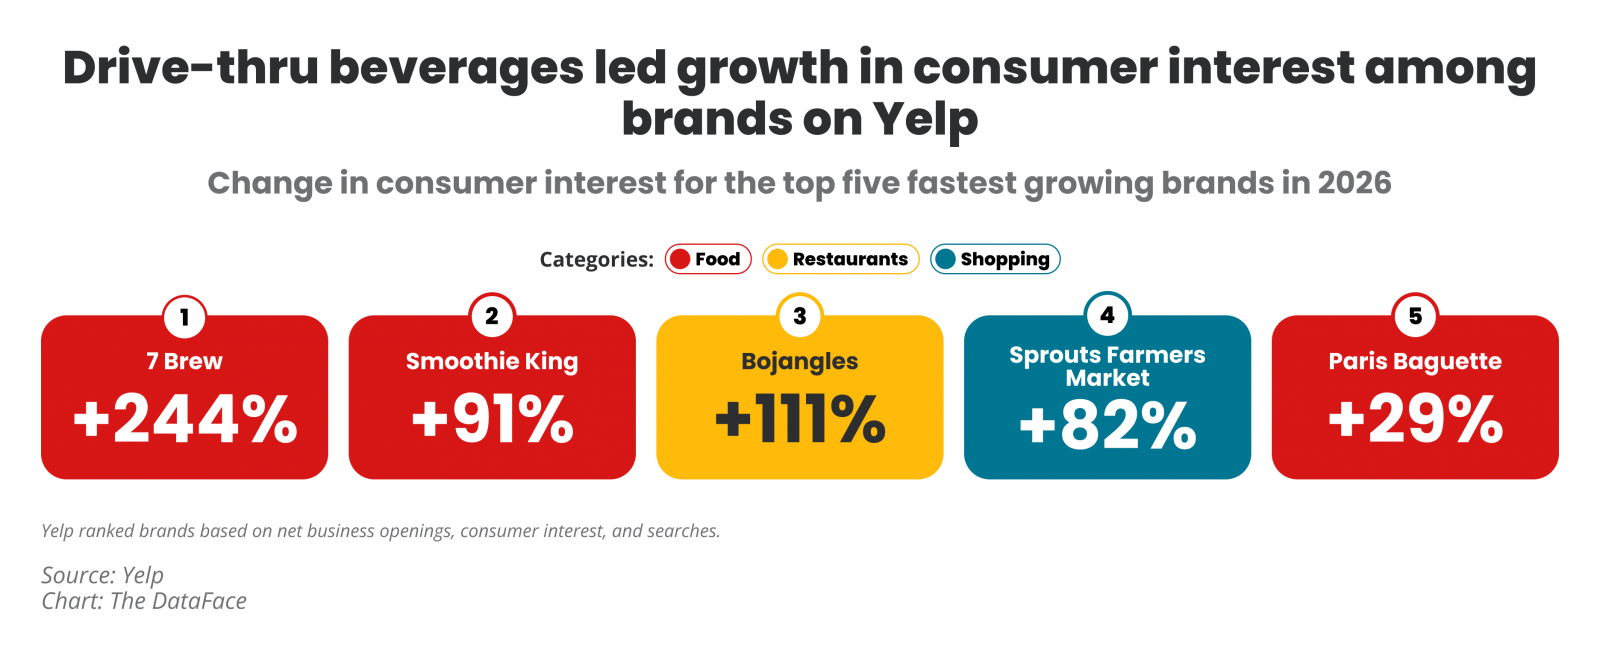
Change in consumer interest for the top five fastest growing brands in 2026
1. 7 Brew — +244 percent
2. Smoothie King — +91 percent
3. Bojangles — +111 percent
4. Sprouts Farmers Market — +82 percent
5. Paris Baguette — +29 percent
Yelp ranked brands based on net business openings, consumer interest, and searches. This report highlights the fastest growing brands, making repeat appearances more rare unless a brand sustains rapid growth over multiple years. Several brands from past years’ reports—including Scooter's Coffee (no. 13), Nothing Bundt Cakes (no. 9), and 2024’s Fastest Growing Brand CAVA (no. 31)—return this year, reflecting continuous year-over-year momentum. The ranking is based on a blended weighted metric of net new business openings, consumer interest, and Yelp searches in 2025 compared to 2024.
With no interior seating or lobby, just a lane, a window, and a high-energy team, this year’s fastest growing brand, 7 Brew, has built its brand on speed and customization. According to Yelp data, the coffee chain saw a whopping 244 percent growth in consumer interest in 2025, an impressive feat given 7 Brew debuted on the Fastest Growing Brands list last year at number 23.
Americans are increasingly centering their morning routines around caffeinated drive-thru beverages. Three other coffee brands landed in the top 50: Black Rock Coffee Bar (no. 8), Scooter's Coffee, and Dutch Bros (no. 38). Beverage-forward concepts Smoothie King (no. 2) and Sonic Drive-In (no. 48), also highlight how quick-service beverages have become a must-have for millions of Americans.
This is more than a caffeine story. “Dirty sodas”—customized fountain drinks mixed with flavored syrups, cream, and fruit—started as a regional ritual in Utah before going mainstream after being highlighted in Hulu's “The Secret Lives of Mormon Wives.” Now, brands like 7 Brew are riding the wave with their own take, 7 Fizz, as Gen Z and millennial consumers share popular “What's your order?” social content. Others like Scooter’s Coffee, Sonic Drive-In and even Taco Bell (no. 12) are adding these sweet treats to mix up their menus, with some offering energy drink add-ons for folks who prefer a coffee-less buzz. Yelp first forecasted the rise of dirty sodas in 2022, and searches have skyrocketed (up 2,547 percent) since then, increasing 675 percent in 2025 alone.
If the drive-thru beverage is the ritual that starts the American day, chicken is the protein that fuels the rest of it. Eight chicken-focused brands appear on this year's list, making chicken the single most dominant cuisine category on the list.
The chicken boom is fueled in part by America's full-blown protein obsession. From protein-fortified snacks lining grocery aisles to fast-casual chains promoting high-protein bowls, the macronutrient has become a defining feature of how Americans eat. Its dominance on this list also reflects the personalization theme: consumers can choose traditional Southern at Bojangles (no. 3), Nashville hot at Dave’s Hot Chicken (no. 18), Korean-fried at bb.q Chicken (no. 49), or even gas station-fried at Krispy Krunchy Chicken (no. 34) or Champs Chicken (no.45).
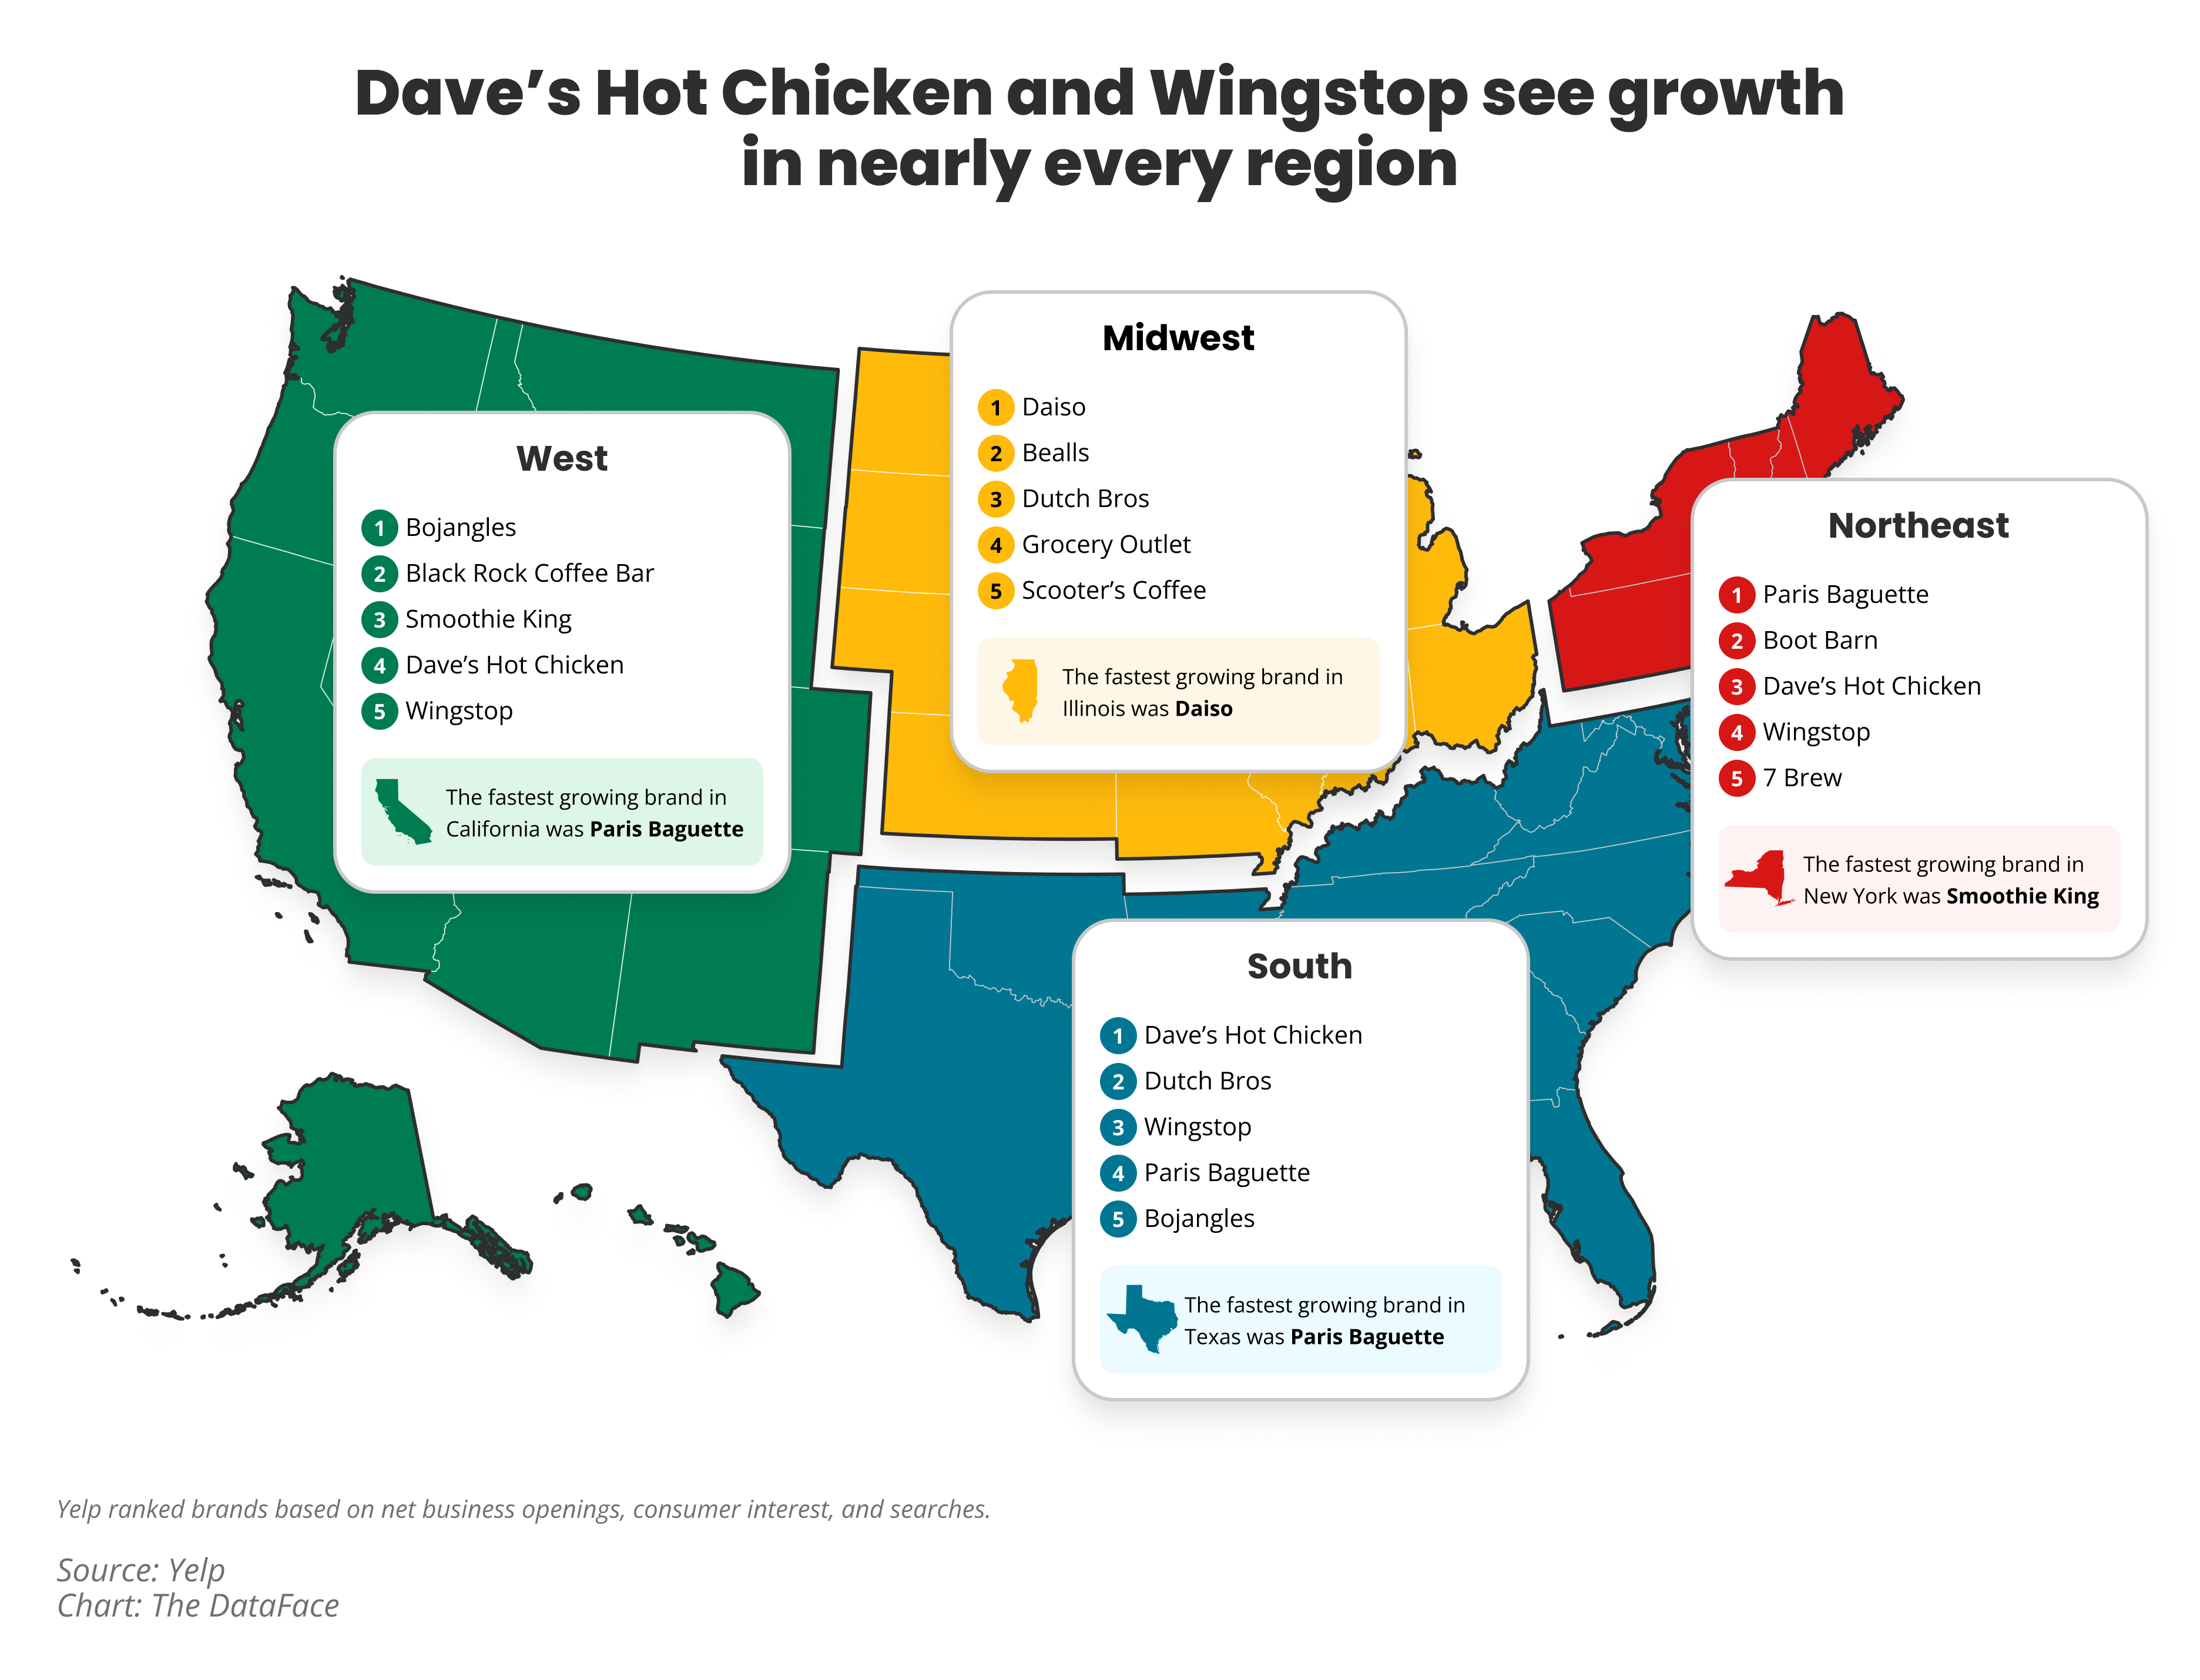
The chicken and coffee themes that define this year's national list are reflected at the regional and state level as well. Wingstop (no. 10) and Dave's Hot Chicken appear in the top three in nearly every region and the majority of states—proof that bold-flavored, craveable chicken concepts have universal appeal, regardless of region.
Meanwhile, the drive-thru beverage ritual among growing national brands is playing out regionally: Scooter's Coffee dominates the Great Plains (top 5 in NE, SD, OK, WY, MT), 7 Brew is surging through the South and heartland (LA, TN, AL, NM, NE), Dutch Bros is pushing into new Sun Belt territory (FL, KY, MO), and Black Rock Coffee Bar is leading the Mountain West (ID, CO, AZ). Rather than one chain winning the national coffee war, consumers are rallying behind brands with distinct regional identities, a fragmentation that mirrors the personalization theme driving this year's list.
If there's a single takeaway from this year's list, it's that we've hit peak personalization, the data suggested. The expectation that a brand will meet you exactly where you are, with exactly what you want, has moved from differentiator to default. As this expectation becomes table stakes, the brands that thrive will be those that continue to find new ways to hand consumers the reins.
Summer Hiring Outlook
Restaurants are expected to add 450,000 seasonal jobs this summer, according to the National Restaurant Association’s 28th annual Eating and Drinking Place Summer Employment Forecast. That would be down slightly from last summer’s increase of 469,000 seasonal jobs, and represent the third consecutive year in which summer hiring was below 500,000.
The uncertain business environment is contributing to the softer seasonal hiring, as restaurant operators continue to face uneven customer traffic. In addition, the industry’s prime labor pool – teenagers and young adults – is not as deep as it was last summer, which may lead to challenges filling some open positions.
At the same time, restaurant operators in some parts of the country will benefit from an expected uptick in international visitors – many of whom will be in the U.S. for the FIFA World Cup. However, even though some restaurants located in host cities will boost staffing to prepare for an increase in customer traffic during the five to six weeks of the tournament, it will likely not be evident in the summer employment numbers, which represent the average staffing levels between June and August.
Seasonal hiring varies significantly by state and is influenced by weather changes as well as the reliance on summer travel and tourism. For these reasons, states in the northeast typically see the strongest growth in seasonal restaurant jobs, as they are home to many restaurants that are only open during the summer season.
The states projected to register the largest proportional employment increase during the 2026 summer season are Maine (32 percent), Alaska (22 percent), Rhode Island (15 percent), Delaware (15 percent), Massachusetts (12 percent), New Hampshire (12 percent) and New Jersey (12 percent).
The states projected to add the most eating and drinking place jobs during the 2026 summer season are New York (42,100), California (33,500), New Jersey (31,400), Massachusetts (29,600), Illinois (23,300), Texas (22,400), Michigan (20,700) and North Carolina (19,500).
Due to the fact that their busiest seasons for travel and tourism are not in the summer months, Florida (-21,500), Arizona (-5,300) and Louisiana (-500) are projected to register declines in eating and drinking place employment during the 2026 summer season.
View the summer employment forecast for every state.
Prime labor pool is shallower in 2026
As the 2026 summer season approached, there was a decline in the restaurant industry’s prime labor pool. Roughly six million 16-19-year-olds were in the labor force in April, according to the Bureau of Labor Statistics (BLS). While that was 700,000 higher than the comparable pre-pandemic level in April 2019, it was 200,000 fewer teenagers than were in the labor force in both April 2024 and April 2025.
The number of teens in the workforce is still expected to rise well above seven million during the peak summer months when more students are available, but the lower early-season numbers likely impacted some restaurant operators who were looking to get a jump on their seasonal hiring.
The availability of teens in the labor force is particularly important for restaurants, as this cohort makes up 20 percent of the industry workforce. Overall, restaurants are the economy’s largest employer of teenagers, providing job opportunities for more than 1.8 million 16-19-year-olds – or 33 percent of all working teens.
Young adults are also an important component of the restaurant workforce, with 20-24-year-olds accounting for 22 percent of all employees. Like the teenage cohort, restaurant operators who started ramping up their summer hiring in April had fewer of them to choose from than they did in 2025.
There were 15.4 million 20-24-year-olds in the labor force in April 2026 – down from 15.5 million in April 2025. That was largely the result of a lower labor force participation rate, which declined from 71.0 percent in April 2025 to 69.6 percent in April 2026.
Restaurant operators looking for a more seasoned team this summer will likely have better luck, as the number of older adults in the labor pool continues to rise. There were 12.0 million adults aged 65 or older in the labor force in April 2026, according to BLS. That was up from 11.7 million in April 2025 and represented the highest April reading on record.
Although this age group makes up just 3 percent of the overall restaurant workforce, it will likely become more important in the coming years as their representation in the labor pool continues to rise. By 2034, BLS predicts there will be 14.5 million adults aged 65 or older in the labor force – an increase of more than 2.5 million above current levels.
Tipping Trends
Toast’s Restaurant Tipping Trends Index looks at how Americans tipped in Q1 2026.
The Baseline: The overall averageU.S. tip held steady at 18.8 percent in Q1.
FSR vs. QSR Gap: Full-service tips ticked up slightly to 19.3 percent, while quick-service tips remained perfectly flat at 15.8 percent for the sixth consecutive quarter.
The State Divide: High-tipping states are led by Delaware (22.1 percent), while California diners leave the lowest average gratuity at 17.3 percent.
The Takeout Drop: Gratuities for takeout orders averaged 13.7 percent.
The average tip at a full-service restaurant in the U.S. is 19.3 percent (Q1 2026). Full-service tips dipped to a seven-year low of 19.1 percent in Q2 2025, then recovered to 19.2 percent through the second half of 2025, before ticking up to 19.3 percent in Q1 2026. Full-service guests consistently tip several points higher than quick-service guests, a gap that Toast data has tracked for years.
The average tip at a quick-service restaurant in the U.S. is 15.8 percent (Q1 2026). Quick-service tips have been flat at 15.8 percent for six consecutive quarters. Toast research suggests guests value personal interaction and are less inclined to tip for automated or counter-service experiences, which helps explain the persistent gap between QSR and FSR tip rates.
The average tip for takeout service at Toast restaurant in the U.S. is 13.7 percent (Q1 2026). Guests tend to tip the least for takeout, or not at all, likely because service is typically lower in this model. Those who do leave a tip for takeout transactions left 13.7 percent in Q1 2026.
There is no single rule around tipping, and unless an automatic gratuity is included in your bill, tipping in the U.S. is optional. But real-world behavior offers a benchmark: U.S. diners tip about 18–20 percent at full-service restaurants and roughly 14-16 percent at quick-service spots. A common guideline is 18–20 percent for sit-down table service with a server, and 15 percent or rounding up for counter or quick-service orders.
Some guests will tip more for exceptional service, and recently, Toast found that restaurant regulars tend to tip more at their favorite spots. According to a Toast survey of 1,500 U.S. adults who dine out or order in at least twice a month, 77 percent of respondents tip more at restaurants where they’re regulars. 46 percent leave an additional 5 percent to 10 percent, and 37 percent leave an extra 10 percent to 15 percent or more on top of their standard gratuity.2There are other factors that affect how people might tip, including automatic gratuity, service fees, local and state wage laws, taxes, and more.
Delaware tips the most (22.1 percent overall); California tips the least (17.3 percent). “Overall Tips” is calculated by taking the total amount of tips divided by Gross Processing Volume. It is not the average of QSR tips and FSR tips for the period.
World Cup Revenue
Toast analyzed gameday transaction data from June 19, 2026, within a five-mile radius of Seattle’s stadium during the USA vs. Australia match. Because the match coincided with Juneteenth, the holiday and the tournament combined to create a massive day for local businesses.
Key insights from the report include:
📈 Massive Revenue Gains: Overall Gross Merchandise Volume (GMV) skyrocketed 51 percent compared to a regular Friday, driven by a 56 percent surge in total transactions.
🌭Grill & Chill: Hot dog orders jumped an astonishing 228 percent, followed by notable spikes in nachos (+87 percent), wings (+64 percent), and chicken tenders (+63 percent).
🍻Tapping the Kegs: Beer was far and away the top seller by volume, with sales surging 212 percent above a typical Friday. Fans also mixed it up with spirits, driving gains for vodka (+139 percent), tequila (+131 percent), and rum (+104 percent).
⚽Pre-Game Rush: Transaction data shows that fans packed restaurants early to fuel up before the noon kickoff, resulting in a 145 percent transaction spike at 10 a.m. A second major surge hit between 2 p.m. and 4 p.m. as the match wrapped up.
📉The Tipping Dip: Despite the massive spending, average tip percentages actually dropped to 16.4 percent (down 0.8 percentage points from a normal Friday). This is likely driven by an influx of international tourists unfamiliar with U.S. tipping culture, a shift toward single-drink orders at bars, or the implementation of automatic gratuities.
Fast Food Location Counts
Analysis by Delancey Street tracked US location counts for some of America's biggest fast food chains, comparing store locator data from approximately one year ago against current figures to reveal which brands are growing, which are retreating, and by exactly how much.
Pizza Hut has lost more US locations than any other chain in this study over the past year, shedding 426 restaurants, a 6.4 percent contraction. Parent company Yum! Brands confirmed plans to close 250 underperforming US locations in the first half of 2026, with the data suggesting closures were already well underway before that announcement.
Wendy's is down 310 locations, a 5.2 percent decline. The company confirmed it would close up to 350 locations in the first half of 2026 as part of its "Project Fresh" turnaround plan, after US same-restaurant sales fell 5.6 percent for the full year and 11.3 percent in Q4 2025 alone.
Denny's, KFC and Subway round out the biggest losers by percentage, with the sit-down diner sector and legacy sandwich chains both showing sustained pressure.
Subway, despite remaining America's largest chain by location count, has shed 402 sites over the period, continuing a retreat from its 2015 peak of over 27,000 US restaurants.
Starbucks, Papa John's and Burger King are each down less than 1 percent in percentage terms, but the direction of travel is the same.
The contrast with the chains that are growing is stark. Chipotle added 359 US locations over the same period, a 9.7 percent increase, making it the fastest-growing chain in the dataset by both volume and percentage. Chick-fil-A grew by 177 locations, McDonald's by 190, and Dunkin' crossed the 10,000 US location milestone during the period.
A parallel study of the UK fast food market over the same period found Pizza Hut's contraction is even more severe in Britain, where the chain lost 55.9 percent of its restaurant estate compared to 6.4 percent in the US. Subway and KFC are also shrinking on both sides of the Atlantic, while McDonald's is growing in both markets.
Heatwave Impact on Hospitality
With temperatures reaching as high as 36 degrees this week in the UK, Tenzo, texamined more than 20,000 venue-day trading observations across London and the South East across five separate heatwave periods between June 2025 and May 2026, uncovering a much more nuanced picture than the common assumption that hot weather is always good for hospitality.
Key findings include:
-
Only one of the five heatwave periods analysed produced a clear and broadly positive uplift for hospitality businesses, with July and August 2025 heatwaves actually resulting in median week-on-week sales declines of -4.0 percent and -3.3 percent respectively.
-
Outdoor, riverside and park-adjacent venues consistently outperformed indoor venues, delivering a median week-on-week sales increase of +2.8 percent, compared to a median decline of -0.6 percent for indoor venues.
-
Heatwaves shift where consumers spend rather than guaranteeing overall sector growth, concentrating demand in outdoor and casual formats while many indoor venues struggle to benefit.
The findings suggest that while heatwaves create opportunities for some operators, particularly those with outdoor space, they do not automatically translate into higher revenues across the hospitality sector.
Cottage Cheese Comeback
New research from Chef's Pencil shows that cottage cheese is undergoing one of the most remarkable comebacks in the American food industry, fueled by the country's growing obsession with protein-rich foods.
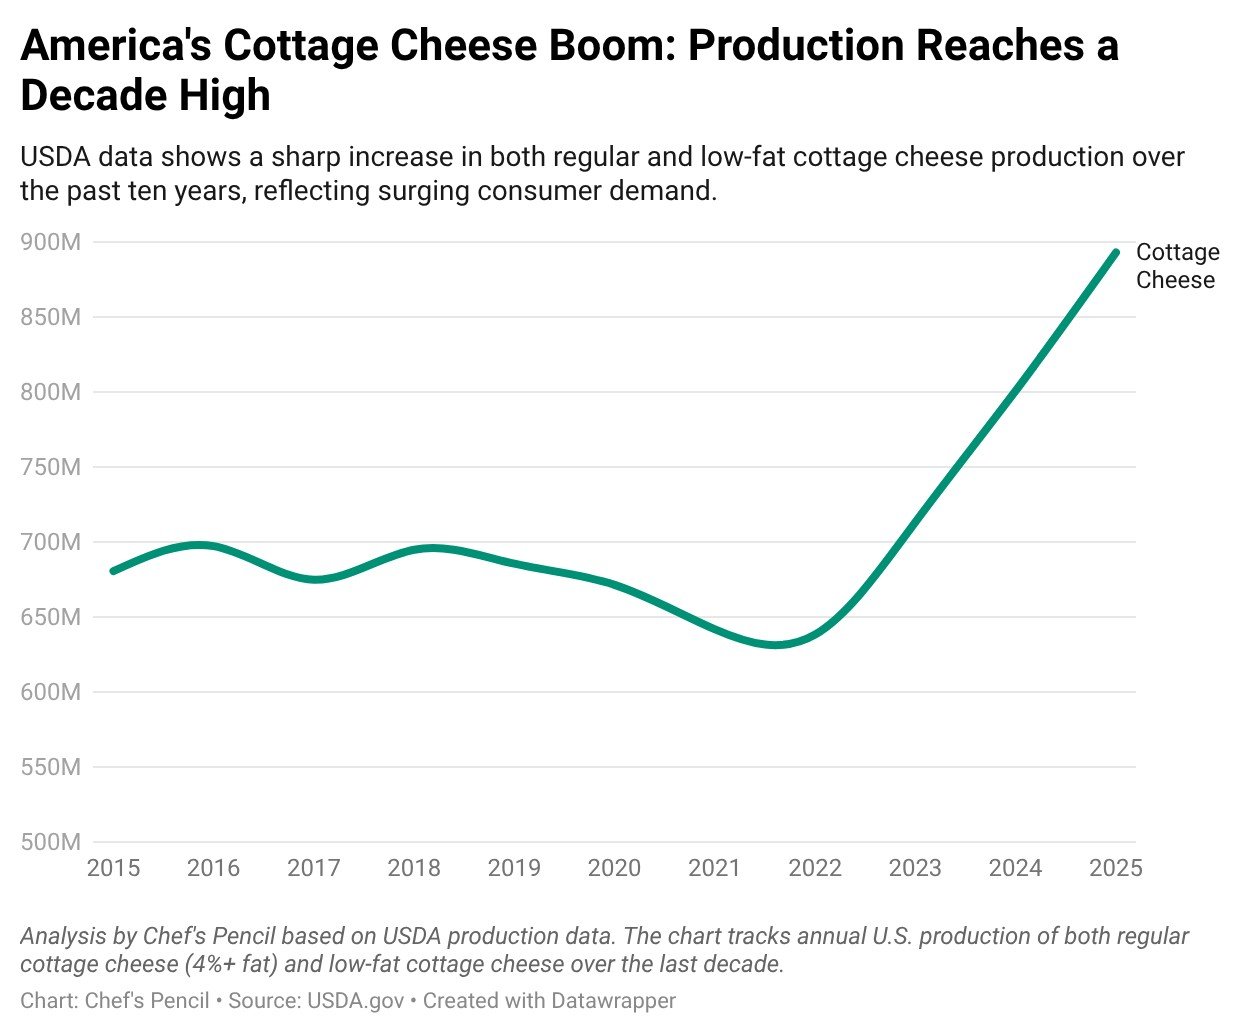
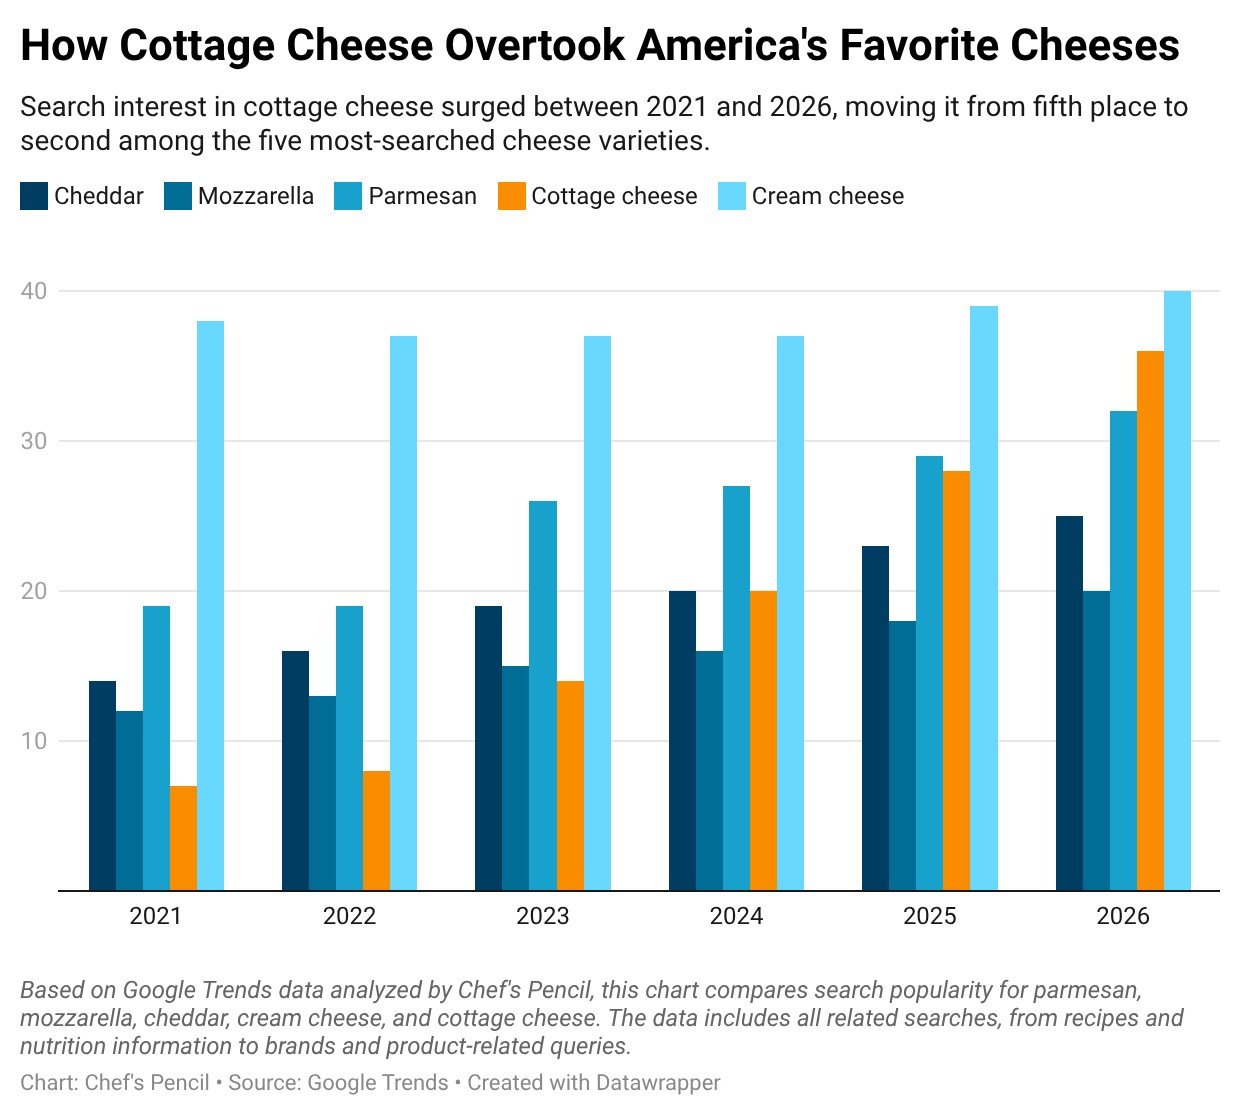
After ranking last among five popular cheeses just a few years ago, cottage cheese has now overtaken cheddar, mozzarella, and parmesan in online popularity, according to our analysis of Google Trends data. The surge in consumer interest is also showing up in the supply chain: USDA data shows cottage cheese production grew roughly five times faster than overall U.S. cheese production between 2023 and 2025, making it one of the fastest-growing major cheese categories in the country.
Some key findings:
-
Cottage cheese reached its highest search popularity on record in 2026.
-
Searches for cottage cheese now exceed those for cheddar, mozzarella, and parmesan.
-
USDA data shows cottage cheese production grew by roughly 25–26 percent between 2023 and 2025, compared to about 5 percent growth for the cheese industry overall. It was the second-fastest-growing major cheese category in America, behind only Gouda.
-
Dairy producers are investing heavily in new cottage cheese production capacity, with some facilities shifting away from other cheese varieties to meet demand.
-
Consumers are increasingly using cottage cheese in high-protein recipes, from lasagna and bread to ice cream, cheesecake, pancakes, and mac and cheese.
Courtesy of Chef's Pencil
The trend appears to be part of a broader shift toward protein-focused eating, driven by fitness culture, health-conscious consumers, and the growing popularity of GLP-1 weight-loss medications.