
MRM Research Roundup: Third Places, Service Fees, and ‘Little Treat’ Culture
23 Min Read By MRM Staff
This edition of Modern Restaurant Management (MRM) magazine's Research Roundup features news of diner expectations, growth of service fees, late-night eating, and "Little Treat" Culture.
The Need for Third Places
SevenRooms released its first annual trends report, “2024 Restaurant Trends and Diner Expectations,” highlighting how restaurants are filling the need for ‘third places’, connection spots outside the home and workplace, what consumers expect from their dining experiences, and how restaurants are leveraging AI and automation to keep diners coming back.
The study, commissioned through independent third-party research firm Censuswide, examines consumer and foodservice operator insights, alongside data from SevenRooms restaurant customers. It emphasizes the importance of restaurants understanding their guests and providing experiences and value to consumers, including marketing and tech trends that operators are paying attention to.
Diners Expect More From Restaurants
While it’s no surprise that diner expectations have evolved in recent years, consumers across generations and cities share key expectations when dining out — they’re looking for convenience, personalization and value from brands they trust. Restaurants must nail all aspects of the guest experience, from hospitality and service to ambiance and atmosphere, to transform diners into brand ambassadors and get them to bring their dollars back more often.
When looking across generations, Millennials are driving a dining resurgence – dining out most frequently with 38 percent saying they dine out more than 5x a month. They are seeking more from their restaurant visits, and are willing to spend more for elevated experiences, like theatrical elements or high-end items like caviar. For these experiences, Americans are willing to spend up to $63 per person with 45 percent of Gen Zers open to paying even more. As diners focus on the quality over quantity of their experiences, that means restaurants must do more to keep those diner dollars. Dining upgrades consumers are willing to spend more fall into three categories – experiential, luxurious and personal, including:
● Experiential (e.g. tableside martini cart; fish presentation or deboning, etc.)
○ Dallas – a menu item with some theater (86 percent)
○ Washington DC – a menu item with some theater (71 percent)
● Personal (e.g. birthday dessert; welcome drink)
○ Chicago – a mocktail or personalized item (55 percent)
● Luxurious (e.g. caviar, freshly shaved truffles, seafood tower)
○ Los Angeles – high-end items like caviar (55 percent)
○ New York – high-end items like caviar (48 percent)
Outside of these experiential offerings, restaurants must also capitalize on influential factors that bring diners back. For example, 34 percent of Gen Zers want personalized surprises in service like a free dessert. Meanwhile, 26 percent of Millennials care about the ease of making a reservation and 24 percent of Gen Xers consider the rapport they develop with front-of-house staff. Tailoring guest experience and service helps operators turn one-time diners into loyal customers.
Loyalty is Never One-Size-Fits-All
In the U.S., there was a 21 percent year-over-year increase in reservations comparing Q1 2023 to Q1 2024 and restaurants are looking to a promising future. Whether operators are focused on opening new locations or revamping their social media marketing efforts, one factor remains the same – establishing personal relationships with diners is the strongest way to build and maintain loyal customers.
Consumers have a strong intent to dine with their favorite brands. If a guest can’t get a reservation at their preferred restaurant, 39 percent of guests look for a sister restaurant to dine at, and 27 percent check other sites for the same restaurant.
Cultivating loyalty is critical. Loyalty is not a one-size-fits-all effort and diners have different interests when it comes to the benefits they seek out from loyalty programs. Restaurants need to understand their diner demographics to curate operations and offerings, getting their guests to not only return more often but spend more in the process.
Thirty-eight percent of diners who would spend $89-$126 on an average night are looking for exclusive VIP events, while 33 percent of consumers who dine out 7-8 times per month want VIP access to specialty seating areas. Breaking down generational differences:
● 72 percent of Gen Zers care most about free menu items
● 30 percent of Millennials care most about VIP access to specialty dining areas
● 1 in 5 Gen Xers and Baby Boomers want early access to reservations
Genuine, Tailored Marketing is Critical to Success
When it comes to marketing, authenticity and personalization reign supreme for consumers. Guests want to be known by their favorite restaurants, and restaurants want to know and understand their guests. To reach these consumers, and serve up personalized marketing that makes guests want to return, restaurants have to use all the tools in their arsenal – from social media to email and text marketing automation – to create high-touch communications that are both authentic and personal.
Seventy-nine percent of restaurant operators spend the majority of their marketing budget on social media. Their top social media goals are to drive bookings or online orders (39 percent), increase brand awareness (29 percent) and communicate with their audiences (29 percent). But not all content is created equal – 39 percent of operators say that organic posts drive the most bookings to their restaurants. Restaurants that showcase their personality – highlighting their team, food and drinks and atmosphere – will win with consumers as they look for more genuine content from brands.
Most diners like hearing about restaurant promotions and offers via email and text, and aren’t as interested in social media DMs or phone calls, but specific preferences vary by generation. 41 percent of Gen Zers prefer text marketing, whereas 38 percent of Millennials and 37 percent of Gen X prefer email marketing.
With targeted Email Marketing, the data report notes that operators see 23 percent higher open rates and 28 percent higher click-to-open rates, generating 2x more revenue per email. Text marketing is fairly new for restaurants, but has huge potential, with an average open rate of 98 percent and $1.64 average reservation revenue generated per text message on SevenRooms. For one SevenRooms customer, Fabio Viviani Hospitality, it drove $220,000 in revenue and 3,000 new guests in just 4 months.
Artificial Intelligence (AI) Comes into Play
Every industry today is using AI and automation in some way to streamline their operations and help staff work more efficiently – and the same is true for the restaurant industry. 70 percent of operators surveyed said they use artificial intelligence in some way to run their business, including:
● 35 percent – Processing reservations
● 34 percent – Inventory management
● 33 percent – Data analytics
● 27 percent – Scheduling
● 26 percent – Dynamic pricing
But there is room to grow with AI, with only 16 percent saying they use it to create marketing collateral and 15 percent for staff hiring and training. With personalized marketing a large focus for operators in 2024 and beyond, as well as hiring and retaining staff to deliver on high-touch hospitality, operators have an opportunity to use AI more effectively.
Capitalize on Local Visibility
SOCi, Inc. released the SOCi Local Visibility Index (LVI) 2024, spotlighting the top 100 brands that are capitalizing on the $54.1 billion opportunity in localized digital marketing.
Despite this success, this digital invisibility is costing businesses dearly. According to the U.S. Commerce Department, 84percent of commerce still happens offline at brick and mortar locations, making local search and discovery vital to capturing consumer dollars. However, most multi-location brands remain largely invisible in local searches, with the average brand failing to appear in 3 out of 4 local searches, ignoring over 50percent of reviews, and leaving 90percent of customer questions and engagements unanswered across popular search and social channels.
For the SOCi LVI 2024, nearly 3,000 enterprise companies with 50+ locations were analyzed across the U.S., representing 2.8 million office and store locations. This extensive analysis encompassed over 100 metrics to evaluate each brand’s performance in local search, reputation, and social channels.
SOCi’s Local Visibility Takeaways for 2024
Search: While multi-location brands are doing a good job of claiming and completing their local profiles on Google, there is room for better optimization and improvement on Yelp and Facebook.
Reputation: Less than half of reviews get a response from businesses on Google, and response rates on Yelp and Facebook are even lower.
Social: Multi-location brands are successfully building audiences on Facebook by posting a healthy mix of photo and video content, but audience engagement on average is still low.
A notable takeaway from this year’s index is that high recognizability does not equal high visibility. Household brands like Chick-fil-A, Target, and Walgreens did not make SOCi’s 100 Most Visible list, while niche and regional brands are more visible online by showing up in non-branded searches related to their most important keywords. This highlights the vital role of localized digital marketing, urging national brands to prioritize building stronger connections with local customers.
Square's Restaurant Trends
Square released the latest edition of its Quarterly Restaurant Report, which uses data across Square’s food and beverage sellers to examine dining trends, along with shifts in consumer spending and restaurant wages.
How common are restaurant service fees?
Service fees, a percentage-based or fixed amount added to a transaction total that is different from a surcharge, are seen by sellers as a way to help offset certain operational or overhead costs across various areas of the business. While they are still relatively uncommon, Square found that they are growing as more restaurants implement the add-on charge. In Q2 2024, about 3.7 percent of restaurant transactions included a service fee, more than doubling since the beginning of 2022.
Wage growth continues to be higher than inflation
According to the Square Payroll Index, when analyzing restaurant worker hourly pay (including base wages, tips, and overtime), yearly growth continued to be higher than the rate of inflation. Even though restaurant workers' pay growth has slowed since COVID highs, average hourly earnings were up 4.10 percent compared to the inflation rate of 2.98 percent as of July 2024.
Boston, Richmond, and Philadelphia nightlife exceeds pre-pandemic levels
Cities across the country are continuing to experience strong nightlife. Square analyzed the share of in-person restaurant and bar transactions between 7 pm and 4 am, and found that while New York and Miami continue to nab the top spots, Boston has seen the most explosive growth. In Q2 2019, just 12 percent of restaurant and bar transactions in the city happened late night, increasing to 31 percent in 2024.
A similar trend can be observed in Richmond where 35 percent of transactions occurred between 7 pm and 4 am in 2024, compared to just 23 percent pre-COVID. Philadelphia’s nightlife has also rebounded and is now at 31 percent versus 23 percent in Q2 2019.
Areas of Washington D.C. see positive growth following the pandemic
Following COVID-19, Washington D.C. has experienced many changes due to factors like remote and hybrid work, revitalization efforts, and others. As a result, neighborhoods and suburbs outside of downtown areas have seen increased restaurant traffic.
In Washington, D.C., data shows significant gains in restaurant activity in neighborhoods which have seen increased housing development, such as Navy Yard and NoMa, as well as parts of Glover Park and Tenleytown. Areas adjacent to the National Mall and tourism sites have remained stable, helping support downtown businesses, while significant declines in activity were observed east of The Potomac River.
The Value of Value Meals
In recent weeks, we’ve seen a number of restaurant chains introduce value-driven specials and LTOs in response to lackluster sales spurred on by the July U.S. jobs report on August 2 and subsequent stock market reactions. With fears of a recession looming, consumers are watching every penny they spend, and independent restaurants across the U.S. are taking note, adding an increasing number of value-based offerings to their menus. SpotOn observed this increase and found:
- 3,250 COMBO menu items added, peaking between July 28 – August 10.
- 210 BOGO menu items added with a 90 percent increase from the week of August 4 – 10 to the week of August 11 – 17
- 180 DEAL menu items added with an 80 percent increase from the week of August 4 – 10 to the week of August 11 – 17
- 115 BOTTOMLESS menu items added with a 30 percent increase from the week of August 4 – 10 to the week of August 11 – 17
- 32 ALL YOU CAN EAT menu items added with a similar 30 percent increase from the week of August 4 – 10 to the week of August 11 – 17.
- 26 UNLIMITED menu items added, peaking the week of August 4 – 10
In today's economy, operators must ensure that their menu and experience provide perceived value, making it an attractive option for consumers looking to make their dollars stretch further. For restaurants, offering value meals can help drive higher foot traffic, especially during slower dining periods like the summer slump.
Changing Consumer Preferences
As per the Latest Report by Straits Research, the global Fast Casual Restaurants Market Size was valued at USD 168.1 Billion in 2023. It is projected to reach USD 301.6 Billion by 2032, growing at a CAGR of 6.6 percent during the forecast period (2024–2032).
Fast-casual restaurants emerged in the late 90s but gained significant popularity in 2009. They differentiate themselves from fast-food establishments by preparing fresh food rather than relying on assembly-line methods. Fast casual Restaurants prioritize high-quality ingredients, sourcing locally and offering fresh and organic options. While their prices are higher than fast-food chains, they remain more affordable than fine dining establishments. Fast-casual restaurants have captured consumer attention by focusing on fresh ingredients, healthier menu choices, and customizable options to meet evolving preferences. The primary objective is to incorporate high-quality ingredients such as locally sourced produce and sustainable proteins to craft flavourful and nutritious meals. This shift towards fast-casual dining reflects consumers' desire for convenient yet health-conscious options beyond traditional fast food.
Changing Consumer Preference Increasing Preference Towards Fast-Casual Restaurants
The rise of fast-casual restaurants can be attributed to the changing consumer preferences towards a healthier lifestyle. Fast-casual restaurants have become increasingly popular, emphasizing healthy, natural, and freshly prepared food. Innovative offerings also contribute to the success of fast-casual restaurants. For example, leading chains like Panera Bread provide diverse menus with low-fat and gluten-free options. They also offer customization choices, such as half portions or thinner bread, catering to weight-conscious individuals. This flexibility and customization provided by fast-casual restaurants have been key drivers of market growth. In addition, the shift towards healthier eating habits is another significant factor influencing consumer preferences. People are becoming more conscientious of their meals' nutritional worth and quality. Fast-casual restaurants address this demand by sourcing local produce and providing customizable menu options, allowing customers to align their meals with their specific dietary needs and preferences.
Early Adoption of Advanced Technologies Creates Tremendous Opportunities
The food service industry is undergoing rapid transformation, with a strong focus on adopting advanced technologies for improved operations. Integrating scheduling software, digital inventory tracking, automated purchasing tools, and digital reservation table management has revolutionized revenue generation, inventory management, customer satisfaction, and overall operational efficiency. Implementing such software presents a promising opportunity for fast-casual restaurant owners to effectively manage queues, inventory, purchases, and other crucial operations. In addition, fast-casual restaurants are embracing online ordering systems, mobile apps, and self-service kiosks to enhance the convenience and efficiency of ordering. These technologies enable customers to place orders in advance, customize their meals, and track them in real-time. This streamlined approach enhances customer satisfaction and improves operational efficiency for restaurant owners.
Regional Analysis
North America is the most significant global fast-casual restaurant market shareholder and is estimated to rise at a CAGR of 8.9 percent over the anticipated period. Mexico, Canada, and the United States all study North America's quick casual restaurant sector. The U.S. economy, which has more flexibility than Western European companies regarding macroeconomic considerations, is the largest in the world in terms of GDP. On the other hand, Canada's industrial economy is based on high technology. The nation's economy grew less slowly in 2008, although it recovered more quickly. North American consumers' taste for healthy foods has changed quickly in recent years. Natural, clean-label, and organically cultivated foods are becoming more popular among customers in the area. Additionally, problems like obesity and diabetes are becoming increasingly common. As a result, customers choose their meals carefully, which leads to a preference for fast-casual eateries.
Europe is anticipated to grow at a CAGR of 10.5 percent over the forecast period. In 2016, the European Union's exports and imports ranked second worldwide. Following the 2008 recession, the general growth rate of Europe's economy has decreased. Despite Brexit, the European market offers enticing food and beverage industry potential. The popularity of fast-casual restaurants with healthy menu options has grown due to Europe's important level of life. Fast casual restaurants make it more convenient for working professionals, giving them more time for other pursuits. In addition, the rise of food establishments further encourages the expansion of fast-casual restaurants in this area. Consumers in Europe have a strong preference for products and ingredients that are made locally. Three out of five Europeans prefer to purchase things made locally. Quick casual restaurants have begun to provide freshly produced, natural, and locally sourced goods to satisfy this desire. A further factor driving demand for quick casual eateries in the area is the desperate way of life there.
Key Highlights
- The global Fast Casual Restaurants Market Size was valued at USD 168.1 Billion in 2023. It is projected to reach USD 301.6 Billion by 2032, growing at a CAGR of 6.6 percent during the forecast period (2024–2032).
- Based on food type, the global fast-casual restaurant market is bifurcated into pizza/pasta, burgers/sandwiches, Asian/Latin American food, chicken, and others. The pizza/pasta segment dominates the global market and is projected to reveal a CAGR of 13.1 percent over the forecast period.
- Based on the mode of operation, the global fast-casual restaurant market is bifurcated into takeaway and dine In. The takeaway segment owns the global market and is predicted to exhibit a CAGR of 11.2 percent over the forecast period.
- Based on its nature, the global fast-casual restaurant market is bifurcated into standalone and franchised. The standalone segment owns the highest market share and is predicted to exhibit a CAGR of 12.2 percent over the forecast period.
- North America is the most significant global fast-casual restaurant market shareholder and is estimated to rise at a CAGR of 8.9 percent over the forecast period.
Competitive Players
- Chipotle Mexican Grill
- Panera Bread
- Shake Shack
- Five Guys
- Noodles & Company
- Panda Express
- Wingstop
- Zaxby's
- Qdoba Mexican Eats
- Blaze Pizza
- Jersey Mike's Subs
- MOD Pizza
- Sweetgreen
- CAVA
- Pret A Manger
Rise of the Uncommitted Customer
Upside released its first-ever Consumer Spend Report, offering a detailed exploration of consumer behaviors and sentiments across the nation. By analyzing data from 1.1 billion transactions and extensive nationwide surveys, this report provides critical insights for retailers looking to adapt to the rapidly changing market environment. Among multiple findings, the report highlights the rise of the "uncommitted customer" – an opportunistic consumer group who shops across different locations and formats, prioritizing their own needs over brand loyalty.
The repor is based on extensive research, including the analysis of 1.1 billion transactions from over 8,000 retail partners and two national surveys of 3,700 American consumers. The report also incorporated insights from over 3,400 consumer interviews, adding a human element to the qualitative data. This year’s report found five notable trends:
1, Negative consumer sentiment about the economy: Despite a cooling inflation rate, 56 percent of surveyed consumers perceive the economy as worse than the previous year. This sentiment is reflected in their budgeting behaviors, with 89percent of respondents relying on coupons or promotions to control spending. Younger consumers (18-24) and larger households expressed the most pessimism with their own financial situation.
2. Price sensitivity driving uncommitted customer behavior: Consumers are cross-shopping more than ever, with 81 percent of grocery shoppers comparing prices across stores and a significant portion belonging to multiple loyalty programs. This trend is prevalent across food and fuel categories, highlighting the growing number of uncommitted customers who prioritize value over brand loyalty.
3. Decline in inflation-adjusted sales across categories: The report reveals that while topline sales figures may appear stable for businesses, adjusting for inflation shows a decline in real revenue across categories. Grocery stores have experienced a 3 percent decrease in inflation-adjusted revenue per transaction year-over-year, with restaurants and convenience stores facing similar challenges with even larger impacts.
4. Loyalty programs have wide adoption but limited influence: Loyalty programs remain a critical strategy for retailers, with over 90 percent of consumers considering loyalty rewards when choosing where to shop. However, the report highlights a disconnect between loyalty membership and loyal behavior. Many consumers join multiple programs within the same category, and say they actually use loyalty on half of transactions or less.
5. Skepticism over dynamic pricing: Although more consumers are aware of dynamic pricing, widespread adoption remains limited due to mixed consumer sentiment and potential media scrutiny. Alternatively, personalized promotions are viewed more favorably, with 45 percent of respondents preferring retailers that offer tailored discounts.
Small Business Spend
Fiserv published the Fiserv Small Business Index™ for July 2024, providing insights into the pace and nature of consumer spending at small businesses across the United States at national, state, and industry levels. The data, which analyzes consumer transaction data (card, cash and check) at approximately two million U.S. small businesses, shows consumer spending rebounded nicely in July – following a month of modest declines – to help many small businesses start the second half of the year strong.
Nationally, the seasonally adjusted Fiserv Small Business Index for July increased from 140 to 141. The increase in consumer spending followed a four-point decline in June. On a year-over-year basis, both small business sales (+3.5 percent) and transactions (+3.3 percent) grew compared to July 2023. Month-over-month small business sales grew (+1.3 percent) despite transactions slightly declining (-0.7 percent).
Here are key takeaways about Retail, Restaurant and Food, and other industry spending:
Retail: July saw strong retail spending growth as the national Retail index rose by four points to 146. Year-over-year retail sales (+4.6 percent) and transactions (+5.8 percent) both increased and all retail subsectors showed growth compared to June. General Merchandise (+10.9 percent) led retail in yearly growth, followed by Health and Personal Care (+8.6 percent), Building Equipment and Garden Materials (+6.2 percent), Food and Beverage Retailers (+4.9) and Furniture, Electronics and Appliances (+4.7 percent).
On a monthly basis, retail sales (+2.5 percent) and transactions (+0.1 percent) grew as higher average ticket sizes drove short-term spending, even though foot traffic remained relatively flat. Motor Vehicle and Parts Dealers (+4.8 percent) and Furniture, Electronics and Appliances (+4.8 percent) led growth compared to June, followed by General Merchandise (+3.5 percent) and Health and Personal Care (+3.1 percent).
Restaurants and Food: Food Services and Drinking Places indexed at 123 for July, a 4-point decline from June. On an annual basis, restaurant sales declined (-1.6 percent) despite seeing modest growth in foot traffic (+0.7 percent). Consumers dining out have also seen a significant decrease in average ticket sizes (-2.4 percent) compared to July 2023.
Month-over-month restaurant sales (-3.1 percent) and transactions (-1.4 percent) both decreased compared to June 2024, marking a second consecutive month of slowing restaurant sales and foot traffic. Similar to the yearly trend, average ticket sizes also declined (-1.7 percent) on a monthly basis – indicating that consumers may be feeling some pricing relief when dining out.
Loyalty Trends
PAR Punchh® release of its first annual "PAR Punchh Loyalty Trends Report," which provides a sneak peek into how innovative loyalty programs are reshaping the dining landscape and driving unprecedented customer engagement.
Key findings include:
- Breakfast and Menu Innovations: As more people return to their offices and adapt to new routines, there has been a notable increase in morning sales. Loyalty programs have been pivotal in this trend, offering targeted messaging and incentives. Additionally, casual dining brands have successfully sparked interest in breakfast through menu innovations, healthier items, personalized offers, and optimized ordering channels, aligning with consumer shifts observed with remote work schedules. This aligns with other findings, which emphasize the impact of changing work patterns on dining habits and the increased focus on morning sales.
- Omnichannel and In-Store Ordering Impact: The report highlights the value of both omnichannel and in-store ordering. Guests using multiple ordering channels visit more frequently and purchase at higher volumes, emphasizing the importance of technology in enhancing customer experience. Additionally, the resurgence of in-store ordering, accounting for just under 40 percent of transactions last year, highlights the need for effective on-premise POS systems to cater to a significant customer group.
- Loyalty Sales Growth and Gen Z Engagement: To offset higher prices, customers are increasingly seeking incentives from their favorite restaurants, driving a 12 percent increase in loyalty sales from 2022 to 2023. This growth far outpaces the 5 percent overall increase in consumer spending at restaurants. Successful loyalty programs have also improved their digital strategies, resonating strongly with Gen Z, who accounted for 25 percent of total loyalty sign-ups. This group’s digital engagement preferences highlight the importance of digital and mobile solutions in capturing younger consumers' attention.
In a competitive market, understanding and leveraging these trends can set your brand apart. Strategic loyalty programs are not just about retaining customers—they are about creating an emotional connection that fosters long-term loyalty and profitability.
Eating Patterns in America
Circana™ released a report providing a complete view of food and beverage consumption trends, both at home and away from home. The 39th annual report, “Eating Patterns in America,” highlights a growing trend toward at-home dining over the past year, with 86 percent of eating occasions sourced from home. While retail volumes show modest growth, foodservice traffic remains under pressure. However, significant opportunities remain in both sectors, with American consumers spending nearly $1.7 trillion annually on food and beverages. The report offers strategic insights for manufacturers, retailers, foodservice operators, and distributors aiming to better engage with their target consumers.
The report highlights several key findings, including:
- Home-Centric Dining: In the post-pandemic era, at-home food and beverage consumption remains a cornerstone of daily life. Regardless of where meals were sourced, consumers ate 116 more meals at home over the past year than they did pre-pandemic. As consumers seek the optimal balance between value and convenience, low price is not the sole driver of a compelling value proposition. New mobility patterns, inflationary pressures, and evolving attitudes around well-being offer opportunities to craft retail solutions that help consumers source meals, snacks, and beverages for both in-home and on-the-go occasions. While gains in away-from-home consumption are leveling off, fast casual restaurants are gaining market share. Despite a challenging macroeconomic environment, some foodservice operators have demonstrated resilience and achieved growth. Focusing on efficiency, innovation in menu offerings and delivering value will be key to driving continued growth.
- Daypart Disruption: While breakfast, lunch, and dinner remain the primary meal occasions, their composition, timing, and sources are evolving to fit consumers’ daily routines. Breakfast now starts earlier, with mid-morning snacks away from home rising in popularity. Lunch has shifted significantly due to changes in workplace mobility, with lunchtime traffic falling to about half of pre-pandemic levels. Snack consumption is growing, with consumers increasingly preferring quick bites or meal replacements over larger meals. As snacking becomes more common throughout the day, the boundaries between traditional mealtimes will continue to blur.
- Beverage Innovation: Over the past year, beverage consumption has surged, particularly among coffee, carbonated soft drinks, and functional beverages. This rise in consumption is driven by manufacturers’ innovations aimed at addressing evolving consumer needs. Today’s beverages cater to various functional requirements, including hydration, energy, and nutrition. Coffee remains a daily staple for many, offering both comfort and an energy boost. Carbonated soft drinks continue to be popular for their refreshing qualities, while functional beverages are gaining traction for their added benefits, such as vitamins, electrolytes, and other health-enhancing ingredients. This trend reflects a broader movement toward beverages that serve as both enjoyable and functional components of daily life, adapting to changing lifestyles and preferences.
The Power of Premium Beverages
Consumers visiting US bars and restaurants are demonstrating a significant shift towards a ‘quality over quantity’ mindset. The latest insights revealed by CGA by NIQ’s OPUS takes a deep dive into premium beverage consumption. This premiumization trend is particularly prominent in the cocktails, spirits, and beer categories, and offers industry stakeholders a strategic opportunity to favorably position themselves within both the premium and value segments.
A growing number of consumers are gravitating toward high-quality, premium beverages, especially during formal meals and special occasions. With 70 percent of consumers planning to order premium cocktails or spirits in the next six months, it's evident that quality is becoming a key factor in drink choices. This trend is further highlighted by the fact that around one-third of cocktail drinkers (31 percent) and spirit drinkers (34 percent) are opting for premium options. Even in the beer category, over a quarter of consumers (27 percent) are choosing premium brands, particularly when dining in a formal dining experience.
This increasing preference for premium beverages suggests consumers view their On Premise visits as affordable luxuries where they can indulge in high-quality drinks unburdened by any notable financial strain. Moreover, the data demonstrates 18 percent of consumers have been purchasing more premium drinks compared to a year ago, considerably outpacing the 10 percent who have shifted towards more value-oriented choices.
This trend presents a unique opportunity for drinks brands and suppliers operating in the On Premise sector to meet evolving consumer preferences by offering a balanced portfolio including both premium and value options.
The ability to align with consumer expectations across different occasions, whether it’s a formal meal, a casual outing, or a special celebration, is key to both gaining and retaining market share. Ensuring premium brands are highly visible in-venue and on menus can grab the attention of consumers who are willing to spend more on high-quality drinks. Comparatively, the versatility of cocktails, which are popular across a range of occasions, provides brands and venues with the flexibility to align with different quality levels and price points.
The importance of ranging between premium and value options is further highlighted by the relatively equal distribution of consumption across premium, value, and mixed options. In the past six months, 40 percent of cocktail drinkers, 38 percent of beer drinkers and 35 percent of spirits drinkers have opted for a combination of both premium and value options, demonstrating the need for brands to offer a diverse range of products to match various consumer preferences.
As the demand for premium beverages continues to rise, it is crucial for drinks brands to understand how to leverage this trend in ways aligning with their brand identity and resonating with their target audience. Ultimately, brands can position themselves as essential components of formal dining and special occasions by focusing on quality and appealing to consumers looking for a superior drinking experience.
However, the need for balance cannot be overstated. Offering both premium and value options meets the diverse needs of consumers and ensures brands can appeal to a broader audience, maximizing the scope for success in the On Premise sector as a result.
Whiskey is Tops, Alcohol-Free Beer Flourishes
American and Irish Whiskeys are gaining market share in the most valuable spirits category, On Premise Measurement (OPM) data reveals, with Straight-Bourbon leading the charge due to widespread distribution gains and consistent growth across nearly all markets, despite regional variations.
CGA's OPM service, which tracks the latest trends in US bars and restaurants shows Whiskey’s continued dominance as the largest spirit category by value and volume share in the last 12 months. Within subcategories, American Whiskey has the highest volume share of Whiskey, achieving +1.1pp growth vs YA, with Irish Whiskey also seeing +0.5pp growth. Canadian Whiskey, despite holding 21.4 percent of the market, saw a decline of -1.1pp vs YA.
Straight-Bourbon stood out as the top performer, with highest share amongst American Whiskey sub-categories, helped by +1.2pp distribution gains vs YA. Tennessee Whiskey also saw growth within the sub-categories, with the second-highest volume share and +0.2pp distribution growth. On the other hand, Blended Whisky saw a -1.0pp drop in performance, whilst Rye remained steady.
Regional analysis from CGA’s OPM indicates Straight-Bourbon gaining share in almost all key US states, with Pennsylvania and Louisiana among those recording the sharpest rises in share of the market.
Sales of alcohol-free beer are flourishing in the US On Premise, the latest data from CGA by NIQ’s OPM (On Premise Measurement) solution reveals.
CGA’s OPM service, which tracks the latest trends in US bars and restaurants to help suppliers and brand owners maximize trading, shows total beer sales by value in the 12 months to mid-May were 2.9 percent down year-on-year. In sharp contrast, the non-alcohol beer segment achieved growth of 33.7 percent. While beer’s rate of sale dropped 9.4 percent, rate of sale (RoS) in the non-alcohol segment rose 13.6 percent.
Alcohol-free beer has also generated a sharp increase in visibility and price, the Tracker indicates. Its total distribution points in the US jumped by 11.9 percent—nearly triple the 4.1 percent rate of growth across the beer category as a whole. Average selling prices in the no-alcohol segment rose by 5.2 percent—well ahead of the all-beer increase of 3.0 percent.
CGA’s research also reveals the styles of alcohol-free beer that are driving the growth. Pale lager remains the most popular type with a 55 percent share of the market, and its sales by value have risen by 8.0 percent year-on-year, but as segment matures non-alcoholic IPA’s, stouts and blonde ales are gaining share. The most eye-catching growth has come from Indian Pale Ale and blonde or golden ale, where sales have rocketed by 170.9 percent and 165.5 percent respectively. Stout has grown 133.9 percent, though from a smaller base.
Regional analysis from CGA’s OPM indicates year-on-year growth for non-alcohol beer in all key US states, with Colorado and Washington among those recording the sharpest rises in share of the total beer market. The sub-category is projected to hold ~1 percent total beer On Premise $ value share in western US by 2026.
Late Night-Eating
When you leave the cinema or theatre, or after enjoying a long day out, there’s nothing quite like sitting down to a late meal with friends or family, especially on weekends when there’s no rush to wake up early for work.
But how easy is it to find a restaurant that stays open late?
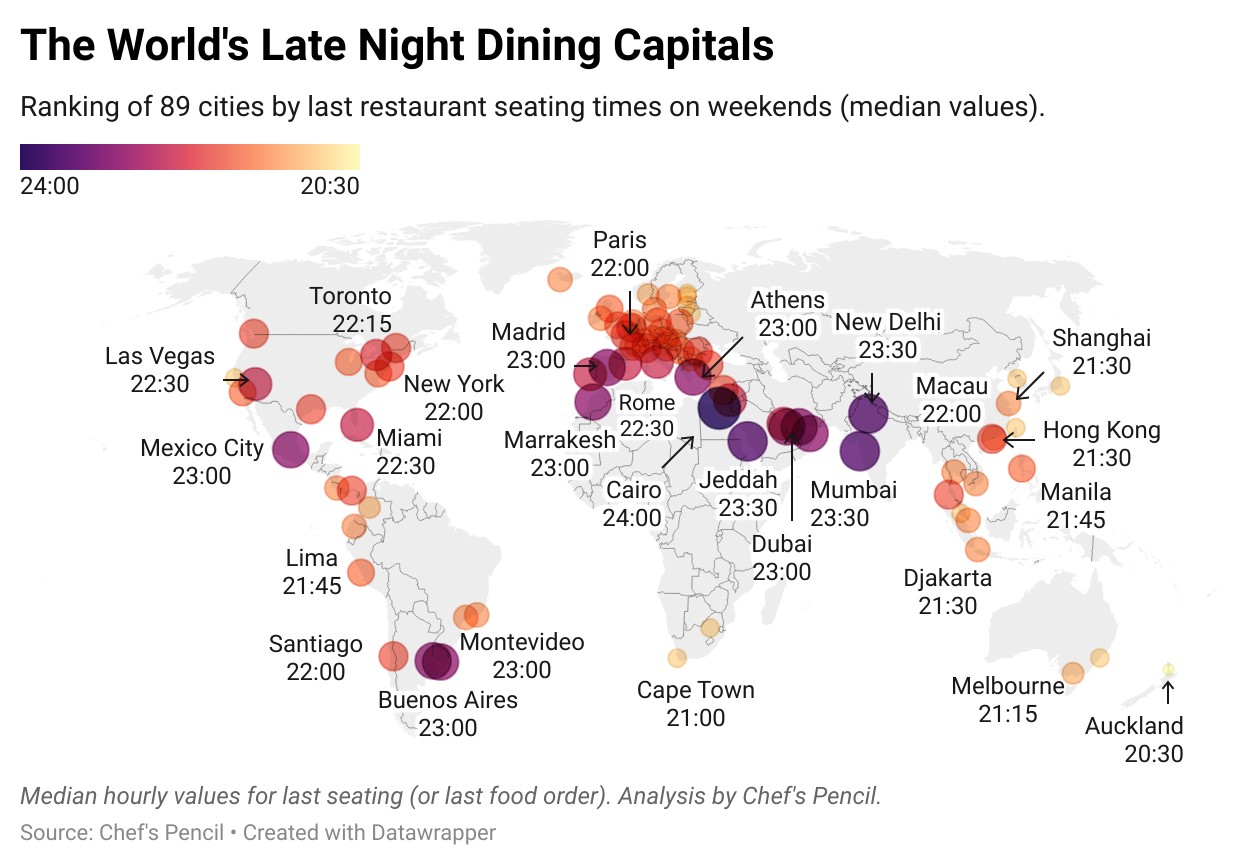
To answer this, Chef's Pencil delved into reservation apps to identify the cities where booking a very late dinner is easiest. By analyzing the dinner reservation calendars of over 4,400 restaurants in 89 cities worldwide, we noted the last seating times for each restaurant at weekends and ranked these cities based on the median value of the last seating or last food order time.
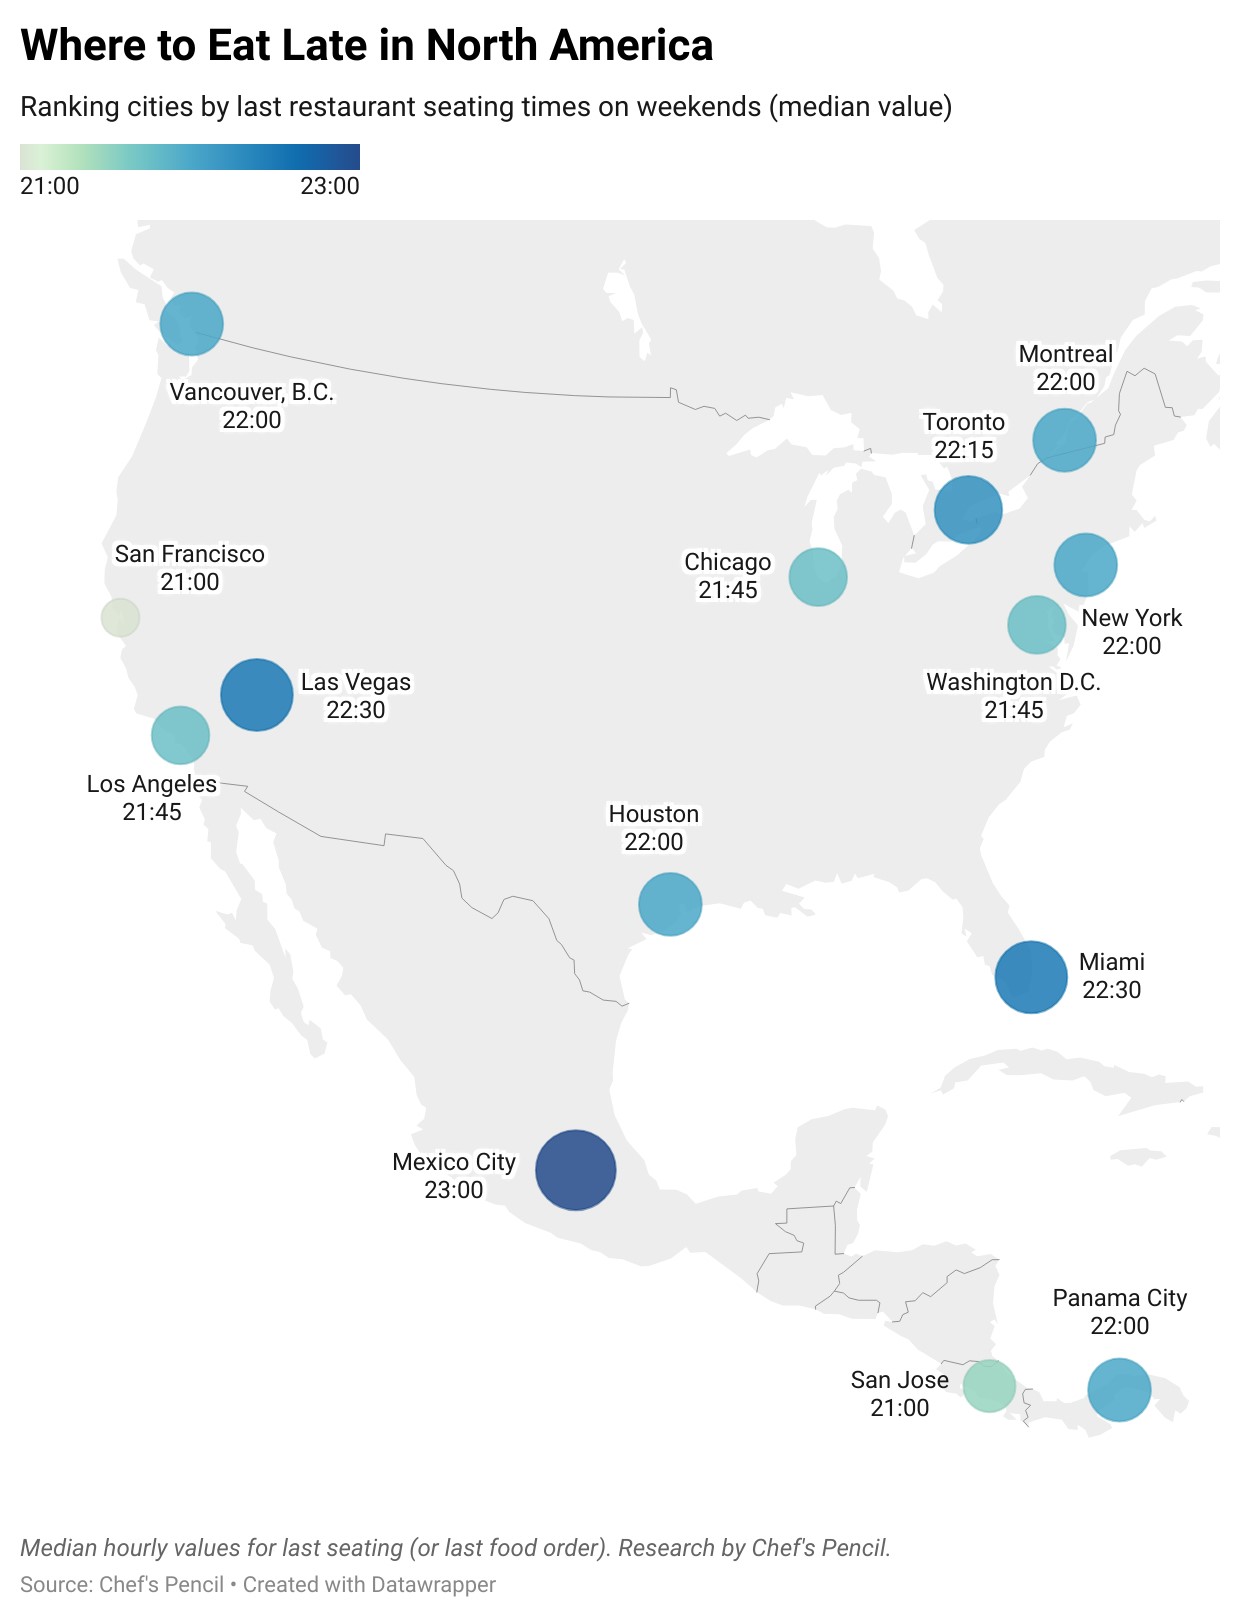
Miami and Las Vegas are the highest-ranked U.S. cities, with a median last seating time of 22:30. They are followed by New York and Houston, both with a last seating time of 22:00, while San Francisco ranks among the cities with the earliest last seating times in the world.
Here are the top 20 cities below and a link to the full report that includes data for all 89 cities:
|
City |
Last Seating Time/Last Food Order (Median Value) |
|
Cairo, Egypt |
24:00 |
|
Mumbai, India |
23:30 |
|
Jeddah, Saudi Arabia |
23:30 |
|
New Delhi, India |
23:30 |
|
Madrid, Spain |
23:00 |
|
Buenos Aires, Argentina |
23:00 |
|
Dubai, U.A.E. |
23:00 |
|
Athens, Greece |
23:00 |
|
Marrakesh, Morocco |
23:00 |
|
Mexico City, Mexico |
23:00 |
|
Muscat, Oman |
23:00 |
|
Doha, Qatar |
23:00 |
|
Montevideo, Uruguay |
23:00 |
|
Miami, USA |
22:30 |
|
Rome, Italy |
22:30 |
|
Tel Aviv, Israel |
22:30 |
|
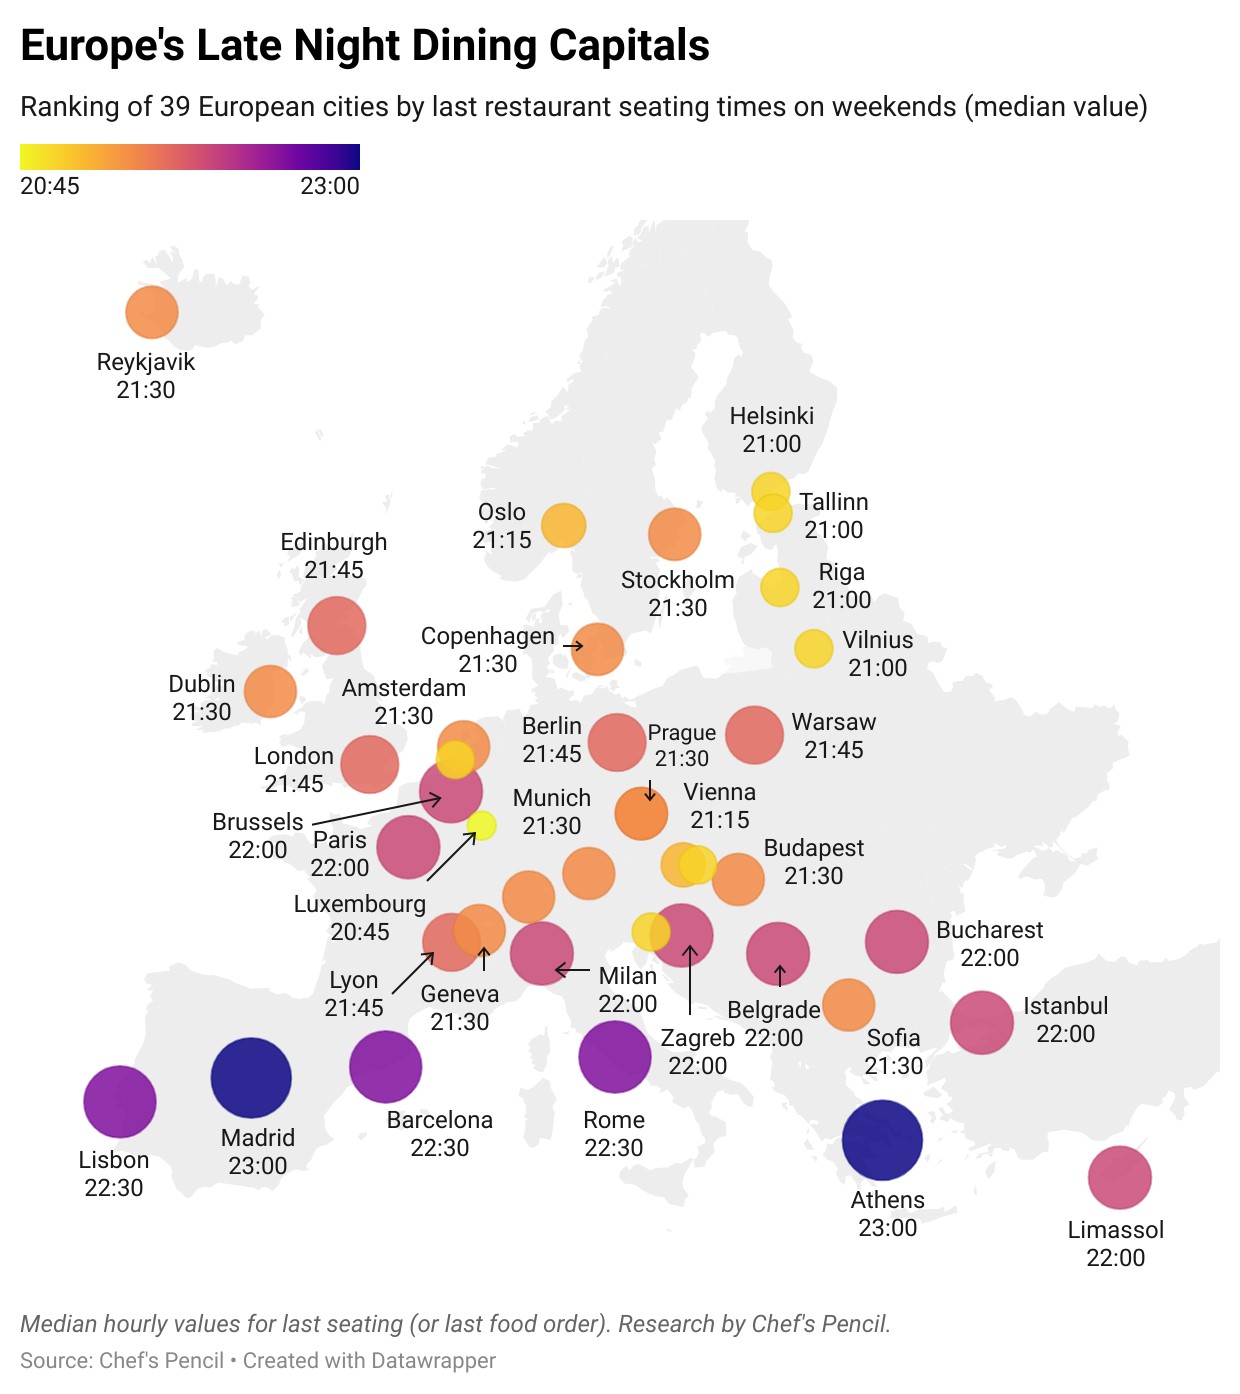
Lisbon, Portugal |
22:30 |
|
Las Vegas, USA |
22:30 |
|
Barcelona, Spain |
22:30 |
The Lollapalooza Effect
Toast data shows Lollapalooza 2024’s effect on local Chicago restaurants. Here is a quick overview of the key findings:
- Savory sales soared as attendees seek comfort food to recharge. Burrito sales were up 14 percent compared to the weekends before Lollapalooza, along with breakfast items such as breakfast platters and omelettes. Dumplings and bowl sales were also both up by 6 percent. Some honorable mentions were sandwiches/wraps and burgers, all with a 5 percent increase in sales.
- But hold the chicken. Chicken tenders (-6 percent), roasted chicken (-5 percent), and chicken wing (-4 percent) sales were all down during the festival.
- Attendees were hydrating, not boozing. Though both breakfast and late-night sales were up, attendees were not consuming as much alcohol before and after the show compared to the weekends prior to the event. Cider sales were down by 16 percent, hard seltzers by 12 percent, and beer by 11 percent. This is likely due to the high alcohol sales of local vendors at the festival.
- Feativals bring early risers & late night munchies. Attendees began by fueling up for the day with a hearty breakfast. Sales began to rise again at 8 a.m. (+2 percent) and reached a peak at 10 a.m.(+12 percent). Restaurants then saw sales start to pick up around midnight (+6 percent), as the last few sets typically ran from 9 p.m.-11 p.m.
- From midnight to 4 a.m. (+16 percent) sales continued to mostly increase, and then sharply declined from 5 a.m.-6 a.m. (-14 percent). Ah, 5 a.m., the perfect bedtime.
- What does this mean —> Chicago restaurants should prepare for early mornings, late nights, and hefty servings for Lolla 2025
- From sunrise breakfast rushes to midnight madness, restaurant businesses near Lollapalooza dance to a unique beat. Understanding festival-goers' eating habits is key. By adapting menus, adjusting hours, and offering the right mix of pre-event fuel and post-show comfort food, local joints can significantly boost their sales.
Little Treat Culture
“Little treat culture” (aka that pricey afternoon latte & cookie) is a trend not only rising on TikTok, but it's also taking over the workplace, according to data from ezCater.
"Little treat culture" is more than just an excuse for an office snack. As seen trending on TikTok, in the news, and even with new menu items, it refers to the growing trend of indulging in small, enjoyable snacks or indulgences during the workday as a form of self-care or reward.
But what's behind this delicious uptick in workplace indulgence? ezCater, recently surveyed 5,000 full-time employees across the U.S. to find out:
- Sweet treats in the workplace are on the rise: 30 percent of workers reach for a treat daily, and a whopping 76 percent indulge at least weekly.
- Employees are most likely to consume "little treats" during the mid-afternoon break (62 percent), followed by the mid-morning break (37 percent), suggesting strategic moments for employers to offer treats to boost morale and energy.
- Energy boosts (53 percent) and self-rewarding (42 percent) are the primary motivations for enjoying "little treats," with stress relief also playing a significant role (38 percent).
- Candy/chocolate (54 percent) and salty snacks like chips and pretzels (51 percent) top the list of preferred "little treats" at work, followed by cookies (44 percent) and pastries (37 percent).
- However, not all age groups snack the same — Not all age groups snack the same — 87 percent of Gen Zers lead the pack with weekly treats, while only 66 percent of Gen X do the same.
- Social activity with colleagues is a motivator for 17 percent of respondents
- Tracking Little Treat Trends on ezCater — Tuesday is the ultimate day for workplace treats, with Monday coming in a close second.