MRM Research Roundup: The Neighborhood Economy, Dirty Soda Pops, and Peeps Polarization
17 Min Read By MRM Staff
This edition of Modern Restaurant Management (MRM) magazine's Research Roundup features burger pricing, tech investment, the connection between cooking oil and restaurant choice, awarding innovation and sustainability, and why regulars are the lifeblood of kocal business.
Brands Investing in Tech
Despite margin pressure, brands are investing heavily in technology, including AI, to combat economic headwinds and declining guest traffic, according to Qu’s seventh annual Restaurant Technology Benchmark Report. The data also underscores a major challenge for restaurant brands: operational gaps between order processing and food preparation, leading to fragmented guest experiences.
Key findings from the report include:
1. Macro-economic pressures drive a shift toward smarter commerce. Declining traffic pressure, combined with fragmented systems and operational execution challenges, adds more complexity, resulting in disconnected guest experiences.
● 57 percent report a decline in guest traffic (QSRs reporting 67 percent).
● 55 percent cite operational execution as the top barrier to delivering a better guest experience, followed by fragmented systems and data (37 percent).
● 62 percent say improving order flow across all channels is the top priority for 2026.
2. Tech spend is increasing, while margins are squeezed. Brands view technology as a strategic tool to drive efficiency and guest engagement.
● Nearly half of brands (48 percent) report increasing tech investment in 2026, naming digital guest experience as the top priority (57 percent).
● QSRs are accelerating investment after lagging in tech spend over the last several years — 54 percent plan to increase spend compared with 44 percent of fast casual restaurants.
3. AI moves from “if” to “where,” but value lags. As AI adoption accelerates, brands reevaluate the way they deliver outcomes across the guest experience and restaurant operations.
● 73 percent of operators are actively investing in AI or plan to start in 2026. Use cases focus on guest growth (53 percent), followed by operations (40 percent).
● Only five percent report measurable operational value or guest impact from AI to date, with an additional 33 percent reporting that value is emerging.
● QSRs emphasize front-of-house technologies, especially voice ordering (33 percent) and drive-thru computer vision (23 percent).
The report examines the challenges faced by 168 brands representing 94,000 fast-casual and quick-service restaurant (QSR) locations and their strategies to drive growth.
CEOs and Operators: Technology Through Different Lenses
The report reveals a clear perception gap between restaurant CEOs and the leaders responsible for running daily operations. While more than half of CEOs (53 percent) reported no major system instability affecting their brand, only 17 percent of non-CEO leaders said the same, suggesting the executives closest to operations experience technology challenges and guest impact more directly.
This difference highlights a broader dynamic: CEOs tend to prioritize strategic innovation, including operational efficiency, AI, and automation, while functional leaders focus on the reliability, data integration, and system performance that shape everyday execution and the guest experience. Without stronger cross-functional alignment, restaurants risk accelerating innovation agendas while the foundational systems needed to support them remain under strain.
2026 Sales and Job Data
For January sales, eating and drinking places registered total sales of $99.8 billion on a seasonally adjusted basis, according to preliminary data from the U.S. Census Bureau. That was down slightly from December’s sales volume of $100.0 billion.
January represented the second consecutive downtick in restaurant sales, after peaking at $100.2 billion in November. Despite the recent soft patch, eating and drinking place sales stood 3.9 percent above their year-ago level in January. While that was down from 12-month gains of nearly seven percent in mid-2025, the trendline continued to point in a positive direction.
For February jobs, eating and drinking places lost a net 29,700 jobs in February on a seasonally-adjusted basis, according to preliminary data from the Bureau of Labor Statistics (BLS).
February represented the industry’s largest monthly decline since February 2025, when restaurants lost more than 38,000 jobs, but even with this decline, eating and drinking places added a net 128,800 jobs during the past 12 months. In comparison, the overall economy added just 156,000 jobs during that period.
The Local Impact
Square published its 2026 Local Economy Report , a first-of-its-kind analysis revealing how "regulars" and the neighborhood networks they create are the backbone of thriving local economies. The report reveals that regular customers drive six times more revenue for local businesses, and unpacks the patterns and trends in their spending. This includes regulars making predictable purchases, tipping more generously, and prioritizing in-person experiences, which ultimately creates the steady demand businesses rely on during periods of economic uncertainty.
The report also shows how business success is no longer measured solely within a business's own four walls, but also by connections to regular customers and neighboring businesses. Square found that 32 percent of regular customers are shared by businesses in the same ZIP code, and each network connection between businesses can generate thousands in additional annual revenue.
The Neighborhood Network Effect: How Shared Regulars Power Local Economies
Square's analysis of millions of anonymized transactions reveals that local businesses are interconnected through shared regular customers, who create neighborhood networks where one business's success supports the next. The report reveals that:
- 32 percent of regular customers are shared between businesses in the same ZIP code, keeping dollars circulating locally
- Each network connection is correlated with notable revenue growth: In Los Angeles, businesses earn an average of $2,201 more in annual revenue per connection, with similar lifts in Chicago ($1,100), New York ($1,500), and San Francisco ($2,025)
- In San Francisco, 67 percent of sellers are connected to other nearby businesses through shared regulars
- Coffee shops and casual dining establishments serve as the most common neighborhood connectors, acting as everyday hubs that funnel customers to retail, beauty, and service businesses
- Looking at Cash App consumer data, up to 60 cents of every dollar spent at local businesses stays circulating within the neighborhood
The 6x Effect: Why Regulars Are the Lifeblood of Local Business
At the center of neighborhood resilience is the "regular,” a customer who visits a business at least four times per year. Square data shows these loyal customers are dramatically more valuable:
- Regular customers generate 6X more annual revenue than one-time visitors nationally – in Atlanta, this rises to 7X
- Regulars tip 11 percent higher on average compared to transient customers
- Regular customer revenue grew 7.67 percent in 2025, outpacing overall revenue growth
- (6.97 percent), even as transient revenue declined
- Product consistency drives loyalty: 78 percent of regulars at beauty businesses buy the same
- products each time; 59 percent of food & beverage regulars make the same order
- 90 percent of businesses using marketing tools successfully maintained regular customers in
- 2025, compared to only 38 percent of those that didn't
Consumers Are Staying Local Despite Economic Pressure
Loyalty from regulars has proven especially durable over time. Revenue from regular customers peaked during the height of the pandemic and has continued to grow since, underscoring loyalty’s role as the most reliable hedge against volatility.
In 2026, despite rising costs and economic uncertainty, consumer commitment to local commerce remains strong:
- 75 percent of consumers plan to spend at least as much, if not more, at local businesses over the next 12 months
- 55 percent shop or dine at local businesses in their ZIP code at least weekly
- 32 percent often or always visit multiple local businesses in a single outing, reinforcing the neighborhood network effect
- 72 percent of consumers will tolerate price increases if paired with added value, such as better products or exclusive offers
However, spending priorities are shifting. When forced to cut back, consumers say they are most likely to reduce spending at bars, breweries (27 percent), and full-service restaurants (27 percent), while retail remains the most stable category with 78 percent of consumers maintaining or increasing spending.
Looking Ahead to 2026: The Path Forward for Local Businesses
The path forward for local businesses is clear: consumers will continue to shop locally, but with intention. As the multi-stop habit continues to define how people shop and dine, the businesses that invest in loyalty, convenience, and community will turn economic pressure into neighborhood growth.
Intention is not only a consumer trend, but also a strategic seller tactic. The businesses that lead in 2026 are those actively building neighborhood networks by deepening relationships with regulars, collaborating with nearby sellers, and creating shared experiences that turn occasional visitors into repeat customers across the block. By strengthening these connections, sellers expand their base of regulars and unlock the measurable revenue growth that comes from loyalty.
Worldwide Foodservice Traffic
Global foodservice traffic increased by 0.2 percent over the past year, even against broad macroeconomic challenges, according to Circana LLC's 2025 global foodservice performance results. While domestic traffic in the United States decreased by 0.3 percent year over year, the data highlights significant international growth opportunities, with China and Canada delivering meaningful traffic growth among the 12 key markets analyzed.
Despite minimal overall traffic growth, consumer spending in foodservice grew in 2025 due to increases in average eater check sizes, signaling a healthy top line in out-of-home dining. In the final quarter of 2025, traffic growth was also minimal, though consumer spending in foodservice posted continued gains, driven by a 3 percent increase in the average spend per visit.
Among all foodservice channels, quick-service restaurants (QSR) emerged as the primary stabilizer. QSRs accounted for 50 percent of global foodservice traffic and continued to strengthen their influence, with global QSR traffic registering a 0.8 percent increase in 2025. China, in particular, drove QSR growth, helping offset declines observed in major markets such as Brazil and South Korea. Full-service restaurants also contributed steady gains, growing by 0.6 percent for the year, while both non-commercial and retail foodservice sectors saw traffic declines during the same period.
Country-specific analysis reveals encouraging signs of growth in Q4 2025, with foodservice traffic increasing in China, the United States, Canada, Australia, and Germany. While China and Canada were the only countries to achieve significant full-year growth, the broader Q4 gains across five countries signal positive momentum and provide a foundation for optimism heading into 2026. This highlights the potential for improved performance with a strategic focus on key markets.
Michelin-Starred Chef Data
Chef’s Pencil published data-driven analysis on Chef's Pencil examining the educational backgrounds of 278 Michelin-starred chefs currently leading restaurants across the United States.
One interesting takeaway: the long-standing myth of the self-trained Michelin chef doesn’t fully hold up to the data.
The analysis found that:
• 61 percent of Michelin-starred chefs attended culinary school
• 39 percent built their careers through apprenticeships and kitchen experience
• The Culinary Institute of America produced the largest share of Michelin chefs (14 percent)
The dataset also reflects the recent geographic expansion of the Michelin Guide across the U.S., incorporating cities such as Atlanta, Miami, Dallas, Houston, Nashville, New Orleans, and Denver.
Rising Burger Prices
Burger menu prices have risen in recent years, but not nearly as fast as the cost of beef. The gap highlights the pricing pressure restaurant operators are navigating and the strategic decisions required to balance traffic and profitability. Burgers are one of the most price-visible items in foodservice and often serve as a value benchmark for diners.
2026 Datassential Burger Price Index
New data from Datassential's Burger Price Index shows burger menu prices have increased approximately 14 percent since January 2023, while beef production costs have surged roughly 32 percent during the same period. Restaurants often manage pricing strategically across the menu, limiting increases on high-visibility items while balancing costs across other categories.
Over that same timeframe, federal Food Away From Home inflation rose about 13 percent, meaning burger prices have tracked closely with overall restaurant inflation even as beef costs have risen much more sharply. The gap highlights one of the central pricing dynamics in foodservice: burgers remain one of the most traffic-driving menu items in the industry. For many restaurant brands, the price of a burger acts as a signal to consumers about overall value.
Burger Price Inflation Slows Sharply in 2025
After pronounced price increases throughout 2024, burger price growth cooled dramatically in 2025. By December 2025, burger prices were just 0.4 percent higher year-over-year, a slowdown compared with earlier inflation cycles. Limited-service restaurants (LSRs) increased burger prices more aggressively overall, with prices rising roughly 16 percent since 2023, compared to 12 percent at full-service restaurants (FSRs).
By the end of 2025, however, year-over-year price growth across both segments had converged to roughly 2.5 percent. The data highlights how operators are navigating a difficult balance: protecting prices on high-visibility menu items while managing significant volatility in underlying food costs.
Toast Trends
Toast's Q4 2025 Restaurant Trends Report, which deep dives into how the rising price of coffee affected restaurant sales, along with an update on the current state of tipping across the U.S.
Report’s highlights include:
-
☕ Premium Over Staples: While regular drip coffee sales fell by 3.3 percent and cold brew down 2.2 percent in Q4 2025, consumers shifted toward "treat" culture, with barista-crafted lattes up 4.0 percent and espresso shots up 3.3 percent.
-
⚡Caffeine in a Can: Consumers are increasingly choosing convenience for their caffeine fix; energy drink sales increased by 8.7 percent, followed by diet sodas at 7.4 percent.
-
📈 Pricing Pressure: Median prices for a cup of drip coffee increased to $3.65 (up 4.3 percent YoY), while cold brew reached a median of $5.58 (up 4.1 percent) YoY, driven by climate impacts and production costs in the "bean belt."
-
💰Tipping Holds Steady: Average tipping rates remained flat in Q4 2025 compared to the previous quarter, with guests at full-service restaurants sticking to 19.2 percent and quick-service diners holding at 15.8 percent.
-
📍Delaware remained the best state overall for tipping with an average of 21.8 percent in Q4 2025, up from 21.1 percent in Q3 2025.
-
📍California is again at the bottom of the list with an average of 17.2 percent in Q4 2025, the same as in Q3 2025.
-
Toast's February 2026 Menu Price Monitor, released concurrently with the February CPI, which provides a granular view of how inflation is affecting restaurant menus, offering real-time data on price changes for popular items such as burgers, chicken wings, and coffee.
Highlights include:
-
🍔 Burger Prices Start Steadying: The median price of a burger in February was $14.64, up 0.1 percent from January 2026. Year-over-year, prices are up 2.7 percent since February 2025.
-
🧊 Cold Brew Creeps Up: The median price of a cold brew in February was $5.58, up 0.5 percent from January 2026. Year-over-year, prices are up 4.1 percent since February 2025.
-
☕️ Regular Coffee Climbs: The median price of a regular coffee in February was $3.65, up 1.1 percent from January 2026. Year-over-year, prices are up 4.3 percent since February 2025.
-
🌯 Burrito Prices Dip Slightly: The median price of a burger in February was $13.50, down 0.1 percent from January 2026. Year-over-year, prices are up 2.5 percent since February 2025.
-
🍻 Beer Prices Barely Bubble: The median price of a beer in February was $6.49, up 0.2 percent from January 2026. Year-over-year, prices are up 1.9 percent since February 2025.
-
🍗 Chicken Wings Prices Rise: The median price of a burger in February was $13.91, up 0.7 percent from January 2026. Year-over-year, prices are up 1.5 percent since February 2025.
Foot Traffic Statistics
Placer.ai has released a number of foot-traffic reports.
Chick-fil-A has the perfect recipe for sustainable growth in the QSR space, according to a new Placer.ai report.
The chain is consistently opening new locations, and while that normally dilutes foot traffic numbers, Chick-fil-A’s continue to grow: Overall, year-over-year foot traffic increased every single month between September 2025 and February 2026, and average visits per location increased during four of those six months.
The secret sauce? Operational efficiency, disciplined growth, and one more key element: “A loyal customer base that values quality and experience over aggressive promotions,” per the report. “Positioned as a premium QSR brand straddling the line between fast food and fast casual, the chain emphasizes consistency, menu simplicity, and high-touch service rather than heavy discounting.”
The Shamrock Shake and the new Big Arch Burger had a “limited impact” on foot traffic for McDonald’s, according to a new Placer.ai report.
These limited-time offers (LTOs) “generated only modest, short-lived increases in foot traffic,” the report says, adding that the “limited impact of these LTOs suggests consumers may be growing more selective in their spending amid ongoing economic pressure.”
-
The Shamrock Shake, an annual menu addition released around St. Patrick’s Day, launched in the week of February 16 this year. Visits grew 5.5 percent year over year that week, but fell 0.5 percent the following week, suggesting the seasonal item yielded just a brief bump.
-
The Big Arch burger launched the week of March 2 this year, during which McDonald’s saw a 2.2 percent year-over-year increase in visits, though “performance may strengthen as the item gains traction with consumers.”
“Dirty soda” is sweepingly popular, according to a new Placer.ai report. The report, which analyzes Utah-based drive-thru soda chain Swig, finds that its rapid expansion efforts are yielding “outsized traffic growth, more than doubling since 2023.”
“Known for mixing classic soft drinks with flavored syrups, creams, and fruit add-ins — alongside cookies and pretzel bites — the brand has expanded well beyond its Mountain West roots,” the report reads.
The traffic tells the story:
-
In February 2026, foot traffic grew nearly 138 percent compared to February 2023.
-
Foot traffic grew 30.7 percent compared to February 2025.
-
A seasonal pattern has emerged, with visits peaking during the summer months in recent years.
-
Its largest audience segments are “Wealthy Suburban Families” and “Upper Suburban Diverse Families.”
Cooking Oil Driving Restaurant Selection
A national survey of 1,005 U.S. consumers from Coast Packing Company finds that younger Americans are reshaping how restaurants think about cooking fats. More than half of diners ages 18–34 (52 percent) say knowing whether a restaurant uses beef tallow or seed oils affects where they choose to eat. Among those 55 and older, that number drops to just 33 percent. The 19-point gap points to a generational divide that the restaurant industry may not yet fully appreciate.
The divide sharpens further when diners are asked to choose directly. When presented with two otherwise identical restaurants–one cooking with beef tallow, the other with seed oils–nearly 1 in 3 adults ages 18–34 (31 percent) pick the beef tallow restaurant. Among those 55 and older, just 19 percent make the same choice. Millennials choose beef tallow at 28 percent and Gen Z at 29 percent, compared with only 19 percent of Boomers.
The broader preference data tells the same story. When asked which cooking fat they want restaurants to use, nearly 1 in 4 diners (24.7 percent) prefer traditional animal fats, such as butter or beef tallow, compared with just 15.6 percent who prefer seed or vegetable oils. That’s a nearly 60 percent preference gap. Among the youngest diners, butter preference alone jumps to 25 percent, and beef tallow preference reaches 11.4 percent compared with 5.8 percent among those 55 and older, who are less than half as likely to choose it.
Coast has tracked consumer attitudes toward animal fats for more than a decade. Earlier research found growing openness to lard and beef tallow, particularly among younger diners who associate them with better flavor and old-school cooking. This latest survey moves beyond attitudes to actual dining behavior — asking not just what consumers think about cooking fats, but whether those opinions translate into where they spend their money. The results suggest they do.
The findings land alongside broader industry signals. Whole Foods Market’s 2026 food trend forecast named beef tallow as an emerging ingredient gaining visibility on menus. Market analysts project continued growth in the global tallow sector through 2030. And while the survey does not suggest a sweeping change in restaurant kitchens overnight, it does indicate that cooking fat — long treated as a back-of-house operational choice — is becoming a front-of-house consideration for a growing share of diners.
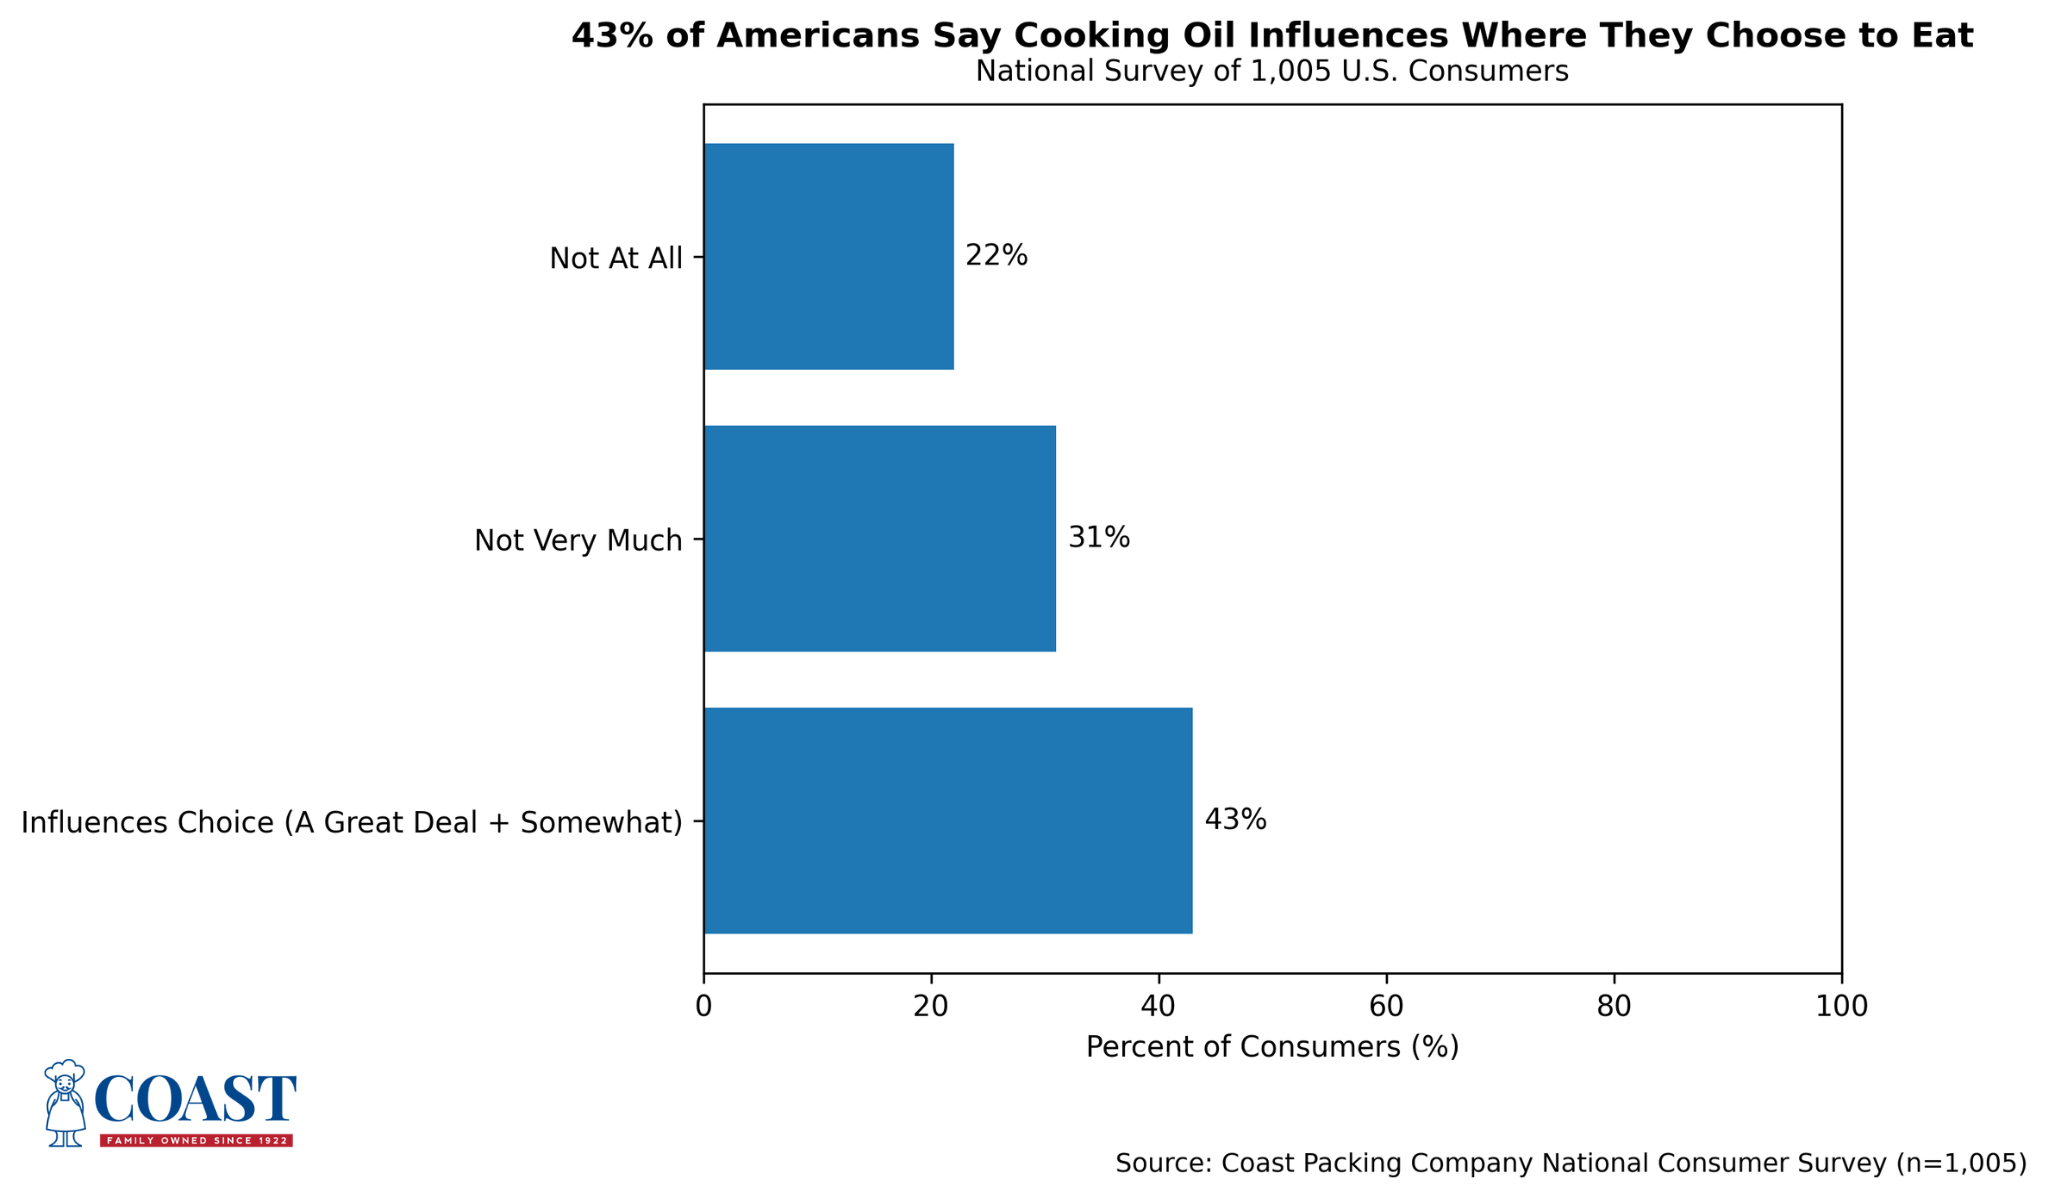
The survey was conducted Feb. 18–19, 2026, among 1,005 U.S. consumers and measured dining preferences and the influence of cooking oil on restaurant selection.
Frozen Bakery Products Market
The global frozen bakery products market is steadily transforming the way consumers and businesses experience baked goods. According to recent research, the market is projected to grow from USD 26.80 billion in 2025 to USD 34.61 billion by 2030, at a CAGR of 5.2 percent.
A Frozen Bakery Products Market Built on Convenience and Consistency
Frozen bakery products have evolved far beyond simple storage solutions. Today, they represent a highly efficient way to deliver fresh-tasting baked goods with extended shelf life and minimal preparation.
From bread and pizza crusts to cakes and pastries, frozen formats now cater to a wide range of consumption needs, including:
-
Ready-to-proof
-
Ready-to-bake
-
Ready-to-eat
Advancements in freezing technology have made it possible to preserve taste, texture, and nutritional value, allowing both consumers and businesses to enjoy bakery-quality products anytime.
Rising Demand for Specialty and Health-Focused Products
One of the most significant shifts in the market is the growing demand for specialty frozen bakery products. Consumers are increasingly seeking options that align with their health goals and dietary preferences.
This includes:
-
Gluten-free and allergen-friendly products
-
Organic and clean-label formulations
-
Low-calorie and sugar-free options
-
Fortified bakery products with added nutrients
Manufacturers are responding by innovating with alternative ingredients, improving product formulations, and ensuring that health-focused products do not compromise on taste or texture.
Ready-to-Bake: The Perfect Balance of Freshness and Efficiency
Among different consumption formats, the ready-to-bake segment holds a strong position in the market.
These products, such as partially baked bread, croissants, and pizza crusts, allow users to complete the baking process on demand. The result is a freshly baked experience with minimal effort.
Key advantages include:
-
Fresh aroma, taste, and texture
-
Reduced food waste
-
Better inventory management
-
Consistent product quality
This format is particularly popular in supermarkets, in-store bakeries, and foodservice operations, where efficiency and freshness are equally important.
Foodservice and Retail Driving Industry Expansion
Frozen bakery products are widely distributed through:
-
Conventional retail stores
-
Specialty bakery outlets
-
Foodservice providers including hotels, restaurants, and catering services
For foodservice operators, frozen formats offer significant operational advantages. They simplify preparation, ensure consistency across locations, and reduce dependency on skilled labor.
At the same time, expanding cold-chain infrastructure is making these products more accessible across regions, further supporting market growth.
Regional Insights: North America Leads with Strong Infrastructure
North America holds a significant share of the global frozen bakery products industry, supported by its advanced retail and logistics ecosystem.
Key strengths of the region include:
-
Well-established supermarket and retail chains
-
Strong cold-chain infrastructure
-
High consumer acceptance of frozen foods
-
Large and diverse foodservice industry
Regulatory oversight ensures consistent product quality and safety, while widespread availability makes frozen bakery products a routine part of consumer purchasing behavior.
IRC and Chase Innovator Awards
The Independent Restaurant Coalition (IRC) and Chase announced the 40 recipients of the IRC and Chase Innovator Awards, a $1 million grant program celebrating the ideas, practices and business models that promote sustainability and environmental innovation. Selected from across the country, each recipient has received a $25,000 grant to strengthen and iterate proven practices in sustainability, workforce well-being and community impact.
The Innovator Awards are part of the IRC and Chase multi-year partnership, which also includes the $3 million IRC and Chase Disaster Relief Fund. To date, the programs have awarded $4 million in grants to independent restaurants and bars, with an additional $2 million pledged for disaster relief in 2026.
Common Threads
The 40 awardees were carefully selected for advancing replicable, values-driven practices that demonstrate measurable impact and potential to grow. Themes represented across this year’s recipients include:
- Community impact and civic engagement: restaurants functioning as hubs for cultural exchange, food access, education and advocacy, integrating community care into their core business models.
- Workforce well-being and equitable models: fair wages, pooled tips, profit sharing, childcare access, mental health resources and transparent financial practices that treat restaurant work as a respected profession.
- Sustainability and local sourcing: zero-waste kitchens, preservation and fermentation, closed-loop systems and regenerative farm partnerships that reduce environmental harm and strengthen regional supply chains.
- Cultural preservation and representation: honoring immigrant and Indigenous foodways, intergenerational leadership and neighborhood-rooted concepts that sustain local identity and economic opportunity.
Innovators Leading the Way
The Innovator Awards recipients demonstrate the many unique ways that independent restaurants serve their neighbors. Standout examples of sustainability, care for teams and community connection found across the US include:
-
Lita (New Jersey): A radically reimagined labor model where all staff rotate between front- and back-of-house roles, share equal base pay and pool tips across the team, promoting equity, empathy and long-term career sustainability. Grant funds will support training and documentation to share this replicable workforce approach.
-
Immigrant Food (Washington, D.C.): A restaurant and nonprofit platform that translates food into civic engagement through menu design, partnerships and programming that celebrates immigrant cultures and advances immigrant rights. Funding will help scale community storytelling and advocacy initiatives.
-
Miss Kim (Michigan): A people-first restaurant model grounded in fair wages, profit sharing, open-book finance and staff education and scholarships, treating restaurant work as a respected profession. Grant support will help deepen transparent practices and expand workforce development programming.
-
Güero (Oregon): A year-round community hub offering bilingual education, chef incubators, ecological programming and no-cost community access to space and resources, positioning restaurants as durable civic infrastructure. Grant funding will bolster education and incubator programming to broaden local impact.
-
Magpie (California): A farm-driven restaurant that integrates preservation, waste reduction, whole-animal cooking and long-term relationships with regional producers, demonstrating disciplined sustainability embedded in everyday operations.
Workforce Training Investment
Hospitality companies are increasing investment in workforce training again, but a different constraint is shaping how those programs operate: Time.
According to the 2026 Hospitality Training 360 Report, a report from Opus Training and the Council of Hotel and Restaurant Trainers (CHART), 55–61 percent of hospitality organizations expect to increase training spend in 2026. At the same time, 55 percent of respondents say time pressure and operational speed are the biggest factors shaping training decisions, surpassing budget limitations.
The findings reflect a broader shift in how hospitality companies approach training.
As restaurants and hospitality operators scale, training is increasingly moving out of centralized programs and into day-to-day operations led by field managers.
Key findings from the report include:
Investment in training is rising: A majority of companies expect training budgets to increase across frontline and management roles in 2026.
Ongoing training gaining priority: More organizations are shifting resources toward continuous training instead of focusing primarily on onboarding.
Managers taking on training responsibilities: Managers are increasingly responsible for coaching and development on the floor.
Organizations are still struggling to measure: While most leaders believe training improves business outcomes, many still rely on subjective signals such as manager feedback instead of operational metrics.
Use of AI and AI adoption is accelerating: Two-thirds of respondents now report regular or proficient use of AI in training workflows, primarily for content development and planning.
Peeps Polarization
A Curion Poll PULSE survey of more than 4,700 U.S. consumers focused on sentiment lays bare the Peeps paradox: nearly half of respondents report positive feelings toward the candy, while a meaningful segment remains firmly opposed. Specifically, 24.2 percent say they love Peeps and 23.3 percent say they like them — together comprising nearly half the population. On the other side, 17.4 percent don’t like them and 8.1 percent actively hate them, while 21.4 percent land in the middle of the road.
Tradition and Nostalgia: The Real Drivers of Purchase
When Curion asked more than 8,000 consumers why they purchase Peeps, the answers went well beyond personal taste. Nearly one-third (32.9 percent) cited holiday tradition as their primary motivation, and 28.4 percent purchase them as gifting or basket fillers. Nostalgia drove 23.4 percent of purchases, while 25.2 percent buy them for family members who enjoy them.
In short, for many consumers, buying Peeps is not a matter of craving, it’s a ritual.
How Americans Actually Eat Peeps
In a third separate Curion Poll PULSE survey of more than 6,200 consumers, it explored consumption behavior among those who have eaten Peeps in the past year. The results reveal a surprisingly adventurous audience. While 56.6 percent eat them straight from the package, a meaningful minority uses them in more creative ways: 10.8 percent open the package and let them harden before eating, 8.6 percent roast them like a marshmallow, 8.5 percent incorporate them into s’mores, and 6.4 percent microwave them.
This behavioral diversity suggests Peeps function more like a versatile seasonal ingredient for some consumers than a simple grab-and-eat snack, a dynamic that opens brand and innovation opportunities for further amplification.
What the Curion Score Reveals About Product Performance
For the Marshmallow Peep, the Curion Score analysis found a product whose sensory profile tells a nuanced story. Peeps sit at a 6.7 Overall Liking score (OAL), but the Curion Score data dives deeper past simply OAL to reflect deeper drivers of product performance. Texture is a clear strength, with consumers responding positive to the product’s airy, soft quality. However, flavor balance presents an opportunity: consumers perceive the vanilla flavor as too subtle relative to an intensity of sweetness that some find overwhelming. This imbalance likely contributes to the polarization the brand is both known for and, arguably, has learned to leverage.
The Endurance of an Icon
Peeps demonstrate a principle that consumer insights professionals know well: in a fragmented snack landscape, brands that own a feeling outperform those that merely own a function. Peeps do not compete with premium chocolate or artisanal confections. They occupy a distinct sensory and emotional space, soft texture, sugar crunch, vivid color, and deep-rooted holiday symbolism that coexists alongside more sophisticated sweets without trying to replace them.