MRM Research Roundup: Road Trips, Cheese Obsessed, and Burger Bucks
11 Min Read By MRM Staff
This edition of Modern Restaurant Management (MRM) magazine's Research Roundup features how summer drinking is being redefined, burger pricing, American’s love affair with cheese, and fast-food location changes.
Rethinking Dining
Rising energy costs and forcing Americans to rethink their dining habits, according to the April Fiserv Small Business Index.
Key takeaways:
-
Overall Restaurant Performance: The index stood at 121.6, reflecting a slight month-over-month dip (-0.2 percent MoM) and year-over-year decrease (-1.6 percent YoY).
-
The Fast-Food Slump: Limited-service restaurants experienced a significant (-4.8 percent YoY) decline in sales as well as a month-over-month decrease (-0.8 percent MoM), signaling that consumers are continuing to scale back on QSRs.
-
The Full-Service Advantage: Full-service restaurants experienced sales growth (+0.8 percent YoY) and (+0.2 percent MoM), maintaining resilience despite broader economic pressures.
Hitting the Road
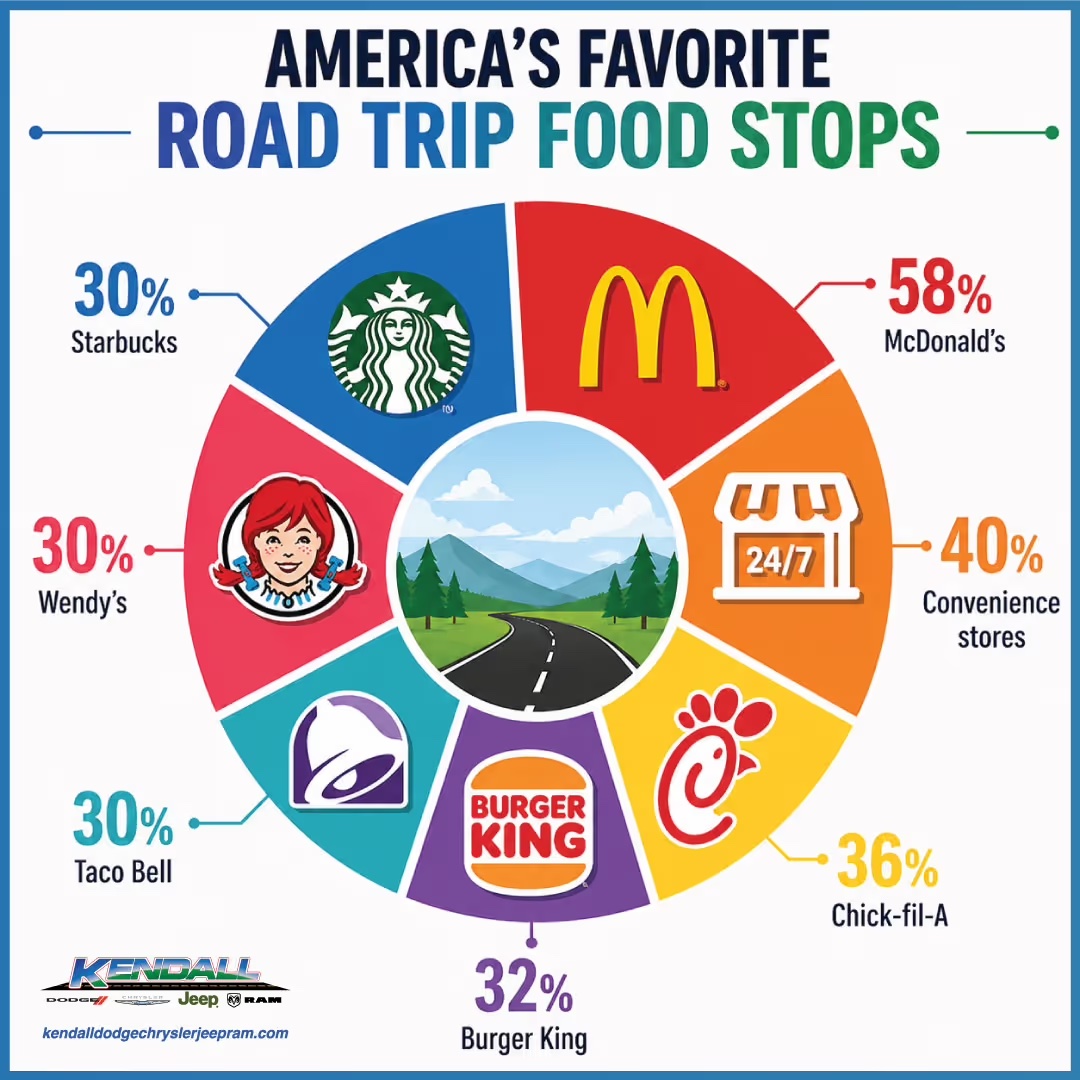
Atlantic Coast Automotive analyzed road trip behavior data from U.S. drivers and uncovered some interesting patterns tied to food choices on the road—particularly how stress, convenience, and situational factors influence what people eat while traveling, from fast food decisions to how hunger and timing impact food selection during long drives.
Insights include:
- Leading the pack is McDonald’s, with 58 percent of drivers saying they stop there during road trips, making it the most common choice by a wide margin.
- Chains like McDonald’s dominate not just because of taste, but because of predictability.
- The high share of convenience store stops highlights a different priority: efficiency. The goal isn’t to sit down and eat–it’s to refuel quickly and keep moving.
- How stress and time pressure influence fast food decisions during road trips
- The role convenience plays in determining where and what drivers eat while traveling.
This study is based on a survey of 500 U.S. respondents and explores road trip behaviors, emotional responses, and travel preferences across a range of demographics.
Summer Drinking Redefined
Young Americans aren’t opting out of summer drinking — they’re redefining how they do it, according to data from the International Alliance for Responsible Drinking and conducted by Talker Research.
A recent survey of 2,000 21+ Americans who drink alcohol found that Gen Z respondents were the most likely to say they plan to consume alcohol when celebrating at summer events and socializing with friends this summer, but they also plan to take the most intentional and moderate approach when doing so.
The vast majority of respondents (86 percent) plan to drink during summer celebrations and occasions, suggesting that alcohol consumption isn’t going away, it’s just being done with forethought and intentional behavior meant to prioritize well-being.
When socializing at summer gatherings, libations are often top of mind, with Gen Z (89 percent) being the most likely to say they plan to partake in drinking when socializing this summer, compared to millennials (87 percent), Gen X (87 percent) and baby boomers (81 percent).
However, nearly half of respondents (49 percent) also said they’ve become more intentional when it comes to drinking, once again with young Americans leading this uptick in moderate drinking (Gen Z 64 percent, millennials 49 percent, Gen X 43 percent, baby boomers 39 percent).
According to the findings, for those who choose to drink, there was strong sentiment that the behavior is being driven by how people want to feel versus social pressures. The top reason for mindful drinking cited in the study was emotional well-being (30 percent), followed by consumers simply preferring quality over quantity (28 percent).
Desiring better sleep was also a major reason people said they drink in moderation (28 percent), with women more likely than men to rank it as the number one reason (43 percent to 30 percent). And a quarter of respondents felt like mindful drinking is just “the right approach” (26 percent).
The findings also revealed that Gen Z was more likely than all other generations to say that nearly every consideration, from emotional well-being to fitness goals or saving money, influenced them to drink intentionally, suggesting that intentionality and moderation are more important to them than any other age group.
According to the study findings, moderation will influence consumers’ drinking habits even more than taste when consuming alcohol this summer.
Zooming in, when asked what factor will shape their drinking habits the most this summer season, more people cited moderation (35 percent) as the No. 1 consideration that will impact their alcohol consumption, than taste (33 percent), cost (13 percent) or even wanting to be social (16 percent).
And interestingly, only 4 percent of those who plan to drink at summer gatherings this year said that other people’s drinking habits will be the thing that shapes their own consumption the most.
This corresponds with the survey finding that self-determination is paramount to consumers. In the survey, Americans voiced how important personal choice is to them when it comes to alcohol, with the vast majority (93 percent) saying it’s vital that their drinking choices are fully self-directed and not influenced by others.
These findings pose the question of whether there’s a subtle cultural shift happening, where consumers are feeling confident enough to make the choice to drink when socializing solely based on their own desires and parameters, rather than based on other people’s.
According to the data, it seems that the old narrative of peer pressure driving consumption is out-of-date. Drinking is becoming more individual, less about fitting in and more about personal choice. In fact, less than a quarter of all respondents said their drinking behavior is shaped by those around them (22 percent).
While the data points to strong attitudes and feelings towards moderate drinking, the survey also investigated how consumers actually intend to implement these sentiments when drinking in the summertime.
And per the results, people are using practical strategies to moderate, not just abstract intentions. Most (52 percent) plan to drink slowly, 49 percent plan to eat before or while drinking and 41 percent will have a plan for how to get home. A significant number (37 percent) will also set a personal drink limit in advance of socializing.
These findings demonstrate a true commitment to moderation, and not just a passing attitude. Moderation is showing up in real habits, not just good intentions.
Top Reasons for Moderate Drinking
Emotional well-being (30 percent)
Preferring quality over quantity (28 percent)
Better sleep (28 percent)
It’s the right approach (26 percent)
Wanting to achieve a well-balanced lifestyle in general (24 percent)
Saving money (22 percent)
Maintaining my social image or reputation (20 percent)
Family responsibilities (19 percent)
Work responsibilities (18 percent)
Setting a good example (18 percent)
Fitness goals (17 percent)
Avoiding regret (17 percent)
How People Plan to Drink Moderately This Summer
Drinking slowly rather than quickly (52 percent)
Eating prior to and while drinking (49 percent)
Planning before you go out, how you will get home safely (41 percent)
Paying attention to how alcohol affects your body and mood (40 percent)
Setting a personal drink limit in advance (37 percent)
Spacing alcoholic drinks with water or non-alcoholic beverages (e.g., “zebra striping”) (33 percent)
Counting and keeping track of the number of glasses, cans or bottles (32 percent)
Avoiding “rounds” or pressure to keep up with others (30 percent)
Stopping drinking at a certain time or switching to non-alcoholic options (30 percent)
Burger Bucks
In honor of National Burger Day, Toast released data analyzing transactions from restaurants nationwide to look at how inflation and seasonality are shaping America's burger consumption in 2026.
The new data highlights a shifting economic reality for burger lovers, with the national median price of a U.S. burger reaching $14.65 in April 2026—a 2.4 percent year-over-year increase driven by tightening supply pressures in the beef market and rising costs for fresh vegetable toppings and fuel.
Highlights include:
📈Burger bucks: The median U.S. burger cost $14.65 in April, up 2.4 percent YoY.
🌴Cheese for burgers in paradise: Hawaii’s median burger cost $18.94.
🆗Okie dough: Oklahoma had the cheapest median burger at $12.50.
🗽Big city, big money: NYC’s median burger cost $19.86.
💪Proteinmaxxing: Burger orders were +11.1 percent over the monthly median in May.
💸Mounting moolah: The median burger price in West Virginia rose 6.2 percent YoY.
Menu Price Monitor
Toast released its April Menu Price Monitor, offering a granular view of how inflation is truly impacting restaurant menus. April data shows chicken wing prices are continuing to rise, hitting a one-year high, while categories like coffee and burgers saw slight dips.
Highlights include:
🍗 Chicken wings prices heat up: The median price of chicken wings in April was $14.12, up 1.7 percent from March 2026. Year-over-year, prices have jumped 3.8 percent since April 2025, the highest increase in this category since then.
☕️ Regular coffee prices cool off: The median price of regular coffee in April was $3.65, down 1.1 percent from March 2026. Year-over-year, prices are up 4.3 percent since April 2025.
🧊 Cold brew prices dip: The median price of cold brew in April was $5.50, down 1.4 percent from March 2026. Year-over-year, prices are up 1.9 percent since April 2025.
🍔 Burger prices see slight decline: The median price of a burger in April was $14.50, down 0.9 percent from March 2026. Year-over-year, prices are up 1.4 percent since April 2025.
🌯 Burrito prices rise modestly: The median price of a burrito in April was $13.52, up 0.1 percent from March 2026. Year-over-year, prices are up 1.7 percent since April 2025.
🍻 Beer prices hold steady: The median price of a beer in April was $6.52, which remained flat from March 2026. Year-over-year, prices are up 1.1 percent since April 2025.
Fast Food Location Changes
Wendy's, Pizza Hut, Subway: Which Fast Food Chains Are Shrinking Fastest in America?
-
Battle of the burgers: In the past 12 months, McDonalds opened 190 locations, Burger King closed 46.
-
Chipotle is America’s fastest growing fast food chain, opening more locations than any other brand at 359.
-
Perfect Pie: Dominos beats Pizza Hut, adding 134 locations over the past year, compared to Pizza Hut, which saw a drop of 426.
Off the back of the recent news that Wendy’s will close hundreds of stores, a new analysis by business debt relief specialists Delancey Street has tracked US location counts for some of America's biggest fast food chains, comparing store locator data from approximately one year ago against current figures to reveal which brands are growing, which are retreating, and by exactly how much.
US Fast Food Location Changes: ~May 2025 vs May 2026
|
Rank |
Chain |
Number of Stores May 2025* |
Number of Stores May 2026 |
Change (Stores) |
percent Change |
|
1 |
Pizza Hut |
6,663 |
6,237 |
-426 |
-6.4 percent |
|
2 |
Subway |
20,456 |
20,054 |
-402 |
-2.0 percent |
|
3 |
Wendy's |
5,964 |
5,654 |
-310 |
-5.2 percent |
|
4 |
Starbucks |
17,015 |
16,875 |
-140 |
-0.8 percent |
|
5 |
KFC |
4,110 |
3,986 |
-124 |
-3.0 percent |
|
6 |
Burger King |
6,638 |
6,592 |
-46 |
-0.7 percent |
|
7 |
Denny's |
1,344 |
1,299 |
-45 |
-3.3 percent |
|
8 |
Papa John's |
3,215 |
3,189 |
-26 |
-0.8 percent |
|
9 |
Five Guys |
1,524 |
1,517 |
-7 |
-0.5 percent |
|
10 |
In-N-Out Burger |
418 |
435 |
+17 |
+4.1 percent |
|
11 |
Jack in the Box |
2,108 |
2,130 |
+22 |
+1.0 percent |
|
12 |
Popeyes |
3,145 |
3,179 |
+34 |
+1.1 percent |
|
13 |
Domino's |
6,971 |
7,105 |
+134 |
+1.9 percent |
|
14 |
Taco Bell |
8,098 |
8,241 |
+143 |
+1.8 percent |
|
15 |
Chick-fil-A |
3,236 |
3,413 |
+177 |
+5.5 percent |
|
16 |
Dunkin' |
9,843 |
10,026 |
+183 |
+1.9 percent |
|
17 |
McDonald's |
13,637 |
13,827 |
+190 |
+1.4 percent |
|
18 |
Chipotle |
3,687 |
4,046 |
+359 |
+9.7 percent |
Sources: Store locator data cross-referenced with Wayback Machine snapshots taken closest to May 2025 for each chain. Snapshot dates vary by chain. Current figures sourced from ScrapeHero and individual chain store locators, May 2026. *Jack in the Box "before" figure sourced from November 2025 snapshot; represents approximately six months of change rather than a full year.
What the data shows
Pizza Hut has lost more US locations than any other chain in this study over the past year, shedding 426 restaurants, a 6.4 percent contraction. Parent company Yum! Brands confirmed plans to close 250 underperforming US locations in the first half of 2026, with the data suggesting closures were already well underway before that announcement.
Wendy's is down 310 locations, a 5.2 percent decline. The company confirmed it would close up to 350 locations in the first half of 2026 as part of its "Project Fresh" turnaround plan, after US same-restaurant sales fell 5.6 percent for the full year and 11.3 percent in Q4 2025 alone.
Denny's, KFC and Subway round out the biggest losers by percentage, with the sit-down diner sector and legacy sandwich chains both showing sustained pressure.
Subway, despite remaining America's largest chain by location count, has shed 402 sites over the period, continuing a retreat from its 2015 peak of over 27,000 US restaurants.
Starbucks, Papa John's and Burger King are each down less than 1 percent in percentage terms, but the direction of travel is the same.
The contrast with the chains that are growing is stark. Chipotle added 359 US locations over the same period, a 9.7 percent increase, making it the fastest-growing chain in the dataset by both volume and percentage. Chick-fil-A grew by 177 locations, McDonald's by 190, and Dunkin' crossed the 10,000 US location milestone during the period.
How does the US compare to the UK?
A parallel study of the UK fast food market over the same period found Pizza Hut's contraction is even more severe in Britain, where the chain lost 55.9 percent of its restaurant estate compared to 6.4 percent in the US. Subway and KFC are also shrinking on both sides of the Atlantic, while McDonald's is growing in both markets.
To determine which American fast food chain has opened or closed the most stores in the 12-months (from May 2025 to May 2026), this study analysed each brand's store locator page and then compared it to the internet archive’s caches page. Chains where the data was unavailable were omitted from this study. If data for May 2025 was unavailable, the closed dated page was used. The fast food brands were then ranked in accordance with the overall number of locations for these time periods.
Cheese Obsession
Americans love cheese, and many see it as a good source of protein, according to a new survey conducted by Talker Research and commissioned by Undeniably Dairy, which represents American dairy farmers and importers, in honor of National Dairy Month, which kicks off with National Cheese Day on June 4. It explored how Americans consume cheese, their favorite types and the role it plays in their diets.
With 52 percent self-identifying as “cheese-obsessed” in the poll, Americans’ love of cheese is well established, but new research suggests it’s playing an even bigger role in how people think about food today.
The survey of 5,000 Americans found that while cheese remains a go-to for taste and comfort, many also see it as a practical way to add nutrients like protein to meals and snacks.
For many Americans, cheese is part of their daily routine, as 16 percent said they’re “constantly” eating cheese, while 61 percent consume it often or sometimes. Only 3 percent said they never eat cheese.
This survey also shows the versatility of cheese, with 82 percent of Americans saying it’s one of their overall favorite foods, 91 percent revealing it’s a favorite to add as a topping or ingredient to a meal, while 77 percent said it’s a snack-time favorite.
In addition, respondents reported adding cheese to everything from ramen to apple pie, and even more unexpected combinations like oatmeal, yogurt, curry and cereal.
These consumption habits mean cheese is also a staple when grocery shopping, with nearly three-quarters of Americans (73 percent) saying they always or often purchase it.
Preferences vary nationwide, but respondents’ love of cheese was clear. Among all states, Wyoming ranked highest for cheese enthusiasm (61 percent), followed by Illinois (59 percent), Alaska, Louisiana, and Oregon (each at 58 percent).
Generationally, younger Americans are more likely to say they are cheese enthusiasts than older groups (Gen Z 61 percent, millennials 57 percent, Gen X 54 percent, baby boomers 44 percent).
When it comes to favorites, cheddar leads the way (77 percent), followed by mozzarella (74 percent) and parmesan (64 percent). American cheese (63 percent) and cream cheese (59 percent) round out the top five.
Beyond taste and convenience, many Americans also associate cheese with protein. In fact, more than half of those who eat cheese (54 percent) seek it out as a source of protein.
This builds on an earlier survey from Undeniably Dairy and Talker Research that showed Americans are increasingly focused on getting enough protein in their diets for energy, strength and weight management.
This survey showed the other reasons people turn to cheese include taste (74 percent), comfort (51 percent), convenience (49 percent), and the way it helps make meals feel more satisfying or filling (46 percent).
Other points of interest include:
Most Cheese-Enthusiastic States
Wyoming (61 percent)
Illinois (59 percent)
Alaska (58 percent)
Louisiana (58 percent)
Oregon (58 percent)
Mississippi (57 percent)
Nebraska (57 percent)
Connecticut (56 percent)
Idaho (56 percent)
Maine (56 percent)
New Mexico (56 percent)
Americans’ Favorite Cheeses
Cheddar (77 percent)
Mozzarella (74 percent)
Parmesan (64 percent)
American (63 percent)
Cream cheese (59 percent)
Provolone (54 percent)
Monterey Jack (53 percent)
Colby (52 percent)
Pepper jack (52 percent)
Swiss (51 percent)
Restroom Conditions
The condition of a public restroom plays a powerful role in shaping how people perceive a business – and whether they choose to return. According to Bradley Company’s 2026 Healthy Handwashing Survey™, 68 percent of Americans say they are more likely to return – and spend more – at businesses with clean, well-maintained restrooms.
Cleanliness, reliable supplies, and ease of use directly influence user confidence, hygiene behavior, and customer loyalty – making restroom maintenance a critical driver of facility performance and long-term business value.
In fact, 86 percent of U.S. adults say they expect the quality of a business’s restrooms to reflect the quality of its goods and services. Additionally, 85 percent report having an overall negative impression of a facility with a dirty restroom, while 73 percent say an unclean or unpleasant restroom makes them think twice about returning to the establishment – reinforcing the direct connection between restroom quality and customer retention.
Cleanliness and Reliability Drive User Confidence
Cleanliness remains the top requested improvement in public restrooms and the most important factor influencing user confidence. Patrons expect clean, well-maintained fixtures, dry floors, and fully stocked supplies including soap, paper towels, and toilet paper.
When expectations are not met, users adjust their behavior. The survey found that 65 percent avoid touching restroom surfaces by using a paper towel or clothing, while almost 60 percent limit drinking liquids if they are going to public places in order to avoid using public restrooms.
Operational issues also directly affect hygiene practices. Among the top reasons people skip washing their hands are empty soap or paper towel dispensers and sinks that are dirty or out of order – highlighting how maintenance gaps can undermine both cleanliness and user confidence.
Facilities that consistently meet these expectations help reinforce trust, support proper hand hygiene, and create a more positive overall experience.
Restroom Conditions Shape First Impressions and Customer Decisions
Restroom quality plays a critical role early in the customer journey. The survey found that around 40 percent of Americans check a restroom before deciding whether to conduct business at a location – underscoring its influence on first impressions.
Poor restroom conditions can quickly erode trust, while clean, well-maintained facilities help reinforce a positive perception of the entire operation. For many users, the restroom serves as a visible indicator of how well a facility is managed overall.
Touchless Technology Builds Trust and Enhances the Experience
Touchless fixtures play a key role in strengthening user confidence by reducing shared surface contact and simplifying the handwashing process.
Nearly 80 percent of Americans say touchless fixtures are important in public restrooms, and a similar percentage say they improve the overall experience. Just as important, about 80 percent express confidence in their reliability and performance – reinforcing trust in these solutions.
As user expectations continue to evolve, delivering clean, reliable, and easy-to-maintain restrooms is no longer optional – it’s a fundamental requirement for building user confidence, strengthening brand perception, and supporting long-term business performance.
The annual Healthy Handwashing Survey from Bradley queried 1,020 American adults Jan. 5 -16, 2026. Conducted annually since 2009, the survey tracks attitudes and habits around handwashing, hygiene, and restroom perceptions in public facilities.