
MRM Research Roundup: Mid-October 2020 Edition
12 Min Read By MRM Staff
This edition of MRM Research Roundup features hot fall flavor trends, pandemic dining habits, National Coffee Day winners and what Gen Z audience wants.
What Customers Want
People are dning out, according to a study by The Manifest, a B2B research firm. The contradiction between people’s claimed fear about in-restaurant dining and actions is a likely result of access to outside dining options during the summer months. Local small businesses must prepare accordingly as winter months approach.
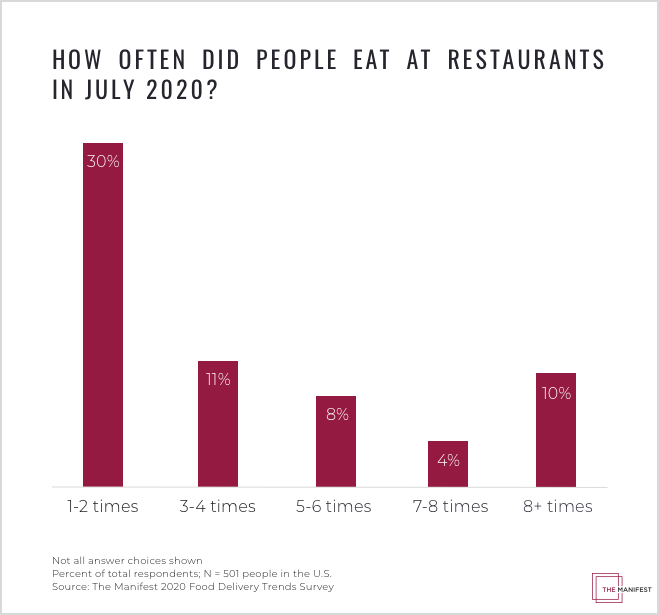
The Manifest surveyed 501 people about their food delivery and restaurant habits during COVID-19 and found that two-thirds of people ate in-person at a restaurant in July 2020..
Among the highlights:
- Almost two-thirds of people (63 percent) have dined in at a restaurant during COVID-19, indicating a demand for alternatives to eating at home.
- More than half of people (58 percent) feel uncomfortable eating at a restaurant during the pandemic, which means restaurants must invest in take-out and delivery options to stay open.
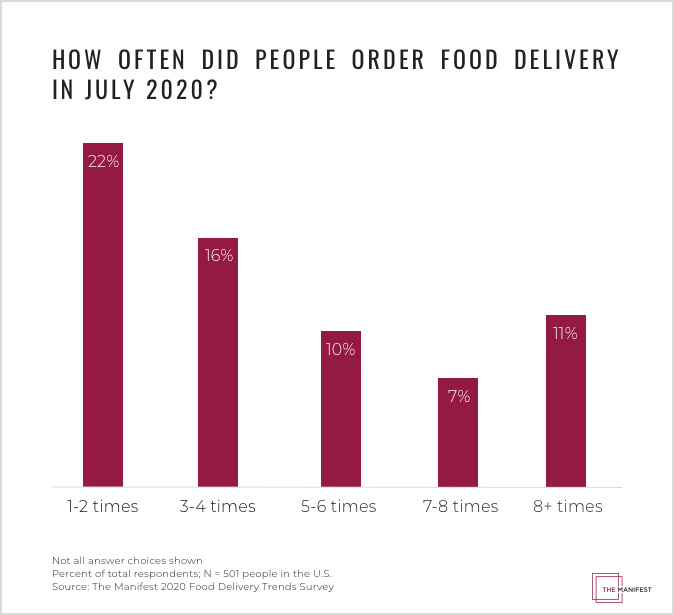
- Nearly two-thirds of people (65 percent) ordered food delivery in July 2020 as food options remain in-demand, but restaurant profit margins decrease with delivery.
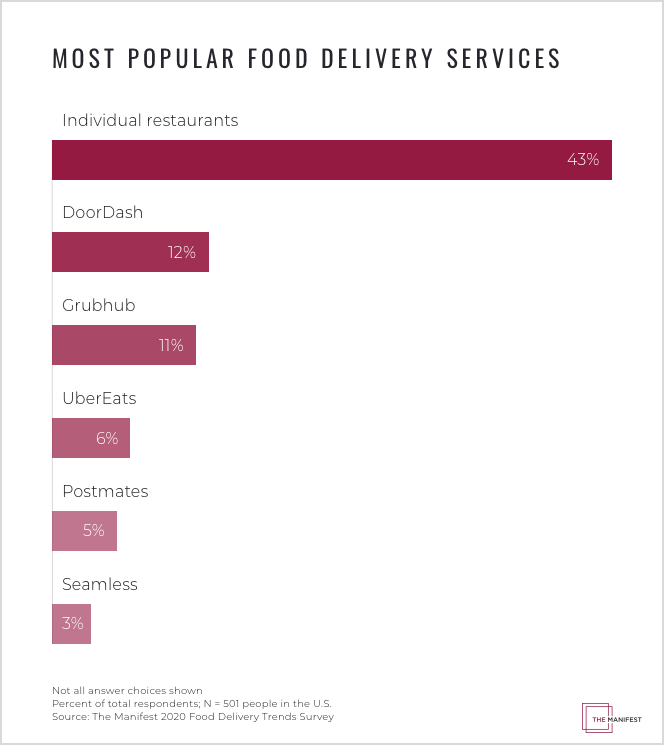
- Doordash is the most popular food delivery app with 12 percent of people using the app in July 2020. Still, people try to support local businesses as 43 percent order from individual restaurants rather than using a massive app platform.
- 30 percent of people have eaten at a restaurant one to two times during the lockdown.
- Almost half of people (43 percent) say they order delivery from individual restaurants rather than using a food delivery app.
Foot Traffic Study
The data experts from Zenreach, the walk-through marketing company, compared in-store foot traffic of various restaurant brands by breaking them into three categories:
SMB – Less than 10 locations
Mid-market – Less than 50 locations
Enterprise – More than 50 locations
What they found was that since the sink in mid-July, all segments have operated in tandem in a narrow band of 45-50 percent of normal, where walk-in rates (compared to previous year's in a normalized scale), have been virtually identical for SMB, Mid-market, and Enterprise-level restaurants.
Dunkin' v. Starbucks
September 29th was a good day for Dunkin Donuts, according to Placer.ai. National Coffee Day promotions drove visits that skyrocketed nearly 10.0 percent above 2019 levels for the equivalent Tuesday. Yet, compared to National Coffee Day 2019, which took place on a Sunday last year, visits were down 10.0 percent, still, a step forward considering the challenge of competing with a weekend especially in this unique environment. And the result actually buoyed the entire week with visits down just 13.9 percent year over year the week beginning September 28th, compared to being down 21.1 percent and 18.8 percent the two weeks prior.
Starbucks, on the other hand, did not see an equally large jump. Visits for the brand were down 23.0 percent year over year that Tuesday compared to the same day in 2019, and down 37.9 percent compared to National Coffee Day’s Sunday appearance last year. The latter number clearly shows the power that Starbucks receives on normal weekends. Yet, even these numbers were good enough to shrink the gap in weekly visits compared to the weeks prior. Starbucks saw visits the week of September 28th that were down 19.8 percent, an improvement on the three weeks prior that averaged declines of over 26.5 percent.
Food Service Orders Begin to Rebound
While restaurants, cafeterias, and retail food purveyors have been failing at double the normal rates, the survivors have seen a significant recovery, according to data from MarketMan. The data, compiled from more than 4,000 restaurants in the United States, indicate a significant and steady rebound since suppliers saw orders plummet by 70 percent in February 2020.
“After 20 percent of restaurants fell victim to the COVID-19 pandemic, and restaurant purchases were at 30 percent in February, we saw an impressive recovery, back to 80 percent of normal supply dollar volume in September,” said Noam Wolf, co-founder and CEO of MarketMan. “However, the rebound still leaves problems to be solved on the supplier side – suppliers are serving fewer restaurants, with lower revenues to cover existing operating expenses.”
While some suppliers have been able to pivot by selling direct to consumers or specialty grocery stores, they still have significant overhead costs that affect their ability to compete in a tightening market.
“We have long been trying to streamline our operational costs, even before recent events,” said Desi Saran, Founder & CEO at Sweetberry Bowls. “Allowing our stores to order everything via mobile is something that’s saved tremendous time and allowed much more transparency over what is ordered and when. It provides the whole organization a really effective way to manage purchasing and price updates on a daily basis”
Biggest Fall Food and Drink Trends
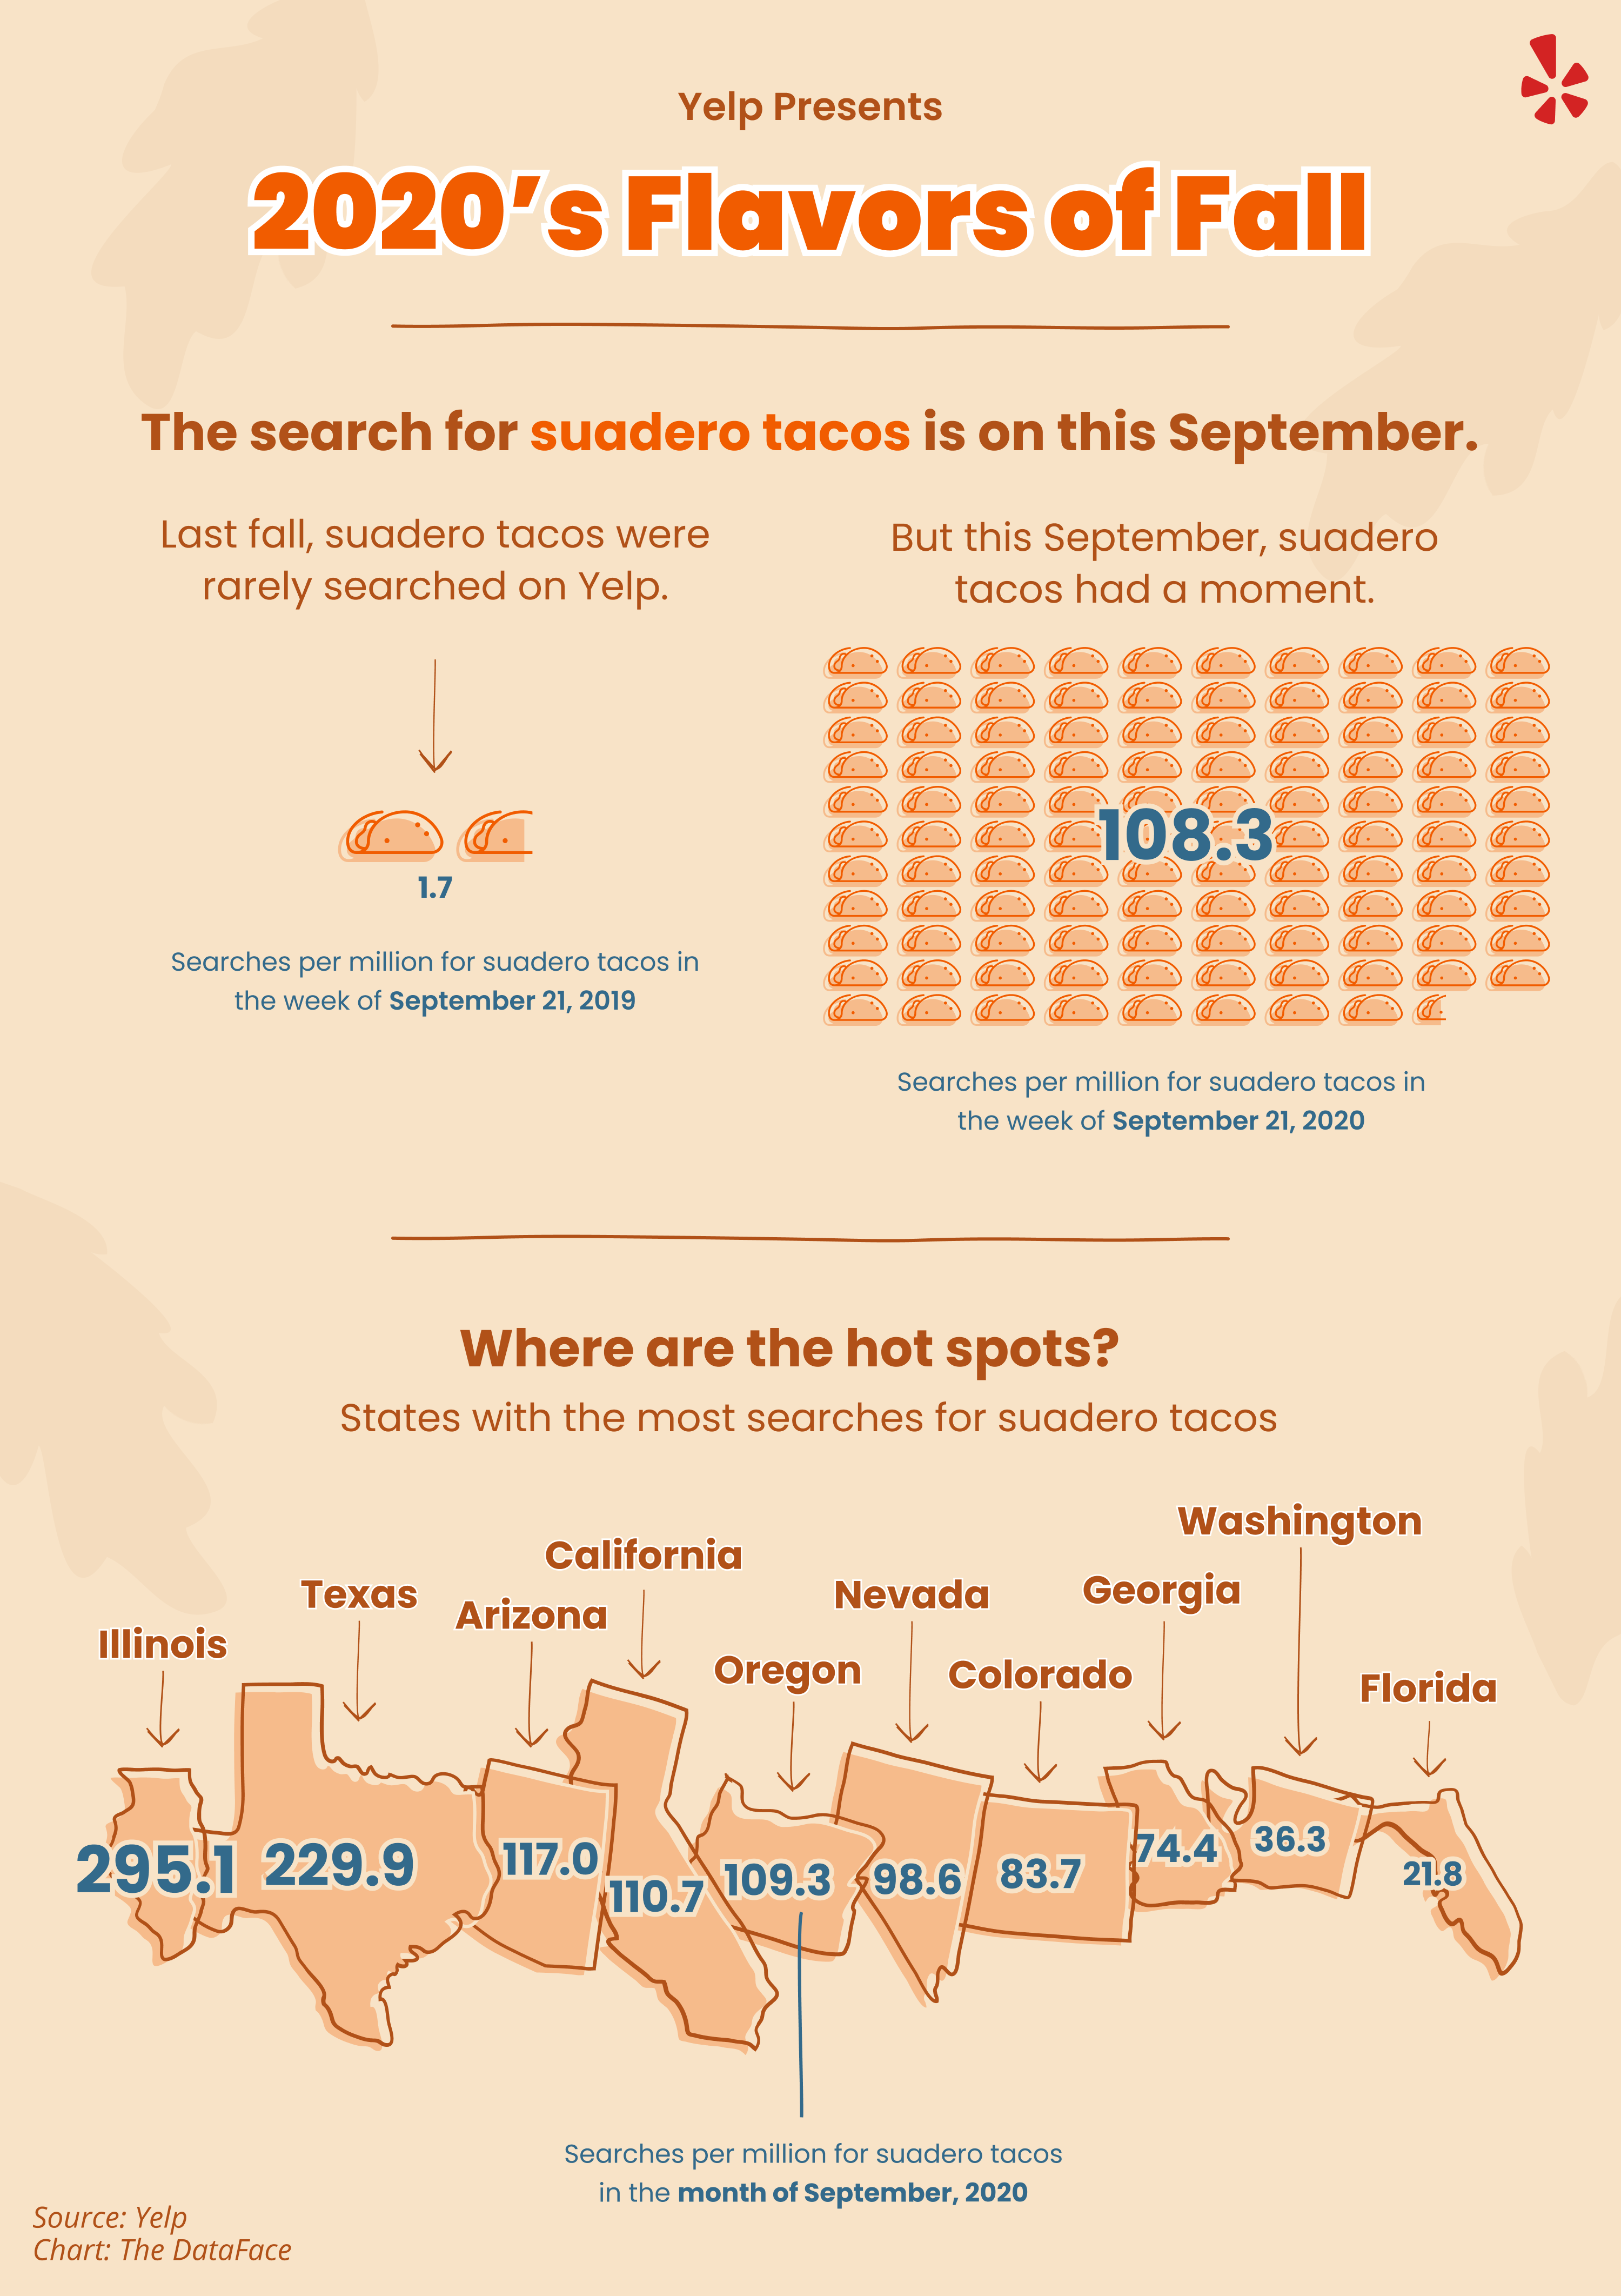
To celebrate the cooling temperatures, Yelp’s data science team took a dive into search data to understand what flavors everyone is enjoying this fall. To gather this data, we looked at searches in the restaurant and food categories during the week of September 21, 2020 and the week of September 21, 2019 and compared the year-over-year relative change in search share to help prepare our palettes for fall.
Pumpkin and pumpkin spice continue to dominate fall flavors. Pumpkin spice lattes (up 72 percent), pumpkin pie (up 66 percent) and pumpkin cheesecake (up 242 percent) are just a few of the ways people love to get their pumpkin fix. Other flavors and dishes users are enjoying right now include brown sugar boba (up 200 percent) and mochi (up 96 percent).
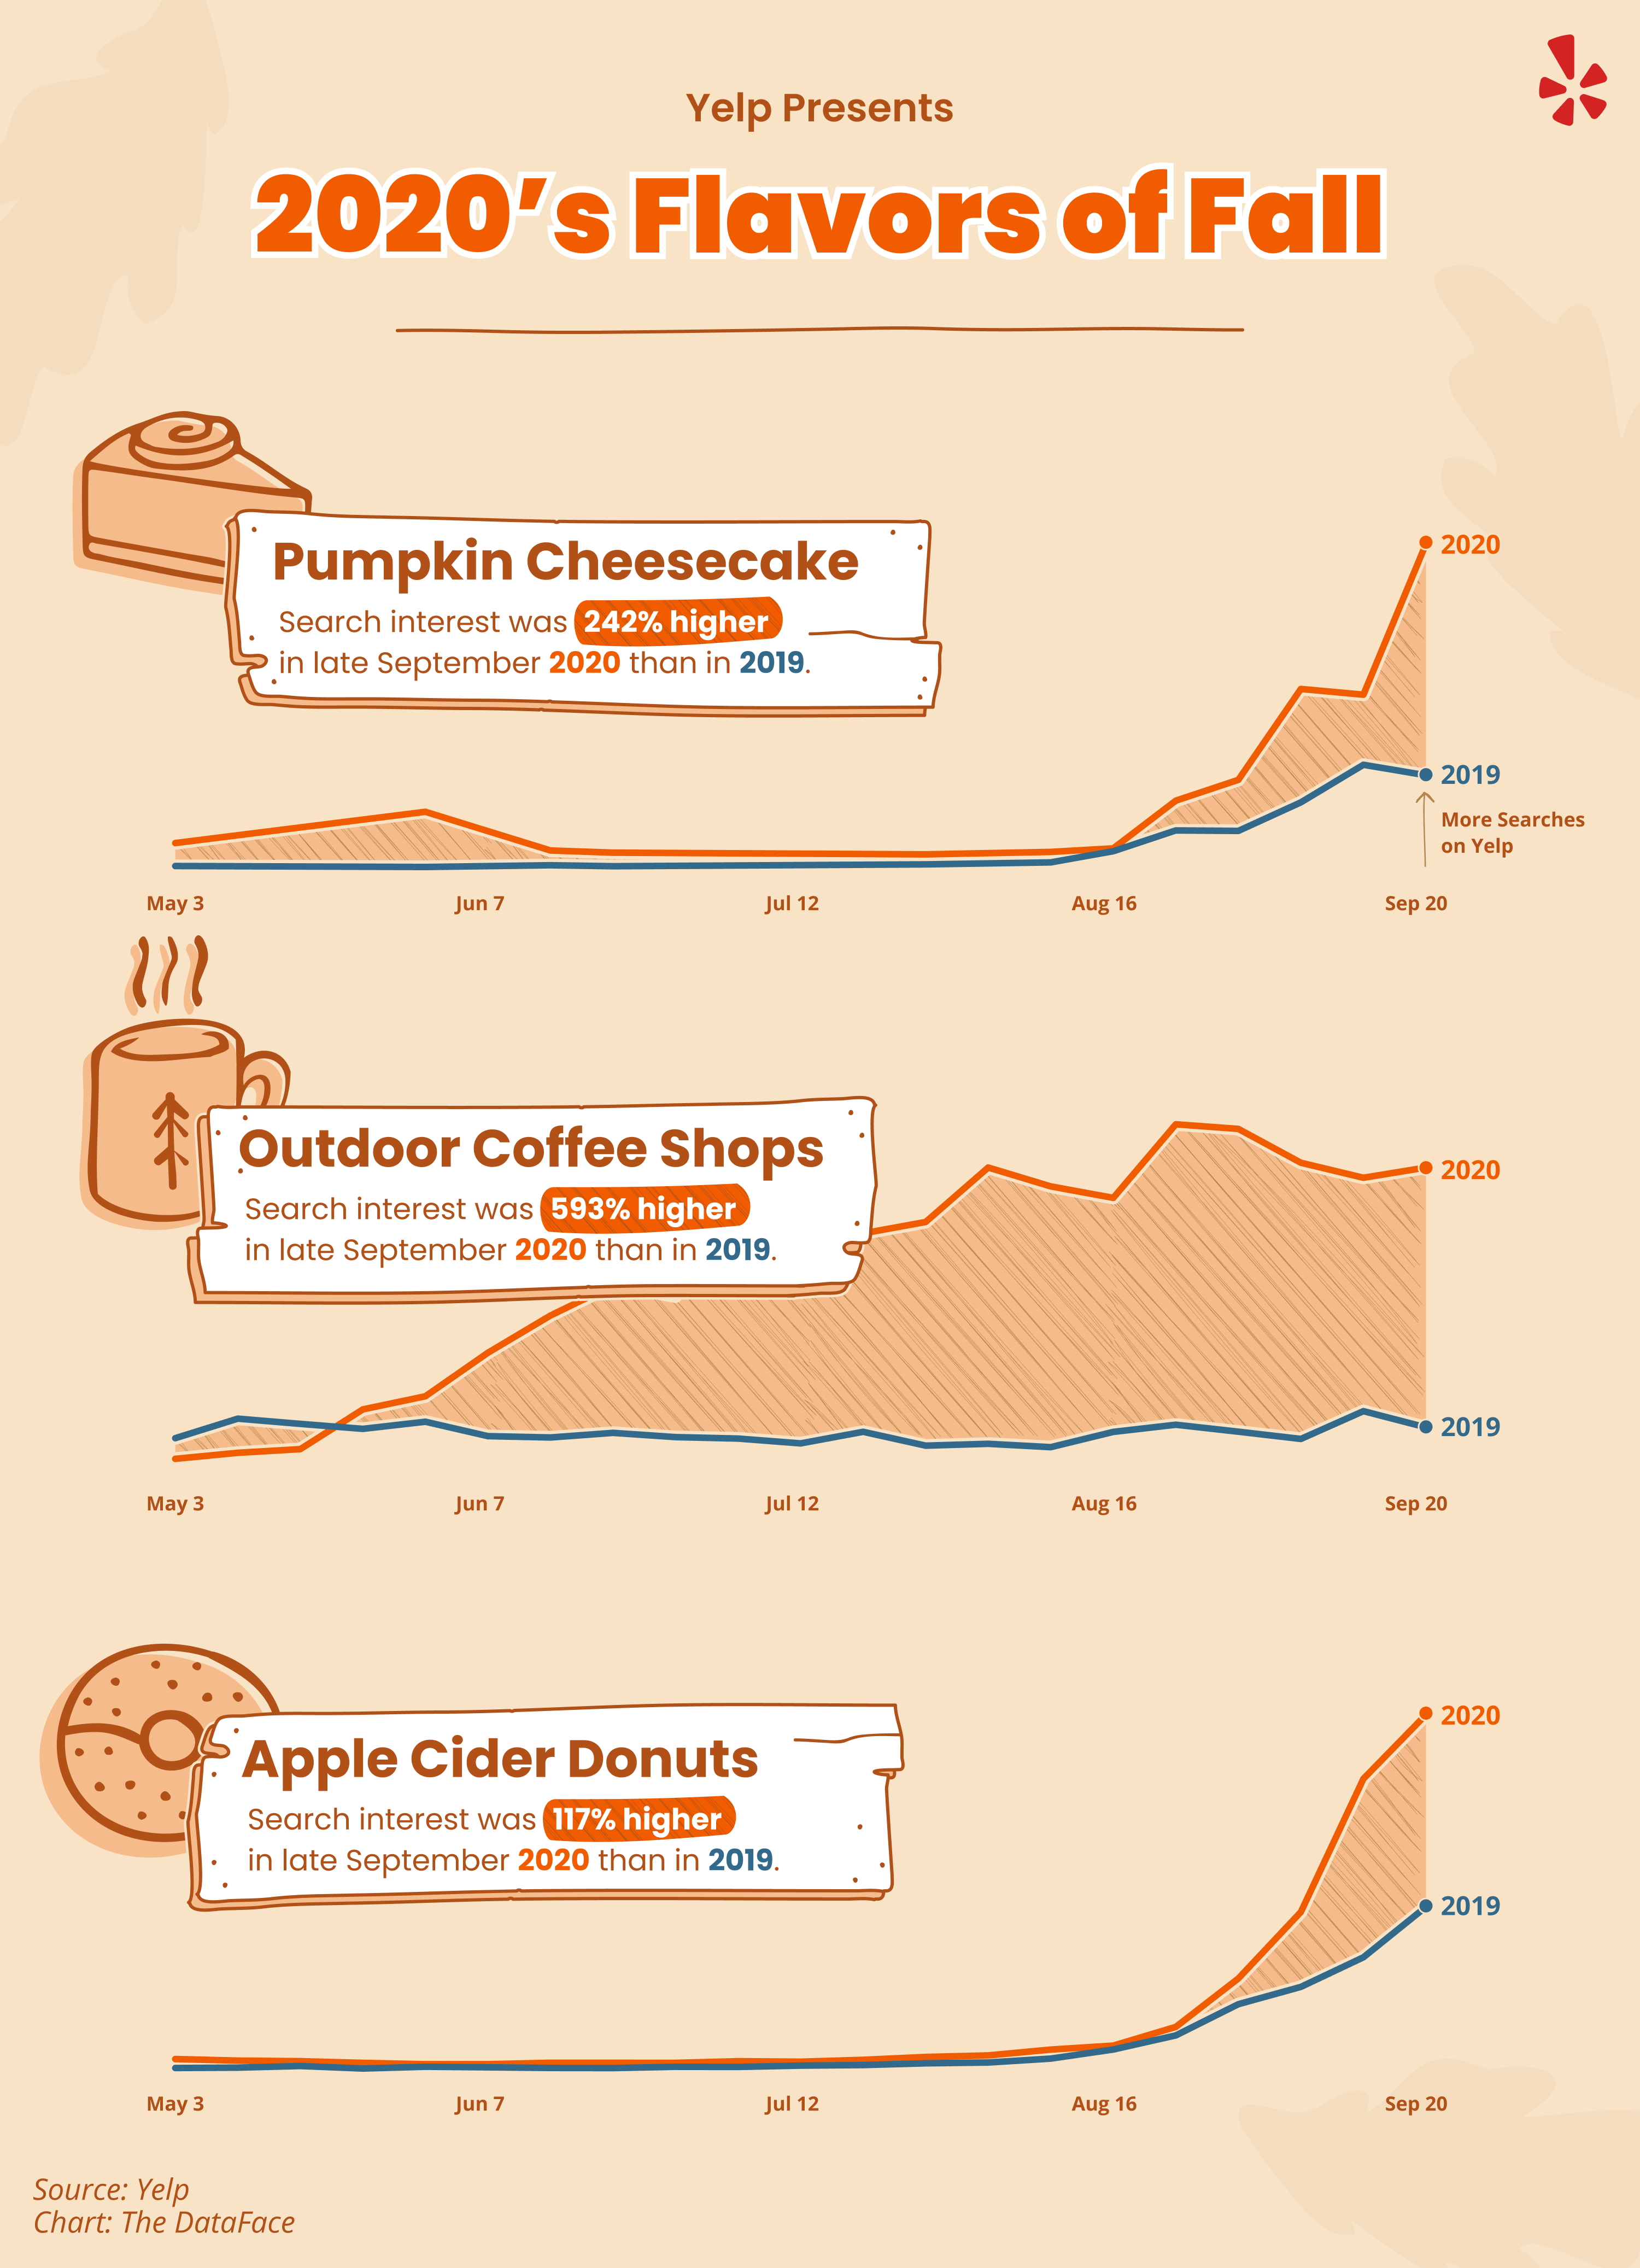
Searches are also up for apple cider donuts (up 117 percent) and apple picking (up 55 percent) as people look for socially-distanced outdoor activities. Check out our recent list of the top pumpkin patches across the US if you’re looking to make the most of the season. As people continue to navigate the pandemic and look for ways to support their favorite local businesses, we found searches for patio restaurants (up 1,396 percent), outdoor coffee shops (up 593 percent) and drive through coffee (up 141 percent) are on the rise while traditional dine-in foods, like Japanese BBQ (down 92 percent), seafood buffet (down 67 percent) and Mongolian grill (down 87 percent) are down this season.
While many people re-imagine their Oktoberfest plans, searches for beer types and breweries are down this year. Searches for craft beer stores, however, are up 26 percent, suggesting people hope to bring the Oktoberfest experience into their homes.
Suadero tacos are poised to be the dish on everyone’s plates this fall. Suadero tacos, recently the subject of an episode of Netflix’s Taco Chronicles, saw a 6,218 percent increase, compared to the same period last year. If you can’t make it to Austin’s Suerte to try Chef Fermín Núñez’s spin on the dish, be sure to check this list of top taco spots in the US for an option near you.
Nielsen CGA 2020 Hotel Beverage Study
According to the newly released 2020 Hotel Beverage Study from Nielsen CGA, 67 percent of all hotel users stated that COVID-19 will have or has had an impact on which hotels they consider staying in. This is echoed by the fact that 38 percent of consumers are likely to visit luxury hotels over the next 12 months, compared to only 29 percent of consumers typically visiting these hotels before COVID-19. This marked shift toward more premium hotels is likely due to the perceived level of cleanliness and attention given to COVID-19 secure practices.
Cleanliness Is a Major Concern, But the Menu Still Matters
Diving into consumer concerns, Nielsen CGA’s 2020 Hotel Beverage Study highlighted the utter importance of building consumer confidence around safety and cleanliness: COVID-19 secure hygiene practices have been revealed as the most important part of future / ‘new’ instances of eating and drinking in hotels, with 55 percent of consumers stating it as ‘very important’ to these occasions.
Though safety and consumer trust is at the forefront, traditional factors in enticing the hotel visitor remain the same: coming closely behind cleanliness is the quality of food and drink options, with 43 percent citing it as ‘very important.’ Despite the challenges they face around logistics, sanitization and safe practices, Nielsen CGA’s study highlights that hotels should not compromise on food and drink, as they still have a significant impact on consumer decision-making.
Amenities – Key Areas to Develop a Strong Offering
With social distancing measures and some hotel bar / restaurant restrictions in place, Nielsen CGA’s study also suggests that hotel visitors will increasingly use hotel amenities that require little to no human contact.
These include the use of the grab-and-go kiosk (which 42 percent of hotel visitors say they use), as well as room service (37 percent) and the mini bar (36 percent)–all higher figures vs. pre-COVID-19. For drinks suppliers (and hoteliers and chains), this suggests new opportunities to improve the drinks offering in these lesser developed areas
Chain-Specific Data to Aid Hotels and Suppliers in Recovery
Based on a nationally representative survey of 5,000 consumers, Nielsen CGA’s 2020 Hotel Beverage Study drills down to banner-level specifics, including what drinks brands and categories consumers are drinking in 37 of the biggest hotel brands in the U.S. As a key factor in getting hotel visitors to return, the findings also reveal specifically how confident hotel visitors are in returning to each of these 37 chains as we head into 2021.
For beverage suppliers, Nielsen CGA’s insights around drinks brand consumption also reveal how aligned specific brand drinkers are with each hotel chain, empowering them with fact-based selling stories to keep and gain menu listings during a time when hotels are likely to be cutting back–or at least changing–their drinks assortment.
“As many major hotel chains now begin to adapt to the ‘next normal’ and start up RFPs again with major suppliers and distributors, we felt this was an appropriate time to look into what is truly going on in this important channel," said Matthew Crompton, Client Solutions Director at Nielsen CGA. "With drink assortment being refined and often reduced in traditional consumption zones, such as bars and restaurants, a greater understanding of the opportunities in other areas (e.g. grab-and-go) is needed. The channel is still facing stiff challenges with international and business travel massively reduced, so hotel groups really need to understand what local and domestic visitors need from their stays. More than ever, hotel groups need robust evidence for the important assortment and pricing decisions they are making, and the suppliers who can offer these tailored, fact-based insights will be the winners now and beyond this challenging period.”
Taking Stock with Teens
Piper Sandler Companies completed its 40th semi-annual Taking Stock With Teens® survey in partnership with DECA. This survey highlights discretionary spending trends and brand preferences from 9,800 teens across 48 U.S. states with an average age of 15.8 years. Generation Z, which contributes approximately $830 billion to U.S. retail sales annually*, represents an influential consumer group where wallet size and allocation provide a proxy for category interest.
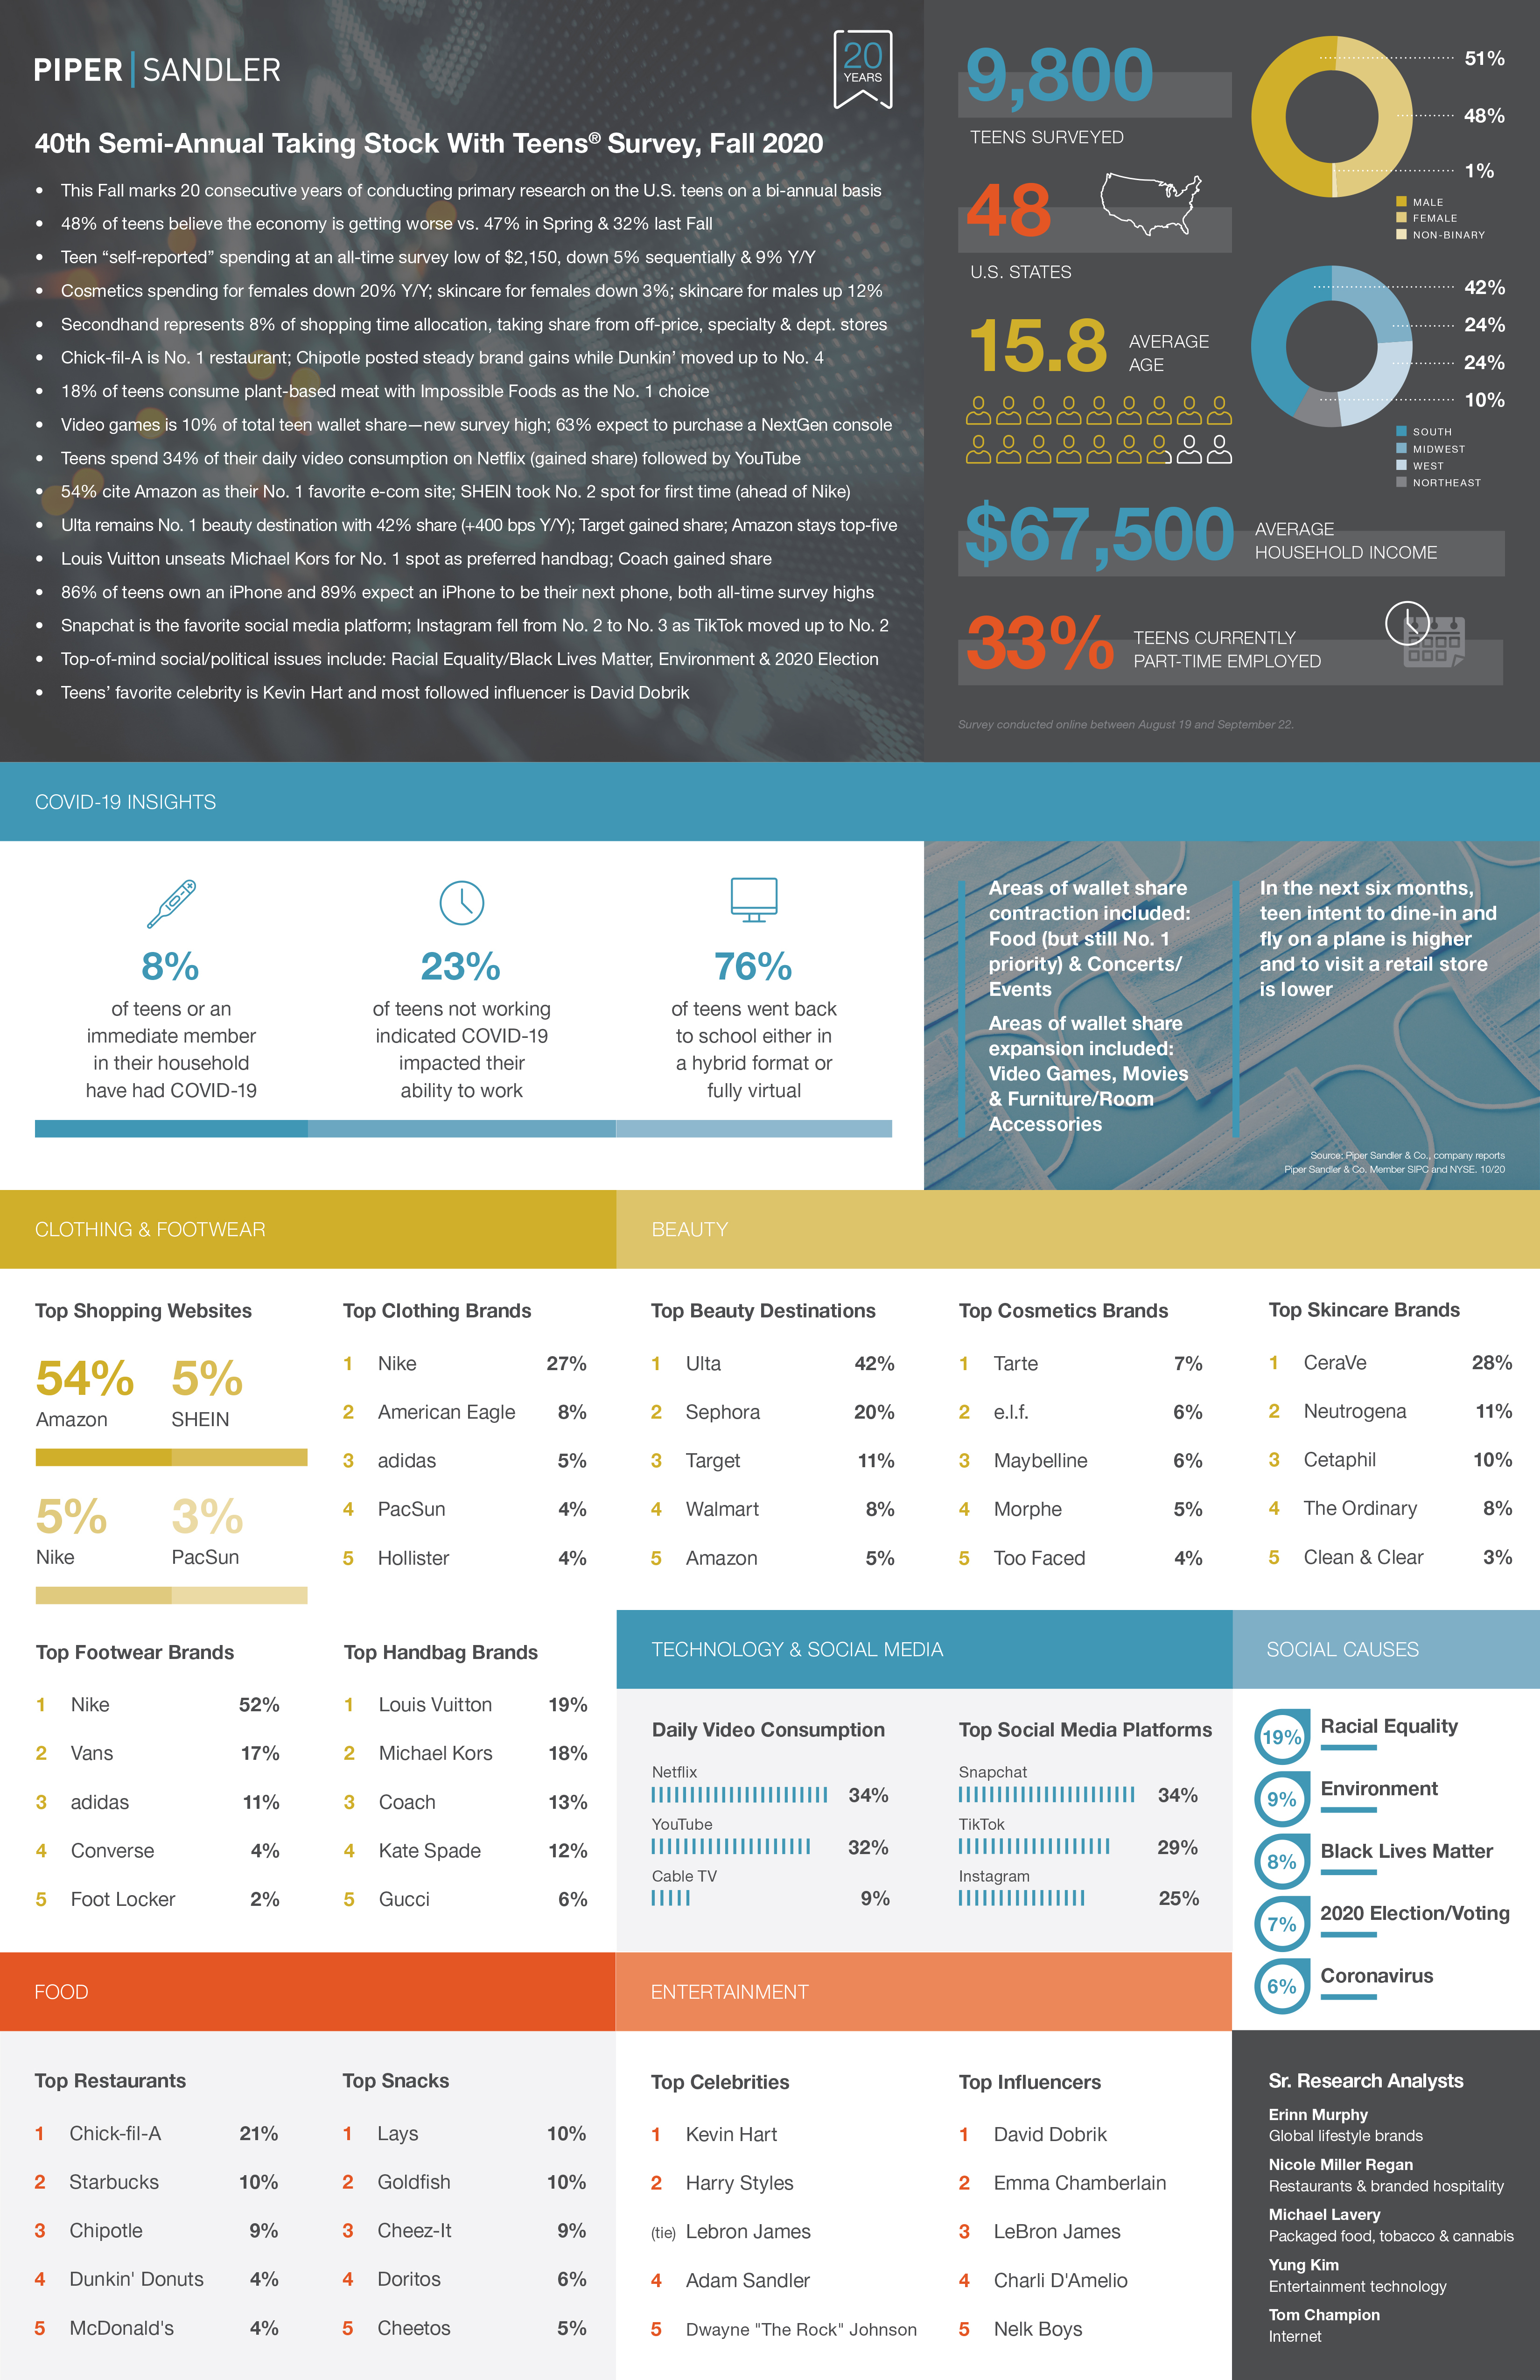
This year’s Fall 2020 survey was impacted by the COVID-19 pandemic. The survey was conducted from August 19 to September 22; 76 percent of teens have returned to school in either a hybrid format or fully virtual this Fall. We received the highest amount of responses from the South at 42 percent of the mix and 10 percent of the responses from the Northeast—similar to Spring 2020.
“Our Fall survey gave rise to some fascinating takeaways as consumers are adjusting to a new normal—47 percent of students came back to school virtually this year and another 29 percent of our respondents are back-in-school in a hybrid format. While we are not surprised that overall teen spending was down again given the economic backdrop, we are seeing wallet share priorities change including increased share for video games & furniture/room accessories and decreased share for food & concerts/events.
“TikTok, now the No. 2 preferred social media platform behind Snapchat, is fuelling brands like e.l.f. & CeraVe which both hit new survey highs while trends like “5-inch shorts” are on the rise among males. Pinterest also gained share among teens as they look for creative outlets & DIY trends to spend their time. SHEIN made notable gains in our survey as a preferred apparel brand & website.
“One distinguishing feature of GenZ is that they are a generation that cares about social justice. Racial Equality/Black Lives Matter and the Environment are their top current issues. With Environment at the forefront of their minds, we are seeing an uptick of teens “thrifting” or shopping secondhand. We believe this will be a very important trend to watch in the future,” said Erinn Murphy, Piper Sandler senior research analyst.
Brand Preferences
- Chick-fil-A remains No. 1 restaurant; Chipotle gains share & Dunkin’ Donuts moves up to No. 4
- 18 percent of teens consume plant-based meat with Impossible Foods as the No. 1 choice
- Lays is most preferred snack brand among teens
- Ulta maintains No. 1 preferred beauty destination against Sephora for fourth survey in a row
- e.l.f. climbs to the No. 2 cosmetics brand from No. 4 last year—a new survey high
- CeraVe climbs to No. 1 skincare brand at a staggering 28 percent share, surpassing Neutrogena
- Teens spend 34 percent of their daily video consumption on Netflix, followed by YouTube
- 86 percent of teens own an iPhone and 89 percent expect an iPhone to be their next phone, both new all-time survey highs
The Piper Sandler Taking Stock With Teens® survey is a semi-annual research project that gathers input from 9,800 teens with an average age of 15.8 years. Discretionary spending patterns, fashion trends, technology, and brand and media preferences are assessed through surveying a geographically diverse subset of high schools across the U.S. Since the project began in 2001, Piper Sandler has surveyed more than 194,800 teens and collected over 48.2 million data points on teen spending.
Restroom Cleanliness
Americans are going out into the world less often, and they’re also going less frequently when they are out. In fact, because of COVID-19 they’re planning their shopping trips specifically around the call of nature in order to avoid public restrooms. Big Red Rooster, a JLL company, partnered with ENGINE Insights, the research and analytics division of ENGINE, and surveyed 1,000 representative U.S. adults in September 2020 about what they expect of the post-COVID public restroom.
“Consumers are constantly thinking about safety,” said Emily Albright Miller, Vice President of Strategy at Big Red Rooster. “Especially when it comes to the cleanliness of public restrooms. Clear communication surrounding cleaning protocols, including visible, consistent time stamps of the last clean can help consumers feel safe—which could have a direct impact on whether or not they choose to order another drink or browse another rack.”
The survey found:
- 98 percent of consumers believe restroom cleanliness is important
- 42 percent have used public restrooms significantly less than they did before the pandemic
- One-third have left a public restroom without using it due to lack of cleanliness
- 36 percent have planned shorter shopping trips to avoid using public restrooms
- Nine percent have used a portable toilet to avoid going into a public restroom
- 12 percent say they or a family member has urinated outdoors to avoid a public restroom
- 15 percent report holding their breath during their restroom trip
“As we enter into what is typically the busiest time of year for shopping and traveling, it is important for organizations to understand and adapt based on what consumers need to feel safe,” said David Albert, Managing Director, ENGINE Insights. “The less time people spend at a specific location, the less they will spend with that business. To avoid a negative impact on the bottom line, it is critical for brands to commit to the restroom amenities that help consumers feel safer in public restrooms.”
Food Authencity
A new study by SOMAR-certified market research and consulting firm’s opines food authenticity market to grow at a steady pace through 2030. Adoption will be driven by growing consumer focus on food safety and growing clean label trend. Study tracks food authenticity market in 20+ countries for the period 2020-2030.
According to the study, in recent years, access to pure and adulterant free foods has come under significant jeopardy. Widespread prevalence of food adulteration, mislabeling and undisclosed ingredient details have generated a massive furor amongst health conscious consumers as well as healthcare providers.
On an average, approximately 57 percent of the global population suffers from morbidities inflicted due to consumption of sub-standard and contaminated foodstuffs. Moreover, nearly 1/4th of the world’s food supply is adulterated annually. Realizing this, countries have taken proactive steps to mitigate the adverse effects of food adulteration.
Increasing consciousness among consumers has elevated the need for introducing clean-label, organic-based and naturally derived foods. Based on these developments, the global food authenticity market is all set to experience an impressive upsurge in the coming years.
Key Takeaways from Food Authenticity Market Report
- Global food authenticity market is likely to expand at a noteworthy CAGR in the forthcoming decade
- Asia-Pacific to emerge as the fastest expanding region for food authenticity testing, attributed to a large population base
- High incidence of meat consumption to provide traction to meat speciation authenticity tests
- Economically Motivated Adulterations (EMA) compelling governments to impose tough legislations to keep food adulteration in check
- PCR-based tests are expected to retain their popularity due to quick delivery of test results
- Processed foods testing is expected to acquire surging popularity due to high demand
“Vendors are capitalizing on the insufficient food testing infrastructure in developing economies to increase their market presence, thus opening up new revenue frontiers,” infers the report analyst.
COVID-19 Impact Insights
The COVID-19 pandemic presents an exceptional and unprecedented challenge for competent authorities with responsibilities for national food safety control systems. As consumers resort to consuming health and immunity boosting foods, demand for clean-label products is rising exponentially.
While nationwide lockdowns and social distancing measures have limited laboratory testing capacities, it has not fully ceased as chances of food adulteration are maximum during this time period. Unscrupulous traders are prowling the market with the objective of flooding it with adulterated food products.
Thus, leading players have revised growth forecasts to demonstrate that the market is expected to remain afloat albeit at lower projections and reduced revenue margins. Growth is expected to be restored to normal levels in the post-pandemic scenario, once lockdowns are eased following a decline in infection rates.
Cutlery Market
The cutlery market is anticipated to reach a valuation of over US$ 10 billion by 2030, with the growth rate pegged at over 6 percent from 2020 to 2030. The market has seen multiple changes in recent years, with increasing bans on single-use plastic cutlery. The trend of bans is highly evident in countries such as the United States, Canada and Germany, among others. These bans related to the cutlery market have led to changing preferences of OEM suppliers and commercial end users such as HoReCa. The market is expected to experience fluctuations in demand during the short term, but innovations by manufacturers are expected to reset the lifecycle of multiple products in the cutlery market space.
Key Takeaways from Cutlery Market Study
North America accounted for a share of nearly 30 percent in the global cutlery market in 2019. High preference of food delivery and dependence of consumers on external food services have created huge demand for disposable cutlery in the region.
The market in South Asia and Oceania is expected to portray the highest growth rate over the forecast period, and grow 2.1X by 2030 over the value in 2020.
Based on end use, institutional food services are expected to experience highest growth during the forecast period.
In terms of product, spoons are expected to witness moderate growth during the forecast period in the cutlery market.
In terms of sales channel, the direct sales segment accounts for a higher share in the cutlery market, and is expected to grow 1.8X by 2030.
The COVID-19 crisis has been slightly detrimental in the early stages to the growth of the cutlery market. However, the market is expected to experience a positive effect hereafter.
“Disposable cutlery is expected to lose significant share during the forecast period, which is expected to be gained by reusable cutlery. Focus on wood and other biodegradable materials is expected to be high in the reusable cutlery segment,” says report analyst.
Companies Banking on Brand Presence in Cutlery Market
Players in the cutlery market have been banking on their established distribution channels and brand presence in their domestic markets. Companies have been increasing their investments in third-party e-Commerce channels in recent years. They have also been collaborating with brick and mortar channels and partnering with companies such as Bath & Body Works, Heineken, Newell, and Walmart, among others, to increase their presence in the cutlery market space.