
MRM Research Roundup … Mid-October 2018 Edition
41 Min Read By MRM Staff
Modern Restaurant Management (MRM) magazine's "According to a recent study/survey …" column is being rebranded as MRM Research Roundup. This time, we feature top pizza cities, top cities for vegans and vegetarians, brand intimacy, retail's halo effect and the best places to eat apple pie and for allergy-friendly dining.
How Strong is the Restaurant Industry Really?
The third quarter of 2018 was relatively strong for the restaurant industry. Same-store sales were up 1.2 percent in September, the fourth consecutive month of growth. The industry had not experienced a quarter in which all months had positive sales since the fourth quarter of 2015. Sales for the third quarter were also up 1.2 percent, the highest since the third quarter of 2015. These insights come from TDn2K’s Black Box Intelligence™ data, based on weekly sales from over 30,000+ locations representing 170+ brands and nearly $71 billion in annual sales.
“Top line numbers were good for the latest quarter and months,” commented Victor Fernandez, vice president of insights and knowledge for TDn2K, “but the question is ‘how strong is the restaurant industry really?’ The data suggests restaurants are doing much better, but the industry is still struggling with significant challenges.”
The Weather Effect
Restaurant sales benefited from strong tailwinds in the form of easy comparisons to soft sales last year when major storms hit Texas and Florida. In fact, the third quarter of 2017 is tied for weakest sales performance in the last three years. In 2017 both Florida and Texas reported quarterly sales below -3.0 percent.
“It is easy to attribute the current strength to the bad weather that impacted some of the largest economies in the country last year,” continued Fernandez. “However, the fact that all regions posted positive sales in the third quarter of 2018 (the first time this has happened in any quarter over the last three years) and six of the eleven regions achieved growth of 1.0 percent or better suggests that the relative strength goes beyond just the easy comparisons in the hurricane areas. Excluding Texas and Florida, the quarter would have been 1.0 percent vs. the 1.2 percent reported.”
Restaurants Seem Incapable of Stopping Guest Erosion
Even if the sales occasionally climb into positive territory and hint at a true recovery, the reality is that the industry continues to lose guests. It is only through rising guest checks that restaurants are able to post top line growth.
Traffic declined -1.4 percent in September and dipped -1.2 percent for the third quarter of 2018. The fact that this is the best traffic quarter in the last three years highlights the magnitude of the continued marketshare battle for guest traffic.
The Two Year View is Still Troubling, But Some Signs of Improvement Appear
In the third quarter of 2018, sales were down -1.2 percent compared with the same quarter two years ago. Even more troubling, same-store traffic declined -5.7 percent over that same two year period.
As disappointing as these results may be, there are signs of improvement. Two-year sales performance averaged -1.0 percent over the last two quarters, a slight improvement from the concerning -2.5 percent for the previous four-quarter period.
Warning Signs From the Economy, Despite Current Strength
“The economic expansion is the broadest-based in nearly two decades,” explained Joel Naroff, president of Naroff Economic Advisors and TDn2K economist. “Growth has moved from manufacturing and large corporations into the small business sector. Looking forward, though, there are warning signs.”
Firms seem intent on raising benefits, not wages, and household income is still growing at a disappointing pace. That should continue to restrain consumer spending. Rising energy costs are diverting funds into gasoline and utility purchases. A softening in the housing sector, which typically leads the economy, indicates that households are becoming more conservative. And the Fed has signaled that rates will likely rise through next year. Together, these trends imply that the retail battle for share of consumer wallets will only intensify in what is likely to be a more moderate growth environment.
Workforce Challenges Persist
The national unemployment rate dropped again in September and is currently at 3.7 percent. With the economy at full employment, recruiting and retaining employees remains a leading concern for operators. Adding to recruitment pressures is the continued growth in the number of restaurant positions. According to TDn2K’s People Report, the number of employees in the industry grew 2.0 percent year over year in August after increasing 1.7 percent the previous month.
However, August did hint at good news from a workforce perspective. Turnover for both hourly employees and restaurant managers decreased in August. After years of continual climbing, turnover rates in recent months are beginning to drop slightly. This trend, however, is not expected to reduce turnover rates enough for retention to lose its status as a critical issue haunting operators.
Wallace Doolin, chairman of TDn2K, notes “the evidence grows in our White Box Social Intelligence guest satisfaction data cross referenced with Black Box Intelligence sales and traffic data. There is one aspect of the restaurant experience that separates Top Box performing companies from the rest: the guest perception on service. Those are the same companies that we find in the People Report data that are successful at retaining their top talent and effective in staffing every shift”. Reducing historically high turnover rates and staffing for sales growth will likely be at the forefront of successful restaurant operators’ strategy discussions as they plan for next year.
Restaurant Tech Readiness
Restaurant-goers are encountering more technology when they visit fast casual and quick serve restaurants (QSRS), and they like what they’re seeing. Bypass, PYMNTS and Bank of America Merchant Services have previously indexed the innovators in restaurant tech in a Restaurant Readiness Index, and for the third edition, we turned our eyes on the guest experience. Examining how geography, demographics and other factors impact digital innovations’ availability and consumers’ attitudes toward them, we surveyed more than 5,000 consumers. We asked them how often, where and why they visited QSRs, as well as their engagement with a wide range of digital services and other innovations.
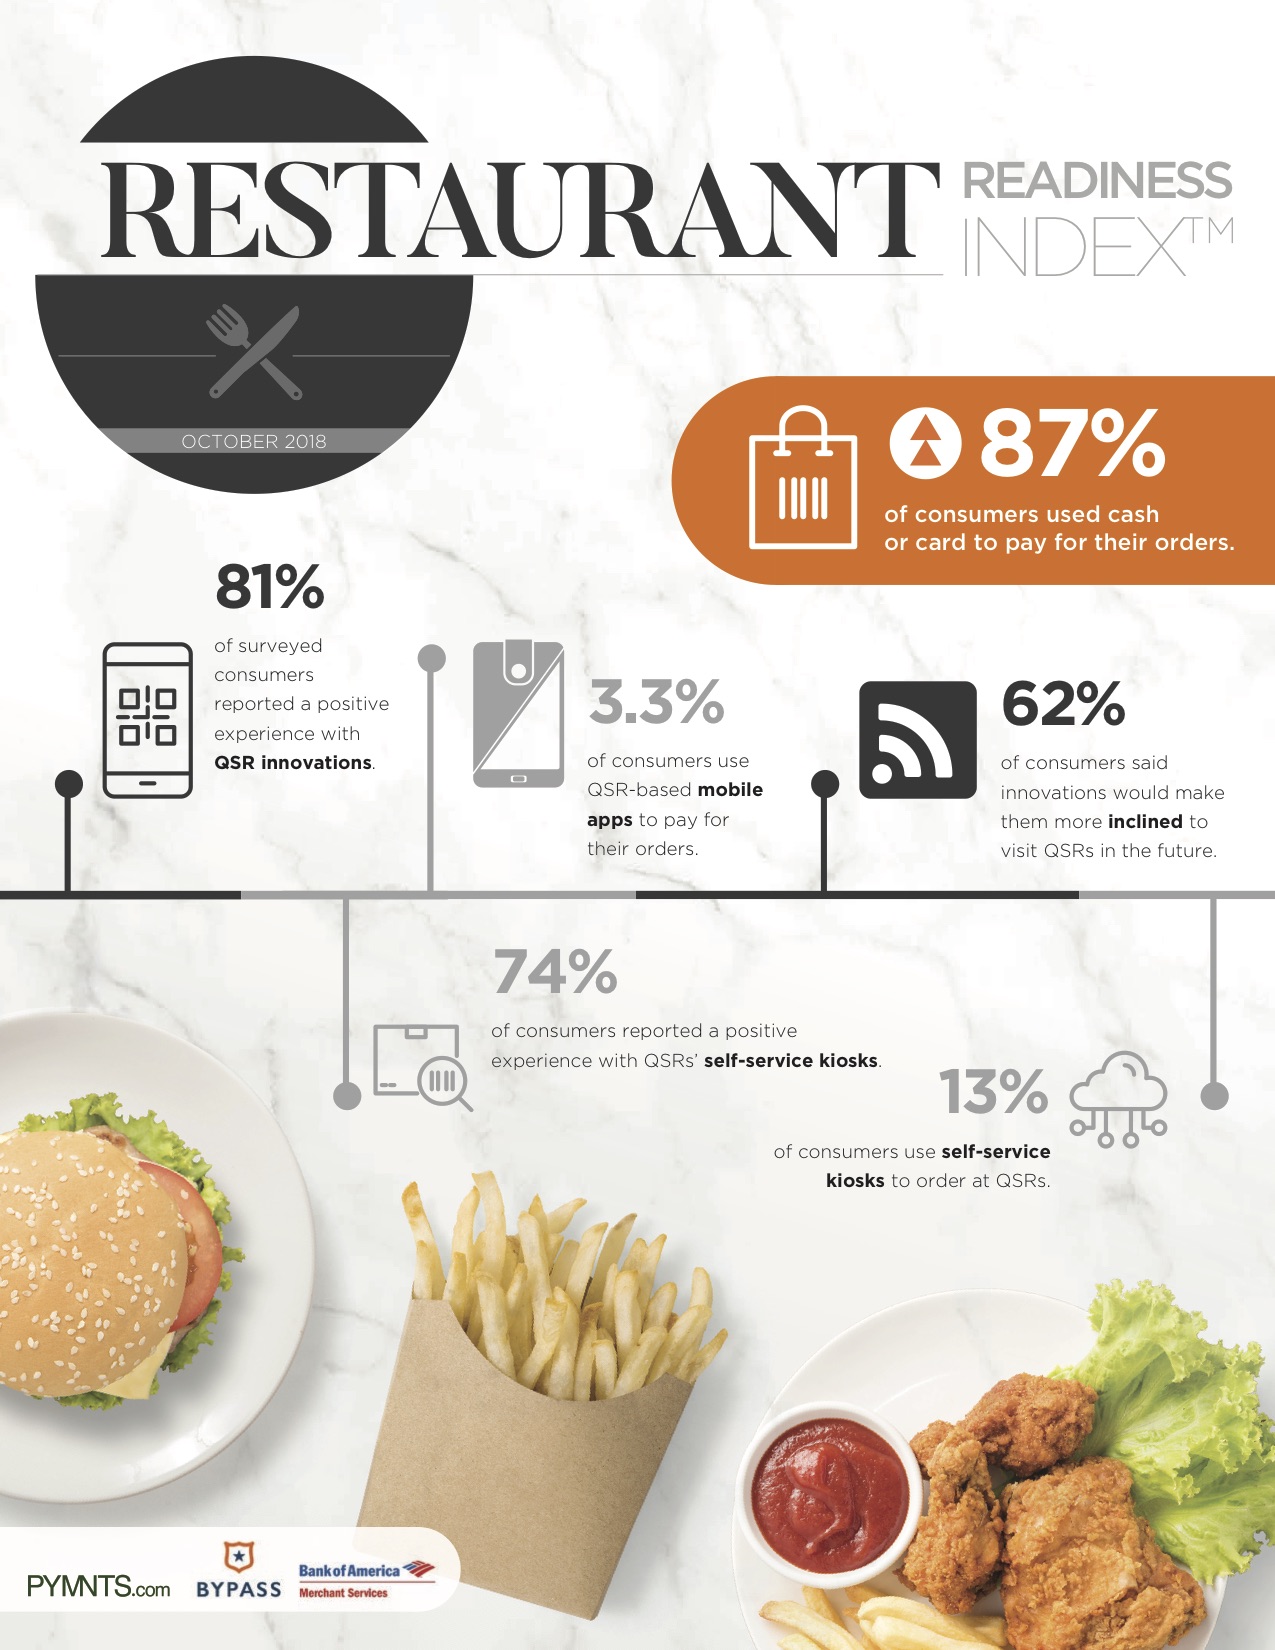
Technology’s been woven into the fabric of the QSR industry for decades, like McDonald’s pioneering Speedee Service System and milkshake Multimixer for truly fast food. And while the technology’s gotten much more advanced, customers care about the same things: 60 percent of consumers cite convenience and speed as the main reason they embrace new technologies.
“Consumer expectations were set outside of QSR when it comes to digital,” Carissa Ganelli, Subway’s Chief Digital Officer noted in the report. “The reason why it spilled over into QSR is because consumers expected to have one-click purchasing like Amazon, the ability to swipe left or swipe right like a Tinder, a robust loyalty program like a Sephora.”
Of course, adoption of that technology is varied, and so is awareness. For example, while 67 percent of customers who visited a QSR/fast casual recently used a loyalty program, 50 percent didn’t know if the one they most recently visited even had a program. And while we’ve found growth in the availability of some technologies, consumers have yet to warm up to things like self-service kiosks, which are only used by 13 percent of consumers. However, when we take a visitors of a specific restaurant, those numbers can vary drastically; 40 percent of Arby’s guests, for example, reported using a kiosk recently.
What we found overall though was that customers are clearly eager for innovation. The question remains whether innovators can muster the will — and the capital — to make the necessary investments.
Top Foodie Cities
With Oct. 16 being World Food Day and restaurant prices rising 2.8 percetn between July 2017 and July 2018, the personal-finance website WalletHub released its report on 2018’s Best Foodie Cities in America.
To determine the best and cheapest local foodie scenes, WalletHub compared more than 180 of the largest U.S. cities across 29 key metrics. The data set ranges from affordability and accessibility of high-quality restaurants to food festivals per capita to craft breweries and wineries per capita.
| Top 20 Foodie Cities in America | ||||
| 1 | Portland, OR | 11 | Atlanta, GA | |
| 2 | San Francisco, CA | 12 | Tampa, FL | |
| 3 | Miami, FL | 13 | Chicago, IL | |
| 4 | New York, NY | 14 | Denver, CO | |
| 5 | Los Angeles, CA | 15 | Washington, DC | |
| 6 | Orlando, FL | 16 | Sacramento, CA | |
| 7 | Las Vegas, NV | 17 | Philadelphia, PA | |
| 8 | Seattle, WA | 18 | Houston, TX | |
| 9 | San Diego, CA | 19 | Oakland, CA | |
| 10 | Austin, TX | 20 | Charleston, SC | |
Best vs. Worst
- New York has the most gourmet specialty-food stores (per square root of population), 1.3816, which is 46.1 times more than in West Valley City, Utah, the city with the fewest at 0.0300.
- New York, has the most restaurants (per square root of population), 7.58, which is 31.6 times more than in Peoria, Arizona, the city with the fewest at 0.24.
- Orlando, Florida, has the most ice cream and frozen yogurt shops (per square root of population), 0.3313, which is 21 times more than in Lewiston city, Maine, the city with the fewest at 0.0158.
- Santa Rosa, California, has the highest ratio of full-service restaurants to fast-food establishments, 1.80, which is 3.5 times higher than in Jackson, Mississippi, the city with the lowest at 0.51.
To view the full report, click here.
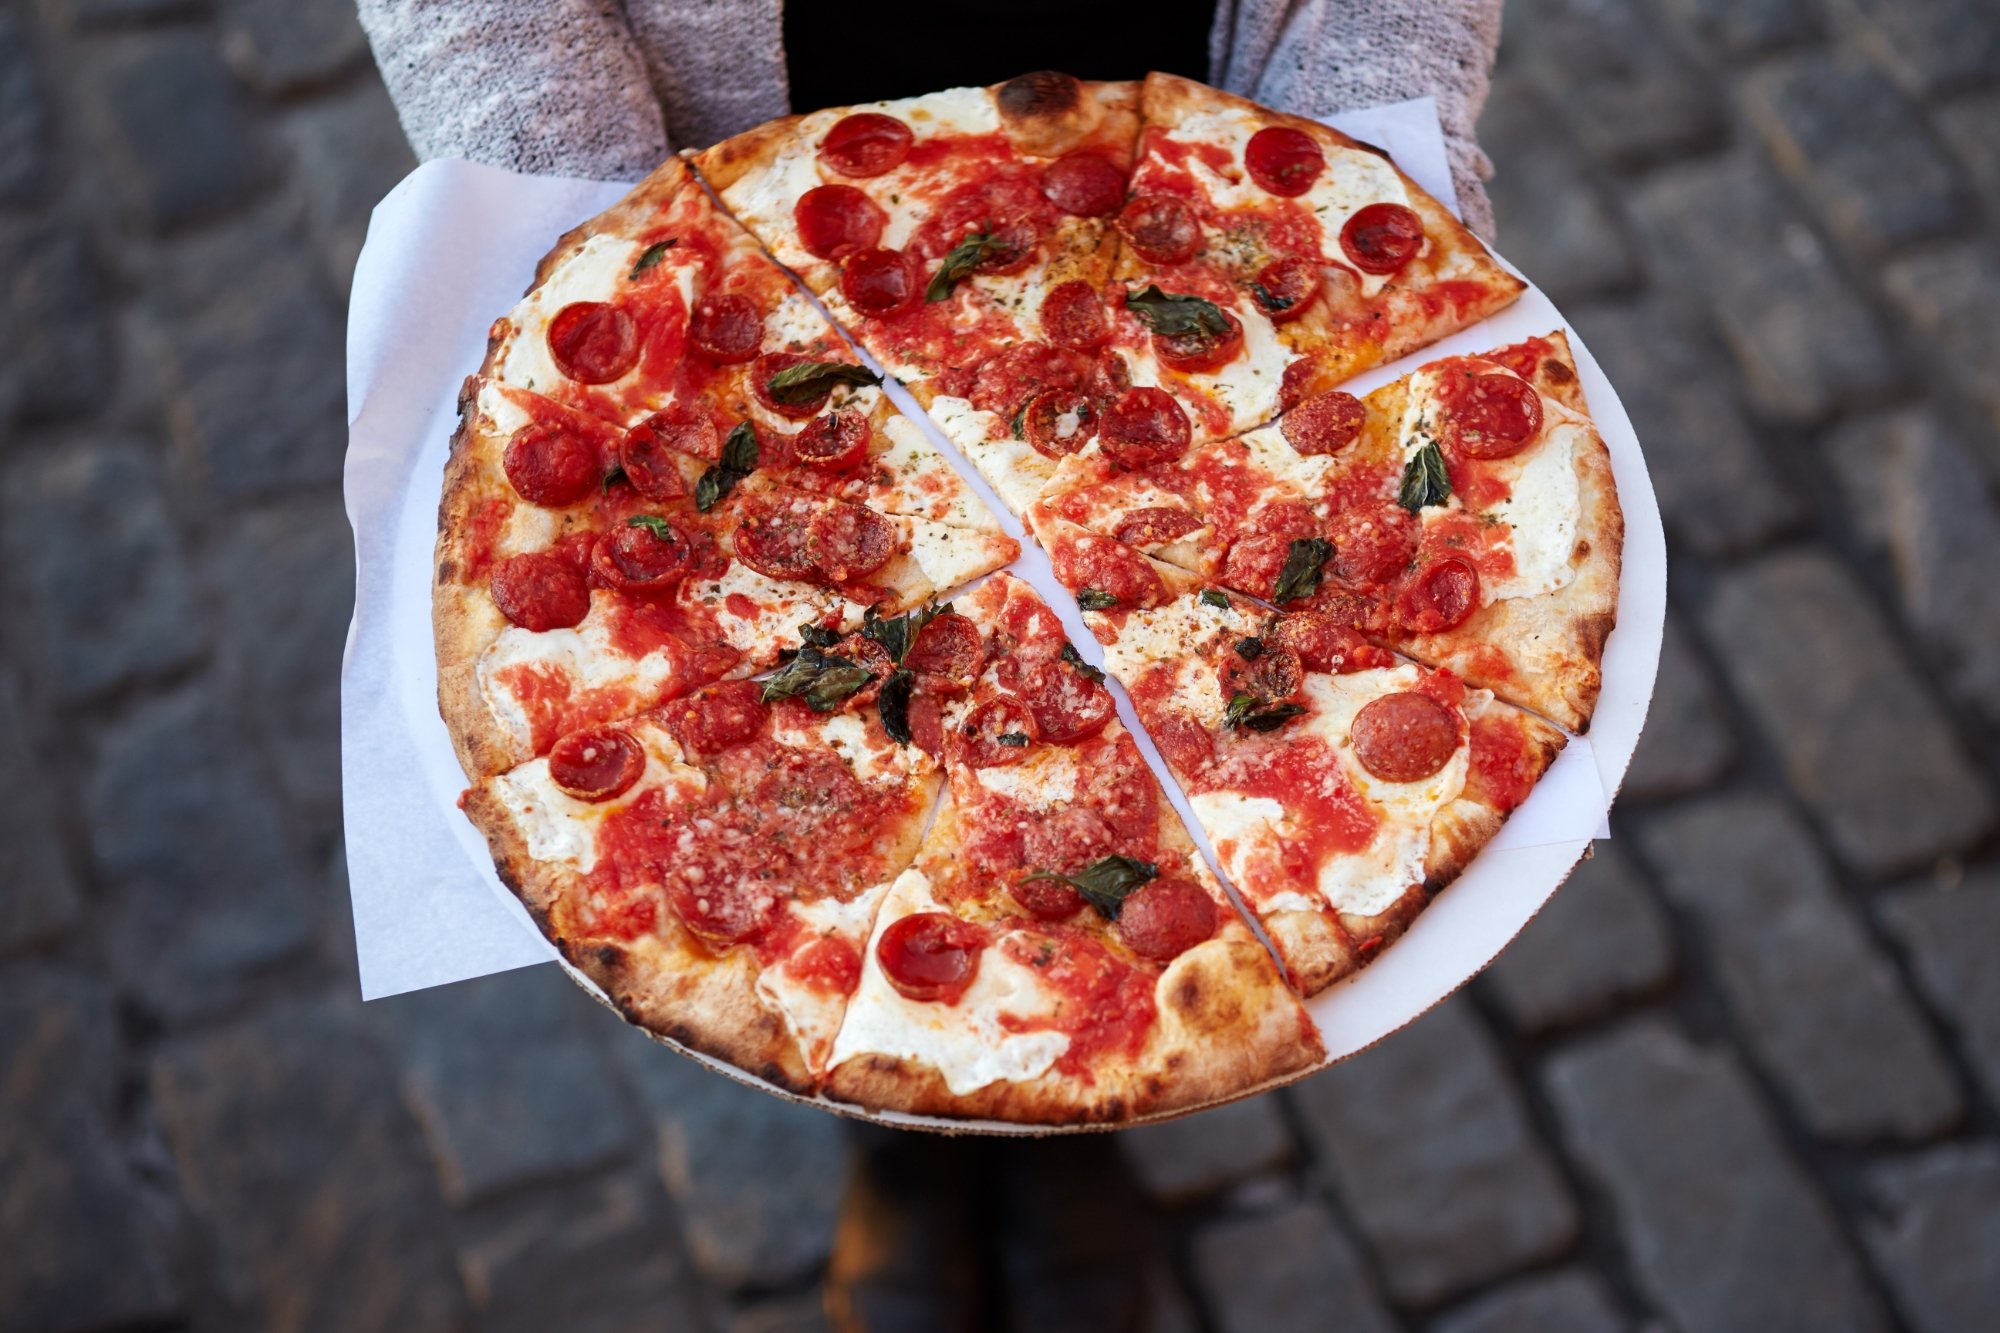
Top Pizzerias and Pizza Cities
TripAdvisor® announced the top restaurants and cities for pizza in the U.S., based on millions of reviews and opinions from TripAdvisor diners. The top pizzerias and cities for pizza were determined by taking into account the quality and quantity of reviews and great pizza reviews, with more weight to reviews from the past year.
“Everyone wants to know where to get the best slice and after sinking our teeth into TripAdvisor data, we delivered the top pizzerias and cities for pizza across the country,” said Brooke Ferencsik, senior director of communications for TripAdvisor. “A list with a lot of flavor, it’s topped by some iconic destinations for pizza along with some surprising tastes in Nashville and Anchorage. The common ingredient in all of these spots is an exceptionally delicious slice.”
Top 10 U.S. Pizza Restaurants
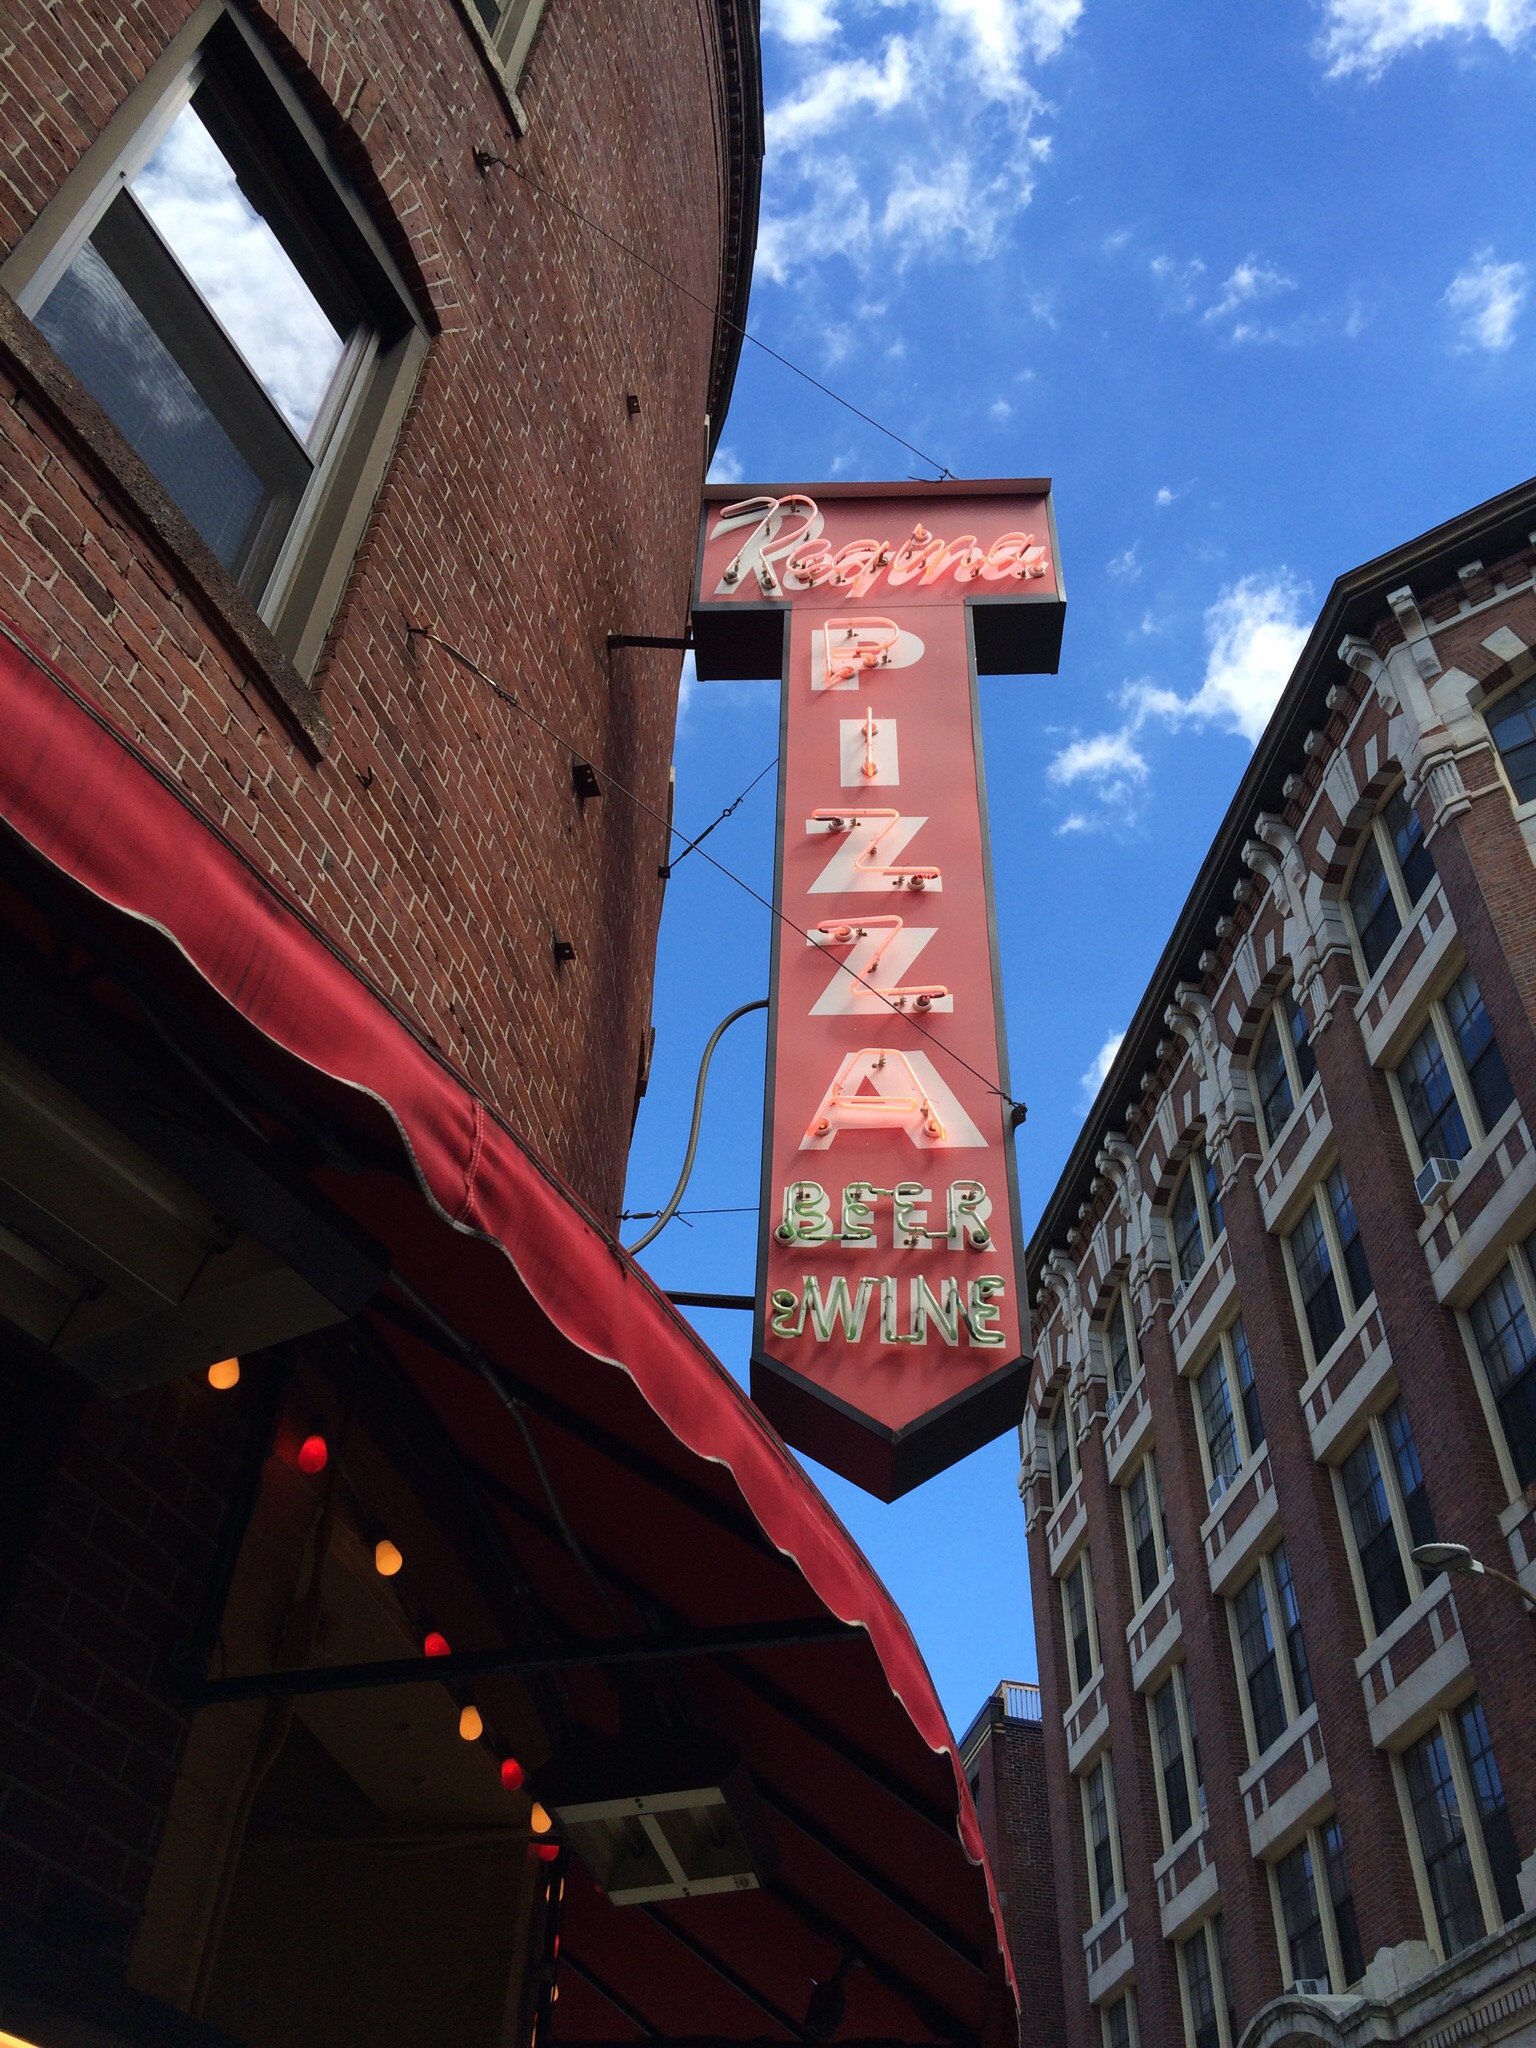
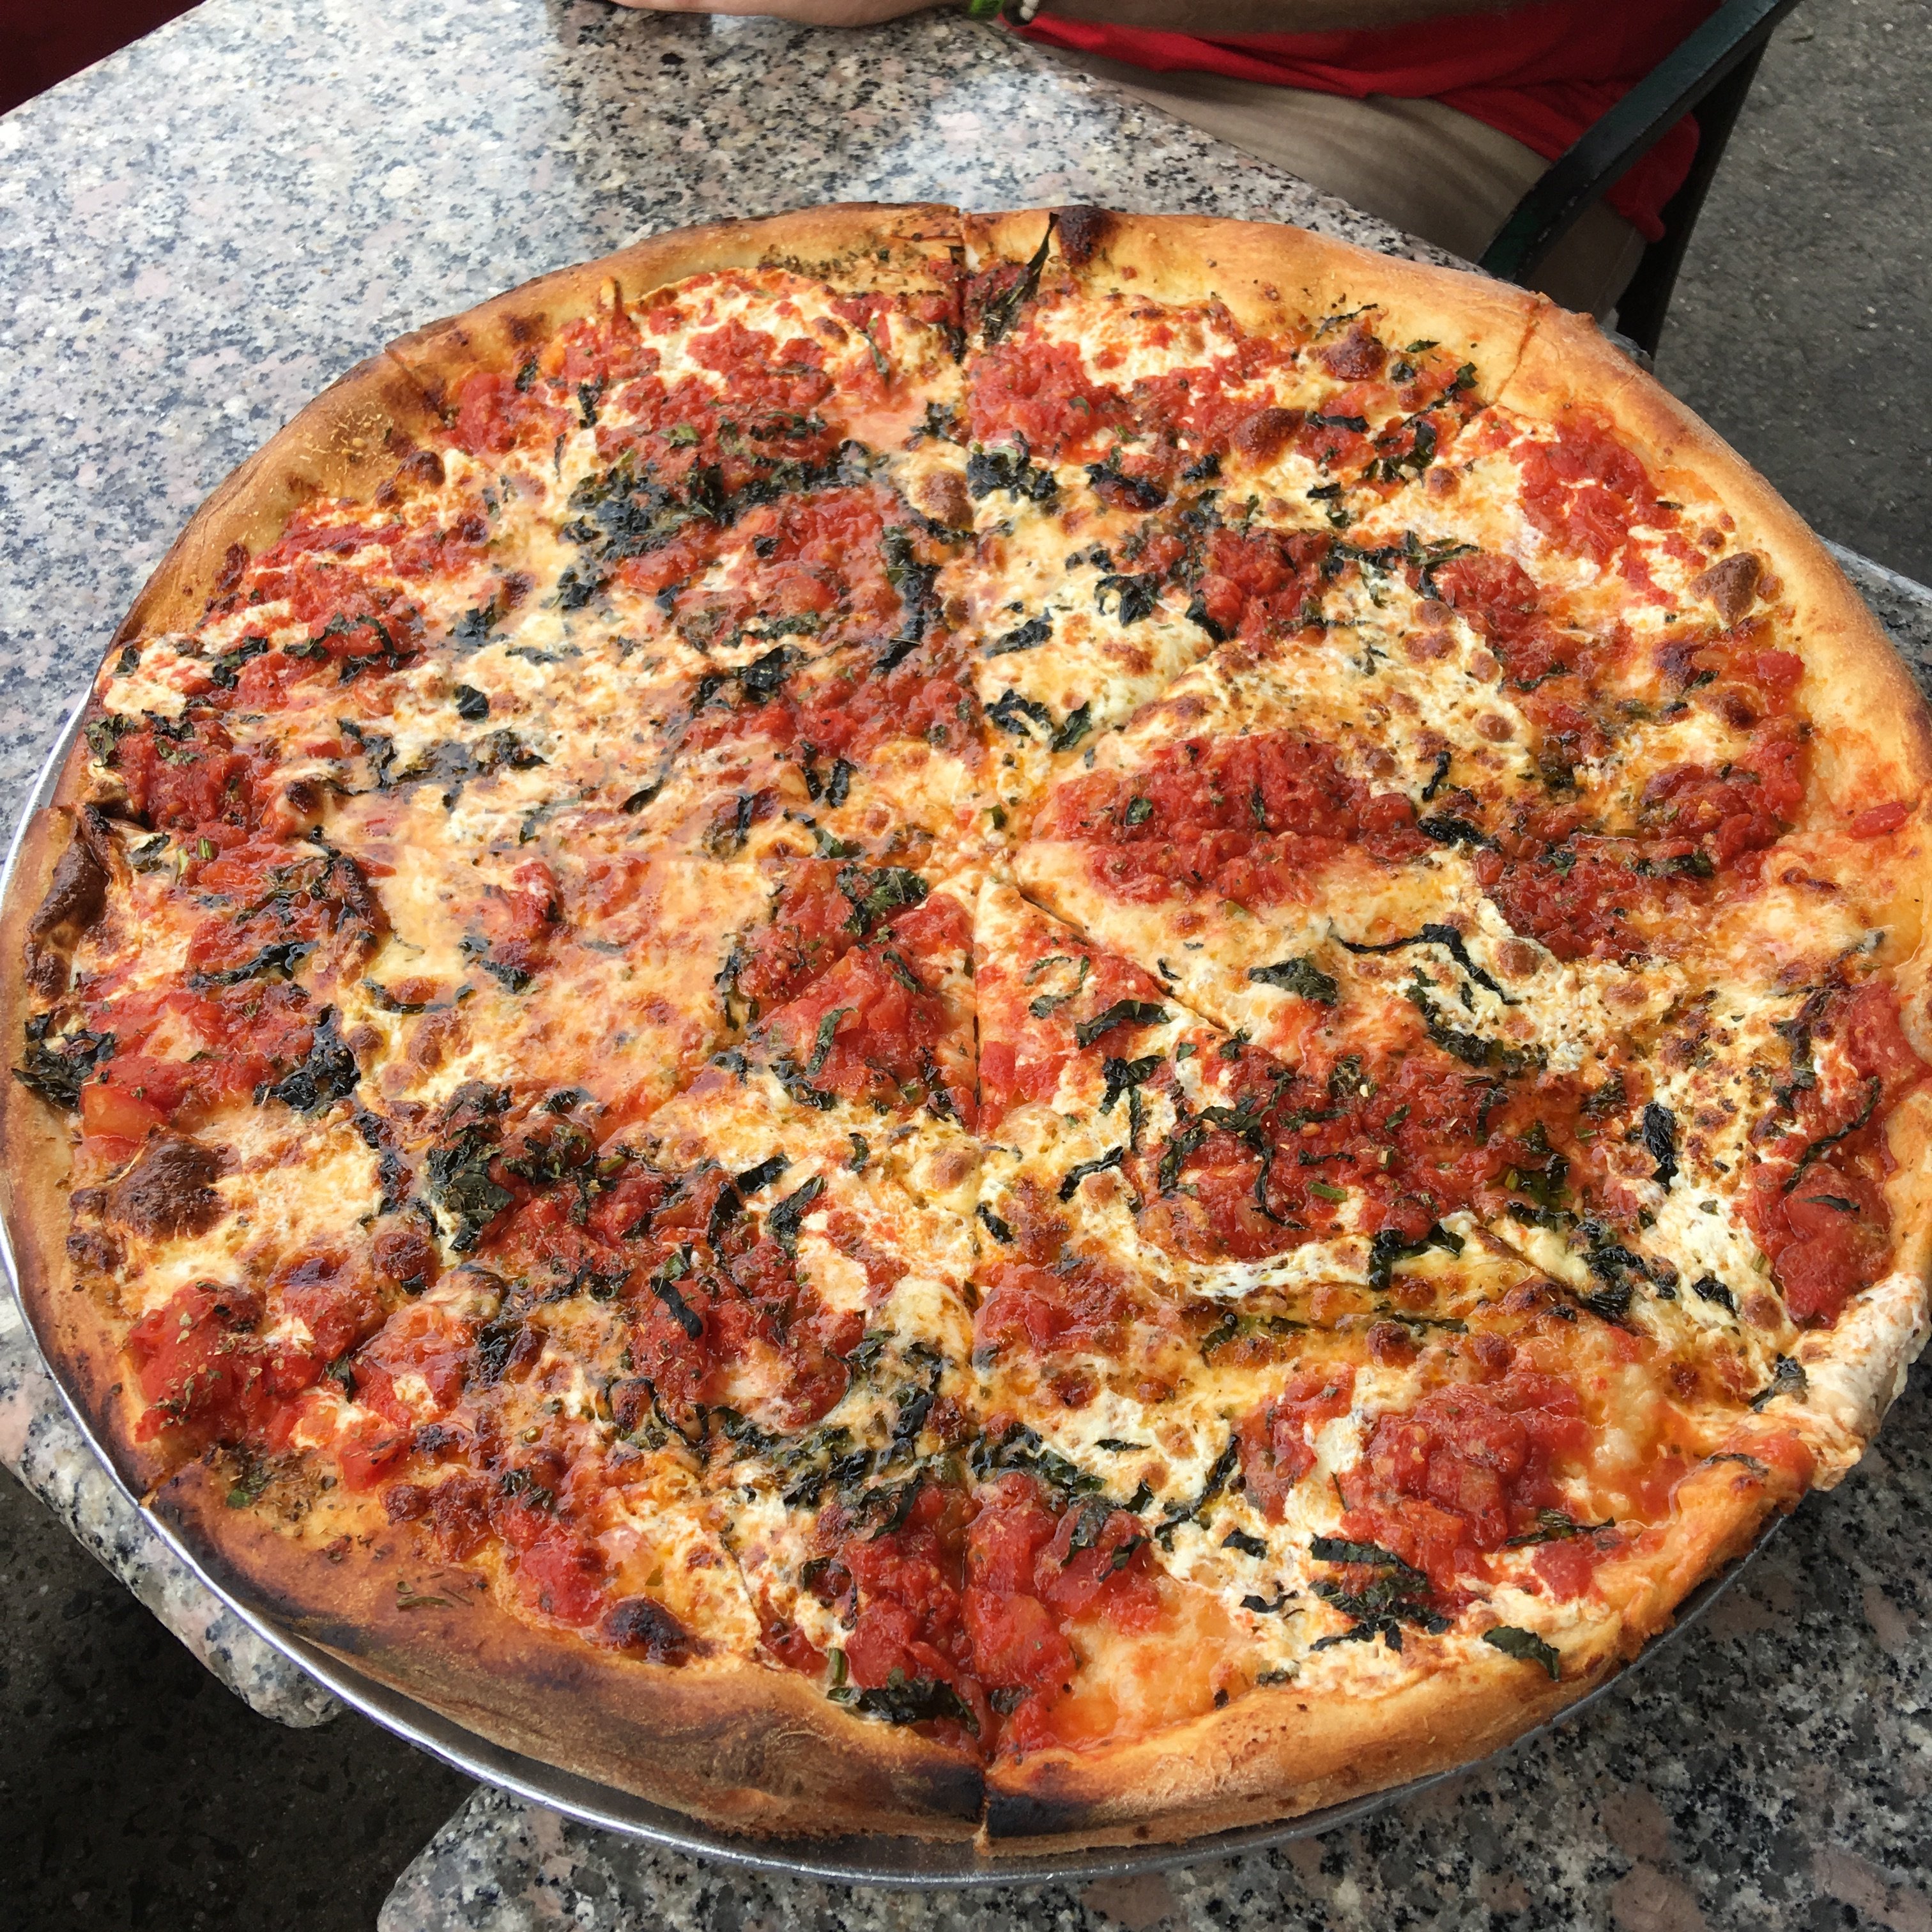
1. Regina Pizzeria – Boston, Massachusetts
Since 1926, guests have been flocking to Boston’s “Little Italy” in the North End for a taste of Regina’s famous brick-oven, thin-crust pizzas. At this local staple, known as “Boston’s original pizzeria,” diners wait in line for the spicy sauce, salty cheese and fresh, local ingredients.
· Signature slice: “The Giambotta,” topped with pepperoni, Regina sausage, salami, mushrooms, peppers, onions, fresh basil and mozzarella cheese.
· What TripAdvisor diners say: “Perfect chewy, thin crust, lots of fresh mozzarella; the sauce has great fresh tomato flavor. This pizza was very reminiscent of pizza I had in Naples and I haven't found anything like it in the U.S. until now.”
2. Bleecker Street Pizza – New York City, New York
Located in the West Village of Manhattan, “BSP” has been serving up its mouthwatering homemade sauce and classic New York foldable, triangle slices for 14 years. This tiny, authentic Tuscan-style pizza joint has recently expanded to offer additional seating for 35-40 pizza lovers.
· Signature slice: “Nonna Maria,” an old family recipe with thin Tuscan crust, fresh Grande mozzarella, homemade marinara sauce, Parmigiano-Reggiano cheese aged three years from Italy and fresh basil.
· What TripAdvisor diners say: “Both pies were freshly baked. The pizza dough was the perfect balance between crunchy exterior and soft interior; there was just the right amount of sauce; the toppings were excellent.”
3. Modern Apizza – New Haven, Connecticut
Founded in 1934, Modern is known for its coal-fired brick oven that serves New Haven-style thin-crust pizza. It’s also famous for piling on the toppings, which makes the “Italian Bomb” its most popular pie.

· Signature slice: The Italian Bomb, topped with bacon, sausage, pepperoni, mushroom, onion, pepper and garlic on a mozzarella base; available with red or white sauce.
· What TripAdvisor diners say: “I have been to Modern countless times. Always great. The pizza is thin and has a bit of a char to the crust. The sauce is very savory. My favorite topping is the sausage – perhaps the best I have had.”
4. Home Slice Pizza – Austin, Texas
With more than 20 toppings to choose from, this casual pizzeria has been serving homemade New York-style slices since 2006. Guest can dine-in or grab-and-go from the take-out window and eat in the outdoor seating area.

· Signature slice: “Special Slice” of the Day (toppings change daily)
· What TripAdvisor diners say: “When we first walked in, I was in heaven just from the smell! We were able to sit at the counter, which was entertainment itself watching them spin the dough. We split the White Pizza with meatballs. It was beyond good!”
5. Moose's Tooth Pub and Pizzeria – Anchorage, Alaska
Founded in 1996, Moose’s Tooth serves creative gourmet hand-tossed, stone-baked pizza. The restaurant also has a brewery onsite featuring Broken Tooth Brewing beer and even a theater section.
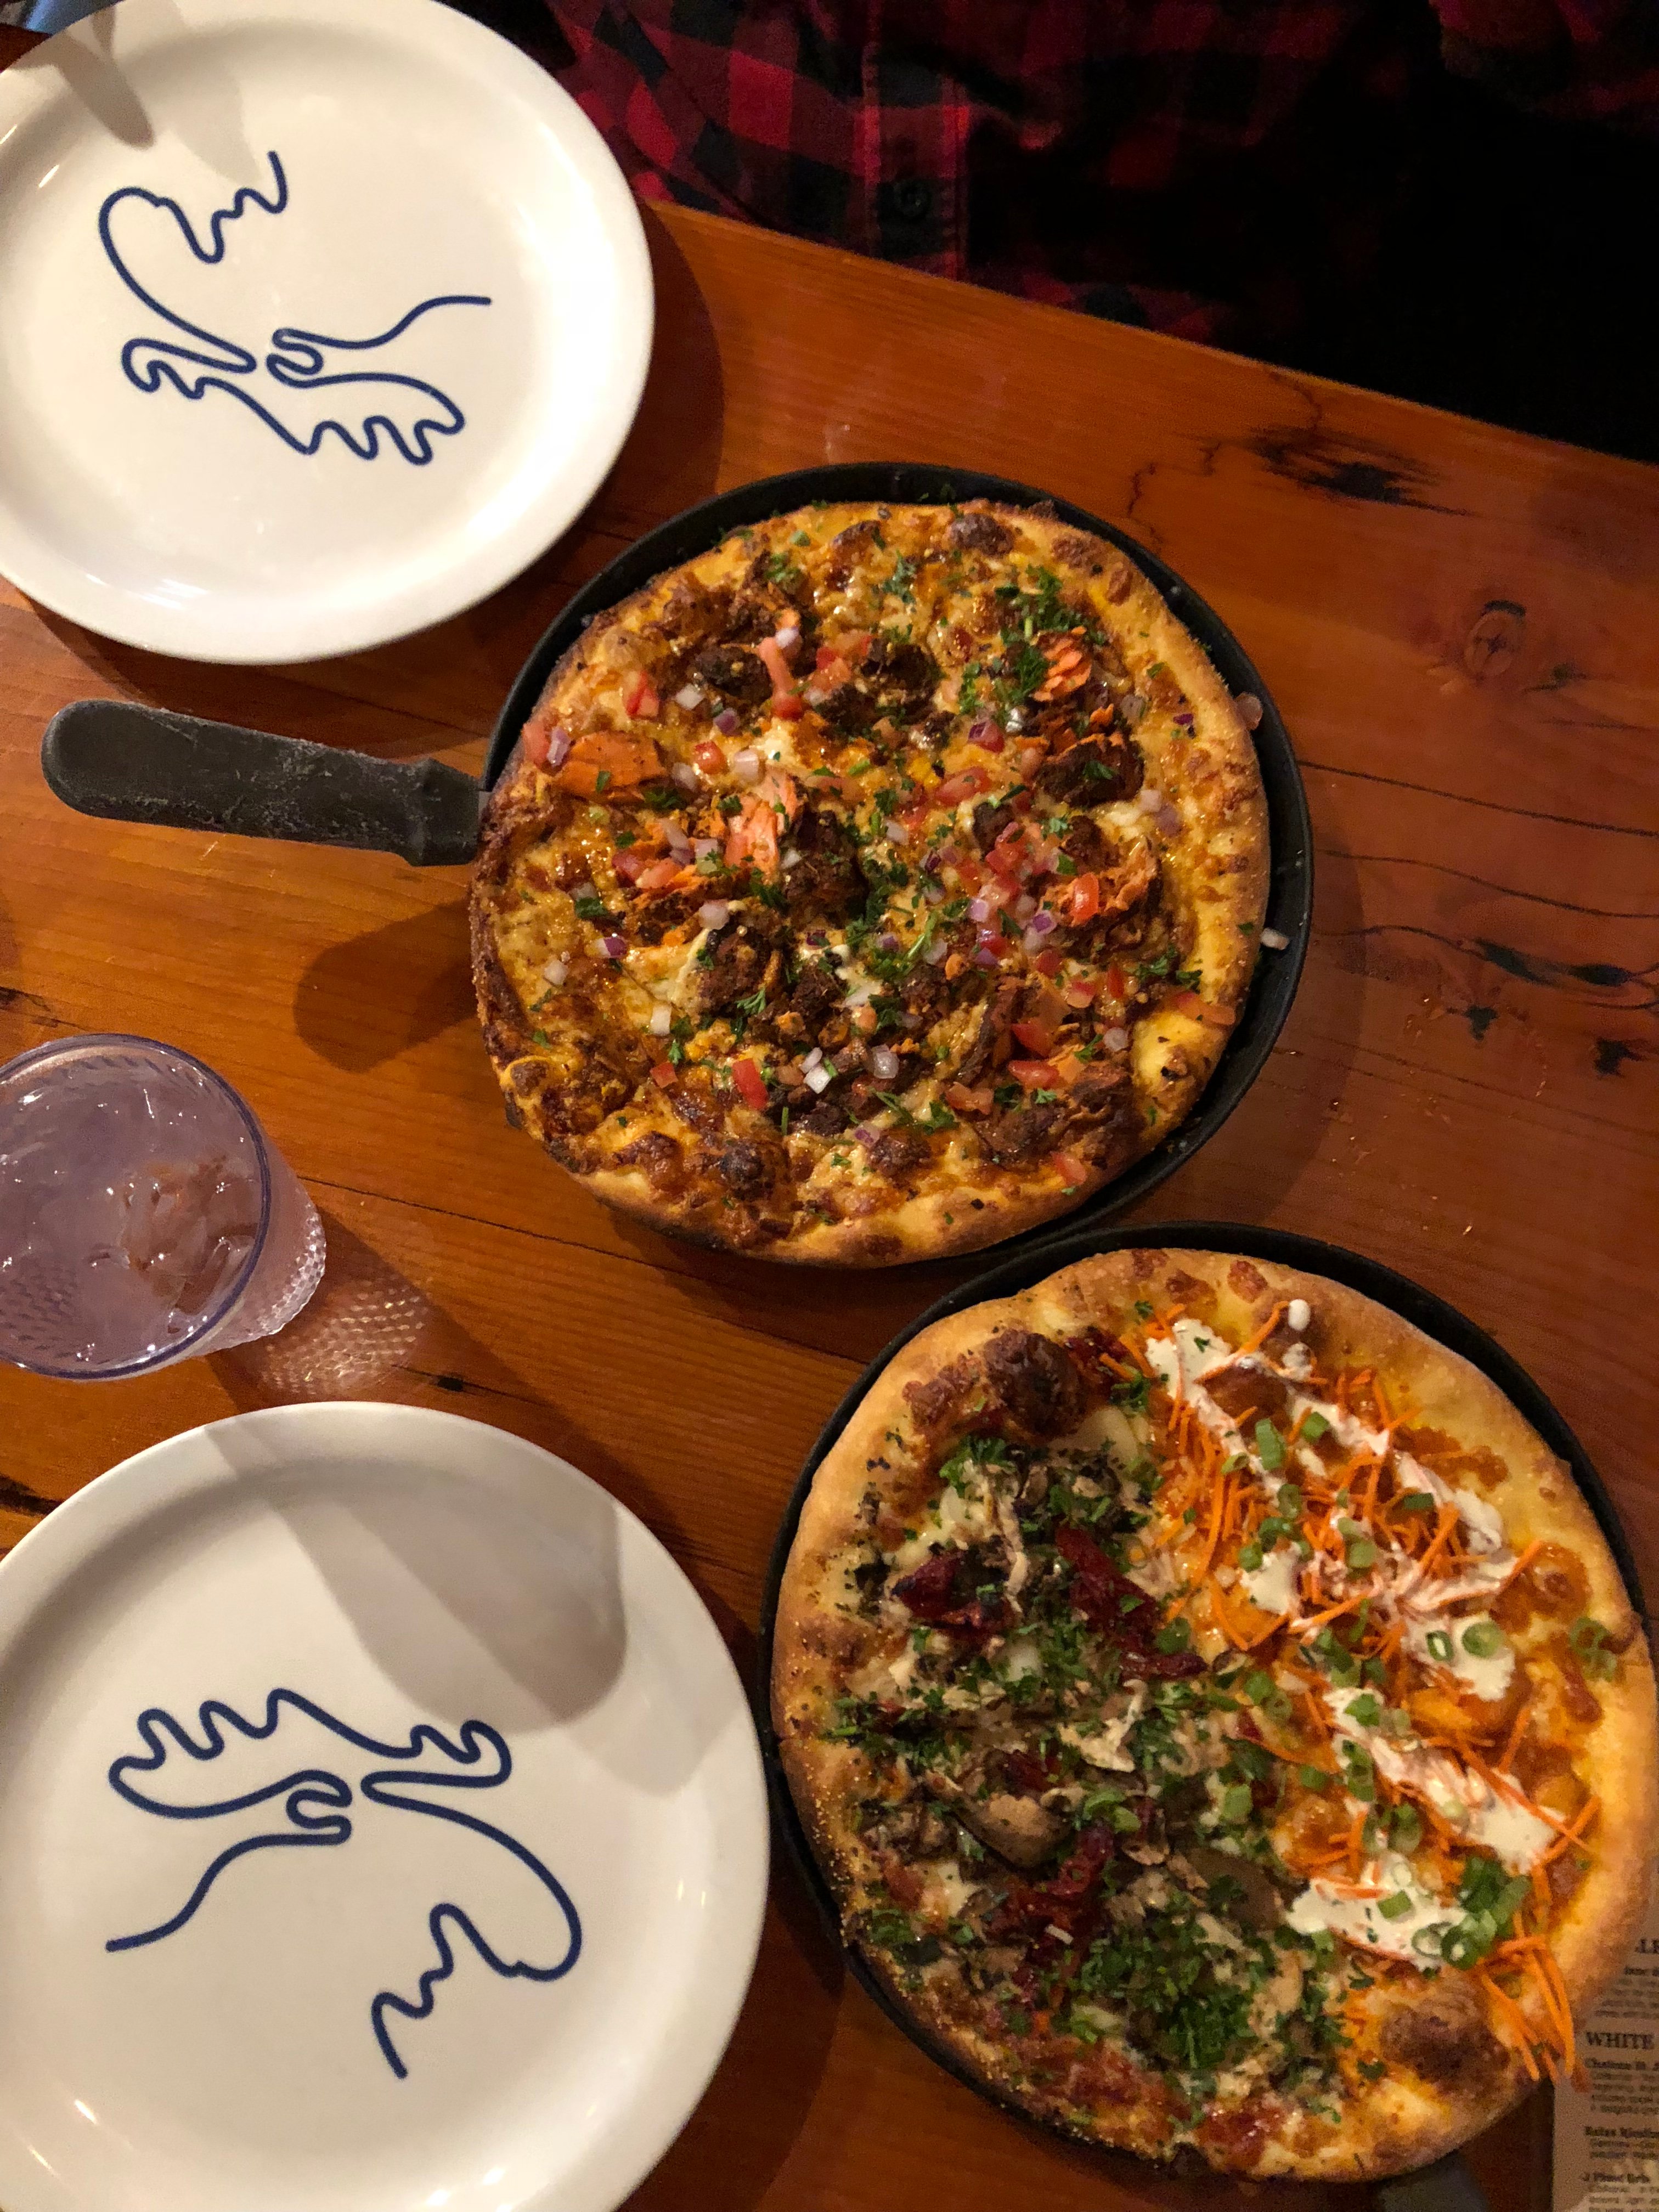
· Signature slice: “Amazing Apricot,” topped with blackened chicken, cream cheese, apricot sauce, red peppers, carrot threads, green onions, cilantro, mozzarella and provolone.
· What TripAdvisor diners say: “This was the best pizza. What makes the pizza good is the crust. We went with the thick crust and to be honest a basic cheese showed it off. Wish I could keep a pizza warm on the flight home.”
6. Juliana's Pizza – Brooklyn, New York
Patsy and Carol Grimaldi sold their famous namesake restaurant under the Brooklyn Bridge years ago, and now they’re back with Juliana’s, named after Patsy’s mother. This Neapolitan-style pizzeria makes pies in a coal-fired oven, producing a crisp and airy crust.
· Signature slice: “Classic Margherita,” with DOP San Marzano tomatoes, mozzarella and basil.
· What TripAdvisor diners say: “It is the best pizza, or at least tied for the best, I have ever had anywhere. The sauce, the crust, the toppings … oh my! The four of us ordered a large pepperoni and small margherita and left no crumbs!!”
7. Five Points Pizza – Nashville, Tennessee
This East Nashville location makes large, New York-style dough, made from scratch daily, aged in-house, hand-tossed, and topped with hand-crushed plum tomato sauce and house-shredded mozzarella. Pizzas are baked to order on two-inch bricks in old-school, gas-fired deck ovens.
· Signature slice: “Prosciutto & Basil”
· What TripAdvisor diners say: “It was really low-key and staff were great! It was tasty and crust cooked to perfection. Great choices for everyone, even the picky eaters. Get a big one — it’s even great when cold the next day!”
8. Joey's House of Pizza – Nashville, Tennessee
Joey’s is an authentic family-owned and operated New York-style pizzeria founded in 1999. With Brooklyn roots and Italian heritage, the staff makes hand-tossed pizza by the slice, from scratch, with fresh ingredients and Sicilian or double stuffed slices.
· Signature slice: “Joey’s Specialty Pie,” made with meatballs, Italian sausage, chicken, spinach, artichokes, eggplant and fresh tomatoes.
· What TripAdvisor diners say: “The crust is so delicious and the sauce, OMG, it's the bomb. The pepperoni is so flavorful, you will wonder why every pizza place doesn't use the real thing! And the cheese blend melts perfectly with those little bits of fresh, salty, delicious fresh mozzarella will make you salivate just thinking about them!”
9. Andolini's Pizzeria – Tulsa, Oklahoma
The Andolini family began near Naples, Italy, before landing in Oklahoma, where they perfected “Tulsa-style” pizza in a Roto-Flex oven. Guests can enjoy New York-inspired pizzas with imported toppings, house-made mozzarella and a sprawling beer menu.
· Signature slice: “S.P.Q.R,” made from ricotta, garlic, house-made Italian sausage and prosciutto.
· What TripAdvisor diners say: “Tomatoes from Italy, fresh house-made mozzarella and crust baked on stone. We added chicken on one side and Italian sausage on other. Absolutely wonderful.”
10. Duetto Pizza and Gelato – Key West, Florida
This small eatery in the heart of Key West serves thin-crust pizzas in more than 20 varieties at great prices. Guest who want the full taste of Italy can also try 15 homemade gelato flavors.
· Signature slice: “Meat Lovers” made with Italian sausage, pepperoni, ham, meatballs, Italian mozzarella and provolone cheese.
· What TripAdvisor diners say: “The pizza choices are impressive. Wonderful crust, toppings were flavorful and just the right proportions. Loved every bite.”
Top 10 U.S. Pizza Cities (And Where to Go for the Perfect Slice)
1. New York City, New York
· Top-rated pizzeria: Bleecker Street Pizza
2. Chicago, Illinois
· Top-rated pizzeria: Lou Malnati’s Pizzeria
3. Las Vegas, Nevada
· Top-rated pizzeria: Pizza Rock
4. San Francisco, California
· Top-rated pizzeria: Tony's Pizza Napoletana
5. Orlando, Florida
· Top-rated pizzeria: Red Oven Pizza Bakery
6. Seattle, Washington
· Top-rated pizzeria: Serious Pie
7. Boston, Massachusetts
· Top-rated pizzeria: Regina Pizzeria
8. San Diego, California
· Top-rated pizzeria: Filippi's Pizza Grotto
9. Atlanta, Georgia
· Top-rated pizzeria: Antico Pizza Napoletana
10. Washington, D.C.
· Top-rated pizzeria: Pi Pizzeria
Top 10 Pizza Restaurants in the U.S. is based on the reviews and opinions of TripAdvisor diners, taking into account the quality and quantity of reviews and great pizza reviews, with more weight to reviews received in the past year. Featured restaurants have a minimum of 4.5 out of 5 bubbles, 500 reviews and 15 locations or fewer as of September 2018.Top 10 U.S. Cities for Pizza is also based on the quality of pizza restaurant reviews and the quantity of pizza restaurants and their great pizza reviews, with more weight given to reviews in the past year.
Best Cities for Vegans and Vegetarians
With Nov. 1 being World Vegan Day and research showing that skipping meat can save the average person at least $750 per year, the personal-finance website WalletHub released its report on 2018’s Best Cities for Vegans & Vegetarians.
To determine the best and cheapest places for following a plant-based diet, WalletHub compared the 100 largest cities across 16 key indicators of vegan- and vegetarian-friendliness. The data set ranges from the share of restaurants serving meatless options to the cost of groceries for vegetarians to salad shops per capita.
| Top 20 Cities for Vegans & Vegetarians | ||||
| 1 | New York, NY | 11 | Washington, DC | |
| 2 | Portland, OR | 12 | Tampa, FL | |
| 3 | Orlando, FL | 13 | Chicago, IL | |
| 4 | Seattle, WA | 14 | Phoenix, AZ | |
| 5 | San Francisco, CA | 15 | Miami, FL | |
| 6 | Los Angeles, CA | 16 | Atlanta, GA | |
| 7 | Austin, TX | 17 | Anaheim, CA | |
| 8 | Scottsdale, AZ | 18 | Nashville, TN | |
| 9 | San Diego, CA | 19 | Houston, TX | |
| 10 | Las Vegas, NV | 20 | Madison, WI | |
Best vs. Worst
- Scottsdale, Arizona, has the highest share of restaurants serving vegetarian options, 33.44 percent, which is 16.8 times higher than in Laredo, Texas, the city with the lowest at 1.99 percent.
- Scottsdale, Arizona, has the highest share of restaurants serving vegan options, 20.23 percent, which is 37.5 times higher than in Newark, New Jersey, the city with the lowest at 0.54 percent.
- San Francisco has the most community-supported agriculture programs (per square root of population), 0.0128, which is 18.3 times more than in Houston, the city with the fewest at 0.0007.
- New York has the most salad shops (per square root of population), 0.2510, which is 42.5 times more than in Laredo, Texas, the city with the fewest at 0.0059.
To view the full report and your city’s rank, click here.
Brand Intimacy Report
The fast food moved up from eighth to sixth place in MBLM’s Brand Intimacy 2018 Report, which is the largest study of brands based on emotions. The top three in the industry were Starbucks, Chick-fil-A and Chipotle. The remaining brands in the Top 10 for fast food were: Pizza Hut, Domino’s Pizza, Wendy’s, Baskin-Robins, Subway, Dunkin’ Donuts and KFC.
Brand Intimacy is defined as a new paradigm that leverages and strengthens the emotional bonds between a person and a brand. MBLM’s study again revealed that top intimate brands in the U.S. surpassed the top brands in the Fortune 500 and S&P indices in revenue and profit over the past 10 years.
“Starbucks is the clear leader in the fast food industry," stated Mario Natarelli, managing partner at MBLM. “The brand continuously seeks to improve its offerings and deepen customer bonds, from capitalizing on food trends, optimizing its app, personalizing its services and creating a space for people to connect with others. Despite some well-publicized missteps this year, the brand handled those transparently, and continuously seeks to emphasize its social responsibility. Other brands in the industry can learn from this trailblazer on how to build more robust, lasting bonds."
Additional noteworthy fast food findings from MBLM’s Brand Intimacy 2018 Report include:
- The fast food industry had an average Brand Intimacy Quotient of 28.0, which was above the cross-industry average of 27.1
- Indulgence, which describes a brand relationship centered on moments of pampering and gratification, was the most dominant archetype in the category, and Starbucks was the top-performing brand for indulgence
- Starbucks was also the most intimate brand among women, whereas men preferred Chipotle
- Domino’s Pizza and Wendy’s moved up in the industry’s rankings since last year, whereas McDonald’s and Subway fell in the rankings
To view the fast food industry findings, please click here. The full Brand Intimacy 2018 Report and the Ranking Tool can be found here.
This year’s report contains the most comprehensive rankings of brands based on emotion, analyzing the responses of 6,000 consumers and 54,000 brand evaluations across 15 industries in the U.S., Mexico and UAE. MBLM’s reports and interactive Brand Ranking Tool showcase the performance of almost 400 brands, revealing the characteristics and intensity of the consumer bonds.
NYC Restaurant Holiday Hourly Hiring
Merlin, a jobs platform for hourly workers, took a look at median base salaries across a number of restaurant careers to determine the 10 highest paying hourly jobs in the industry. The team also identified top NYC restaurant chains hiring the most for the upcoming holiday season.
Top 10 Highest Paid Hourly Worker Positions in New York City
Line Cook: $14.85
Dishwasher: $15.15
Baker: $15.50
Kitchen helper: $16.00
Porter: $18.66
Restaurant Manager: $18.90
Waitress: $23.36
Sushi Chef: $24.06
Banquet Server: $26.25
Sous Chef: $27.28
Top Five Restaurants Hiring The Most for the Holidays in New York City
Johnnys Pizzeria: 31 Job Openings
Villa Lombardis Pizza: 52 Job Openings
JMC Holdings (Domino's): 63 Job Openings
TGI Friday's: 66 Job Openings
Hale & Hearty Soups: 97 Job Openings
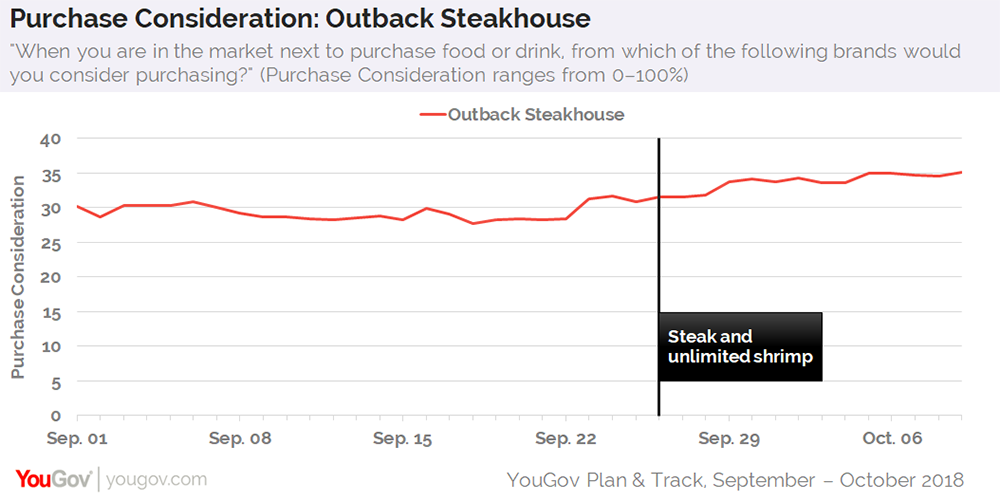
Outback Steakhouse Promotion Results
After launching its unlimited shrimp promotion, talk of the restaurant chain reaches a new high
Offering customers the all-you-can-eat option is rarely an unpopular move among the general public. If restaurant patrons don’t want to consume all that much, they don’t have to; but if they’re in the mood for food, they can stay until satisfied.
Consider one of the latest examples: Outback Steakhouse, which began offering steak and unlimited shrimp on September 26.
Outback Steakhouse has promoted the limited-time deal on national television and social media, helping boost the number of people exposed to ads for the restaurant chain. Indeed, new data from YouGov Plan & Track shows that, on September 26, 31% of US consumers aged 18+ recalled seeing an advertisement for Outback Steakhouse within the past two weeks. At present, that percentage has climbed to 38%.
What’s also increased is the number of US adults open to dining at Outback Steakhouse. Since the unlimited shrimp deal debuted on September 26, the percentage of US consumers aged 18+ saying they'd consider visiting an Outback Steakhouse when next in the market for food or drink has grown from 32% to 35%, matching a high for the year.
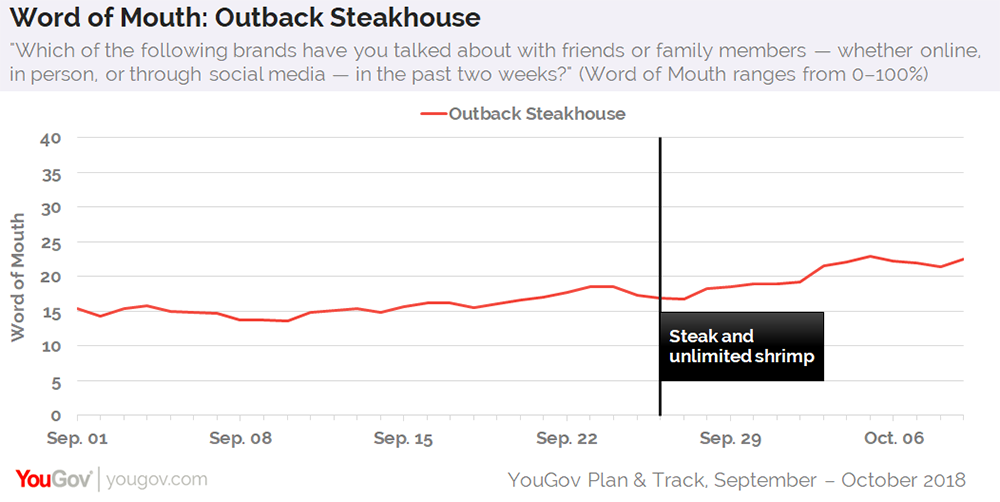
Another metric recording gains is Outback Steakhouse’s Word of Mouth score, which asks respondents if they’ve discussed a particular brand with friends or family members in the past two weeks. Since the restaurant chain began offering unlimited shrimp, Outback’s Word of Mouth score has risen from 17% to 23%.
Additional data from YouGov Plan & Track reveals that 44 percent of current Outback Steakhouse customers tend to dine in a restaurant, cafe, pub, or other eating establishment at least once per week, compared to 36% of the general public.
Plant-Based Meat Market
Persistence Market Research (PMR) delivers key insights on the global plant-based meat market in its upcoming outlook titled, 'Global Market Study on the Plant-based Meat Market'. In terms of value, the global plant-based meat market is projected to register a healthy CAGR of 5.8 percent during the forecast period, due to various factors, regarding which PMR offers vital insights in detail.
In recent years, the plant-based food market has witnessed significant growth, which is attributable to a rise in the awareness about the critical health benefits associated with the consumption of these kinds of food products. The annual global sales of plant-based meat products has grown at an average of eight percent since 2010. In the global market, Asian countries like China have shown a rise in the consumption of plant-based meat products year-on-year. Chinese consumers have been considering plant-based meat products in the daily diet, making the country one of the dominant plant-based meat market on the global stage. On the other hand, the European and North American regions have been tagged as an emerging regions for the global plant-based meat market. In Germany, one out of ten consumers have been buying plant-based meat products at regular intervals. Most of these consumers are in the millennial age group, showing preference for plant-based meat products. Similarly, in Italy, consumers have lowered the intake of red meat products, and are gradually triggering the demand for plant-based meat products. In North America, the U.S. retail value sales for plant-based meat products have been surging over the past couple of years, surpassing the U.S. animal-based food market. This indicates a rise in the demand for plant-based meat products by consumers in the country.
The confluence of several critical factors such as higher penetration rate of social media channels, easy availability of critical information regarding the consumption of plant-based food products, consumers' desire for a healthy lifestyle, and rise in per capita income in several developing nations has been triggering the demand for plant-based meat products on the global stage. The tenacity of consumers' adoption of a healthy lifestyle, fat-free diet in the daily routine has been driving some of the major food manufacturers to come up with plant-based meat products. For instance, in 2016, Rosquette launched NUTRALYS®? T70S, a plant-based meat product, in order to cater to the rising demand for plant-based food products.
In terms of revenue, the global plant-based meat market is expected to represent an incremental opportunity of US$ 20,261.5 Mn by 2026 end over 2017. By product type, the RTC/RTE segment is expected to register relatively higher CAGR growth in the global plant-based meat market. The North American region is expected to register a CAGR growth of 8.3 percent over the forecast period due to a rise in the vegan population in the region.
Drivers and Restraints for Plant-based Meat Market
Owing to a rise in the awareness about the critical health benefits gained by the consumption of plant-based food products, over the past couple of years there has been a rise in the overall vegan population, globally. In 2012, the vegan population accounted for around 25.6% of the global population. Among the vegan population, tofu is perceived to be the most similar alternative for meat, and consequently, other soy food products like tempeh are also gaining popularity due to its texture, chewiness, and sensory attributes.
Moreover, there has been concerns of rising obesity in most o developed countries like the U.S. and major parts of the European region due to the intake of unhealthy and high cholesterol content food. As a result, there is a shift in the preference for plant-based food products, such as plant-based meat products, which promotes good health among these consumers.
The price of the product is one of the factors that is considered by consumers while buying a meat alternative. Many consumers have expressed concerns over the prices of meat alternatives, which are relatively higher in some countries than meat itself. In such circumstances, these expensive prices of plant-based meat products are likely to affect market growth in a bigger way than it appears, as positive consumer approach towards meat alternatives is not very mature, and high prices may drive away even those consumers who are ready to opt for meat alternatives.
Dunkin' Rebrand
In its 2017 annual report, Dunkin’ revealed its most valuable products according to consumer demand, were hot coffees, out-of-home drinks and iced coffees, instead of their core baked goods range, observes GlobalData, a leading data and analytics company.
In line with this, GlobalData’s latest report, ‘Top Trends in Hot Drinks 2018 – The latest trends in hot coffee, hot tea, and other hot drinks’ reveals that consumers’ preference for Coffee & Tea shops has not diminished with 42% of global consumers stating they visited the channel in the past week. For Dunkin’s key markets, this percentage stood at 40% of consumers in North America, and 39% of consumers in Latin America.
This data supports the company’s decision to drop ‘donuts’ from its name in order to focus more on convenience beverages and away from baked goods which made it the quick service restaurant (QSR) player it is today.
Cassius Prempeh, Associate Consumer Analyst at GlobalData commented, “The new branding offers a strong positioning for Dunkin’s coffee products, underlined by the analysis of their 2017 results which found 60% of Dunkin’s sales came from beverages.”
In GlobalData’s 2018 Q3 consumer survey, which informed the company’s report ‘Top Trends in Hot Drinks 2018 – The latest trends in hot coffee, hot tea, and other hot drinks’, consumers were asked what convenience meant to them in terms of drink products. 48 percent of global consumers valued quick preparation, 22 percent of the same consumers mentioned how portable the product is and 36% said how quick to eat or drink the product is.
Dunkin’ Donuts has walked the line between a QSR and a Coffee & Tea shop this unique position, has meant competition has included everyone from McDonalds to Starbucks.
Prempeh continued, “Competition from these dominant companies might have played a part in Dunkin’s decision to revise product strategy, to an even more specialized offering while sticking to its roots in baked goods.
“These responses demonstrate a consumer market that is increasingly on the go and requires beverages that fit in with their busy lifestyles. Therefore, targeting morning rush hour periods where consumers want to grab a quick beverage is the opportunity that Dunkin is aiming to focus more on.”
Dunkin’ Donuts’ recent decision to rebrand as simply Dunkin’ seems to have generated a healthy amount of positive press coverage for the restaurant chain. In fact, more US adults are currently talking about the brand than at any point this year. According to new data from YouGov Plan & Track:
Since the official announcement, made on September 25, Dunkin’ Donuts Buzz score has climbed from 12 to 21 among the general public.
-
More people are also talking about Dunkin’ Donuts than at any point in 2018. Yesterday, 23 percent of US consumers aged 18+ recalled discussing the restaurant chain, up from 15 percent on September 25.
-
As for Purchase Consideration, Dunkin’ Donuts score briefly climbed from 28 to 30 percent.
Tilapia Consumption
Volume consumption of tilapia in the U.S., the largest tilapia importer, witnessed confined growth prospects with decline an excess of 10 KT estimated in 2017 over 2016, as per Fact.MR study. Declined consumption patterns mimic the broader trends in the production scenario as low prices pose challenges for companies to maintain high profitability.
On the contrary, the second largest consumer – Russian Federation witnessed an increase in demand with a marginal volume consumption of 4 KT in the period of 2016-2017. Report opines that the Russian Federation tilapia market is expected to report a steady demand for tilapia through 2022 while presenting emerging opportunities for Chinese suppliers in the future.
Domestic consumption predominates the tilapia market where the loss in exports is countervailed by persistently rising demand in the domestic markets of producing countries. As the domestic consumption holds sway, Fact.MR clearly estimates the preeminence of domestic market prices over export prices in the profiled exporting countries during the forecast period.
According to the study, Greater China, the largest producer of the tilapia will maintain its dominion with an estimated production of 1989 KT in 2017, about 28 percent of the global production. While Chinacontinues to helm the production, global tilapia trade has witnessed increasing participation of other tilapia producing countries.
With the improvements in aquaculture practices, tilapia markets in Egypt and Indonesia are estimated to account for over 36 percent of the global production collectively while significantly curbing the share of the Chinese tilapia market.
Erosion of the Chinese tilapia market can also be attributed to increasing inclination of tilapia farmers for other specialty fishes such as pangasius owing to increasing demand for this low-cost fish variety.
Amidst the declining shares of China, Fact.MR study reveals a persistent increase in the global tilapia production wherein top ten countries (China, Egypt, Indonesia, Bangladesh, Philippines, Thailand, Vietnam, Brazil, Mexico and Uganda) are expected to account for 90 percent of the global production by the end of 2028.
Considering the nature of the commodity, export market dominates the frozen varieties of tilapia. Fact.MR finds that demand for frozen tilapia in the U.S. accounted for over 86% of the total U.S. demand in 2017, of which frozen fillets were highly consumed as compared to frozen whole tilapia.
Ubiquitous demand for tilapia in American restaurants and seafood aisles is one of the prime fillips continue to underpin the higher share of frozen tilapia in the U.S. by the end of 2028. However, tariffs on the Chinese seafood following the US-China trade war will continue to deter the growth prospects for Chinese exporters.
Comparable trends in the demand for tilapia frozen fillets was estimated in the Russian Federationwhere over 98 percent of the total tilapia consumption is expected to be held by tilapia frozen fillets throughout the forecast period.
Impacted by the changing prices in the tilapia market, prominent players in tier 1 and tier 2 have been observed to dip their toes into the new venture of introducing novel product offerings to target the high potential market including the U.S. and Eu28.
Observing the growing preference for eco-labelling, convenience packaging and increasing emphasis on the low-antibiotic production process, prominent players have identified the increasing consumer pallet for premium products in the leading export market. MR foresees steady growth prospects for the tilapia market while considering important caveats of the seafood industry that are likely to influence the future supply-demand equation. Increasing demand for other fish varieties such as pangasius, growing concern regarding production loss owing to Tilapia Lake Virus (TiLV) infection and lower appetite for tilapia in the potential market like EU28 are few of the prime factors that are likely to challenge the future sustainability of the tilapia market.
Achieving Zero Hunger
Advancing the food banking model globally will play a critical role in achieving the Zero Hunger Sustainable Development Goal says a new report from The Global FoodBanking Network.
Food banks – which provide meals to those facing hunger through recovering surplus food – operate at the community level in dozens of countries and are estimated to reach more than 15 million people outside of the United States. The report suggests that with greater support from global partners, this model could be replicated and scaled to help solve the challenge of hunger.
The State of Global Food Banking 2018: Nourishing the World is the first publication to profile food banks on a global scale and includes profiles of these food recovery organizations in more than 50 countries. The study provides insights and demonstrates the effectiveness of the food banking model as a grassroots, community-led hunger intervention.
The publication is released on the heels of an announcement that hunger is on the rise, with 821 million people facing chronic undernourishment and billions more struggling with food insecurity.
"With the international community's goal of zeroing out hunger by 2030, the need for an effective method to address hunger and malnutrition has never been so clear," said Lisa Moon, President and CEO, The Global FoodBanking Network. "As this report shows, food banking is a proven and locally adaptable solution in solving this pressing humanitarian challenge."
Key findings and conclusions presented in the report include:
- Details on food banks served by The Global FoodBanking Network, operating in 31 countries, serving 7.78 million people, more than half of whom are children
- Food banks are an environmental asset as they procure wholesome, surplus food that might otherwise end up as waste throughout the supply chain and redirect it away from landfills to social service organizations that feed the hungry
- Because food banks' success relies on the management of local community leaders rather than temporary foreign aid, the concept is positioned for long-term, sustainable success
- Food banks can be adapted and tailored to work within specific countries' laws and respond to different community needs
- More than 60 million hungry women, children and families have access to food as a result of food banks
Food banks are formed by local leaders to procure safe and surplus food from commercial food systems, which might otherwise go to waste or to landfills, and repurpose it for distribution to those facing hunger directly through community service organizations. While known widely in the U.S. and Europe, in the last decade food banks have become critical community supports in many emerging market economies by providing food assistance to vulnerable populations that are too often left behind.
The State of Global Food Banking 2018: Nourishing the World was made possible by the generous support of the Bank of America Charitable Foundation, Cargill, and The Kellogg Company Fund and was made possible through the strategic support for the organization offered by the PIMCO Foundation. It will be the first of an annual report measuring the impact of food banks.
The State of Global Food Banking 2018: Nourishing the World can be accessed here.
Halo Effect of Retail
Retailers with physical stores experience higher web traffic, attract new customers and increase brand awareness in the market, according to a recent ICSC study, “The Halo Effect: How Bricks Impact Clicks.” The research revealed that opening a new physical store leads to a 37 percent average gain in overall traffic to a retailer’s website and increases its share of web traffic within that market by an average of 27 percent. The opposite is also true as web traffic tends to fall when stores close.
The “halo effect” – commonly defined as the tendency for an impression created in one area to influence another – is radically transforming how retailers do business and innovate. The research explores, and quantifies, how physical locations impact a brand’s digital presence, why that relationship matters, and why physical stores are essential to any successful retail strategy.
“The clicks versus bricks debate is over. We have long suspected that there is a direct and positive correlation between having both a physical and a digital presence, and the Halo Effect study confirmed this,” said Tom McGee, President and CEO of ICSC. “What we are seeing now is a retail renaissance as both new and established retailers are investing in their stores and reinvigorating their physical presence.”
The study, the largest of its kind, found that physical stores have a material effect on the success of a brand not just through sales but also in driving market performance and boosting customer perception. Customers in markets where emerging retailers have stores tend to consider those brands 69 percent of the time, versus 51 percent in general.
“The physical store is the hub of customer experience and service,” McGee continued. “Consumers today want to choose where and when they shop. Retailers that innovate and create a true omni-channel experience, leveraging the strengths of both physical and digital, will thrive.”
As physical stores act like “billboards” for brands, retailers can use both these stores and online retail to drive traffic to each other. When and where stores exist, consumers tend to use them: 84 percent of shoppers either shop exclusively in store (53 percent) or in combination with online (31 percent).
The full report can be downloaded here.
Social Media and Nutrition
Social media activity around avocado, almonds and quinoa far outstrips that of activated charcoal, collagen or pea protein – suggesting that North American consumers are more interested in foods that are easy to understand and naturally healthy, a social media analysis by New Nutrition Business reveals.
The food and nutrition consultancy analysed social media mentions of 20 selected health food ingredients on Instagram – the most popular social media platform for food-related subjects – between 2017 and 2018. The ingredients were ranked according to popularity, from those well-known to consumers to growing and emerging ingredients:
- Topping the list, with more than 100,000 mentions per month each, were avocado, almonds, blueberries, quinoa, kale, matcha and chia.
- Instagram mentions for these six were up between 14 percent and 75 percent over the previous year.
- One of the fastest-growing health ingredients on social media is collagen (a skincare ingredient used in beverages), which had 110% more mentions on Instagram in 2018 than 2017.
- At the bottom, among those least-mentioned on Instagram, were birch water, pea protein and charcoal.
- The 20 ingredients selected gained a total of over 850,000 mentions on Instagram in one month alone (July 2018).
The internet has become the primary source of nutrition advice for most Americans – with 34 percent of people relying more on blogs and online platforms than on dietitians or nutritionists.
"Mainstream America wants simple, natural, easy-to-understand ingredients. They are willing to try anything new as long as it passes that test," said Mellentin. "And they are open to trying something new if the benefit is clear. Collagen, for example, a natural protein, has some robust benefits for skin and joint health so it's no surprise to see it surging on social media."
For example, despite all the hype around activated charcoal, it has only one percent of the mentions of avocado or blueberry or almond. Good looks matter, but a health ingredient needs many other supporting factors to become a success on social media – and activated charcoal still has a long way to go.
The analysis also looked at how the ingredients were discussed in global online media platforms, blogs, forums, as well as social media channels, including most-favoured images posted by consumers, most-used hashtags and most popular searches.
The complete analysis was published in the report, 20 Key Health Ingredients: What Consumers Say on Social Media, available at new-nutrition.com.
Eating Patterns in America
While our economy is improving, the aging population and corresponding changes in life stage will contribute to the decline in total eating occasions on a per capita basis in the U.S., according to The NPD Group’s recently released Eating Patterns in America. Modest population growth will result in a less than one percent annual increase in total food and beverage demand, which isn’t significant enough to stop the decline in consumption occasions per capita.
The number of annual eating occasions per capita in the U.S. has been on a steady decline, reports NPD, which continually tracks all aspects of U.S. consumers’ eating attitudes and behaviors. U.S. consumers will average 1410 eating occasions per capita this year, or over 461 billion occasions for the total U.S. population, compared to 1453 occasions in 2009.
“Food and beverage consumption in the U.S. is perhaps the clearest definition of a ‘mature market,” says David Portalatin, NPD food industry advisor and author of Eating Patterns in America. “The balance between consumers eating in home or away from home has been stable for the past two years and neither the food retail or foodservice industries are increasing their ‘share of stomach.’”
The percentage of meals sourced in home increased gradually from 2002 to 2012 and currently 82 percent of meals are sourced from home, the remaining percentage of meals are sourced away from home. The balance of in home and away from home has been stable since. While both food retail and food service remain flat, there are variations in consumer choices between in home and away from home by daypart and food categories. For example, the share of in-home meals that include a blend of a prepared at home items and prepared away from home item has been steadily increasing and is forecast to grow.
“One thing remains certain: consumers must eat,” said Portalatin. “While it’s true that finding growth in this market is challenging for food and beverage marketers, those that focus on being meal solutions providers by understanding consumers’ needs and wants have the best shot at winning share.”
Cannabis Edibles Market
Edibles sales are on track to reach more than $4.1 billion by 2022, but that could prove a fraction of the sector’s potential now that major consumer packaged goods (CPG) companies are entering the industry according to the “The Tasty Future of Cannabis Edibles” report released today by Arcview Market Research in partnership with BDS Analytics. By 2018, consumer spending on cannabis-based food and drink is projected to reach $1.5 billion in United States and Canada.
Spending on cannabis-infused food and drink reached an estimated $1 billion in 2017 in the United States and Canada, representing around 11.4% of the total $9.1 billion in those two markets. According to the report, the majority of cannabis edibles sold in the United States fall into the candy and chocolate categories, which accounted for an estimated $598 million in sales in 2017, or just over 60% of the $991 million in total U.S. consumer spending on cannabis edibles.
According to the report, the trending shift toward consumables will continue over the next five years, with flower’s share of total spending dropping from 50 percent in 2017 to just 36% in 2022. Edibles is forecasted to grow from 12 to 14 percent in that time frame.
The Best Place to Eat Apple Pie
Lonely Planet, the leading international travel guidebook publisher, has recognized Apple Annie's as the best place to eat apple pie in the world. The four-generation Willcox, Ariz., family farm tops the list in the first edition of Ultimate Eats, recently published.
"Whenever we eat while traveling, we don't just taste the dish itself but experience the whirl of people, languages, aromas, and sounds that are unique to that destination," says Lonely Planet marketing manager Ashley Garver. "In this collection of the planet's most thrilling and famous culinary experiences, each entry in the list details an experience, the culture behind it, and what makes it so special."
The book, published by Lonely Planet Food, ranks the world's top 500 food experiences, with "apple pie in the USA" coming in at No. 85 and Apple Annie's leading the category.
"We have always focused on the total experience at Apple Annie's," says Mandy Kirkendall, daughter of founders Annie and John Holcomb. "There's nothing like eating apple pie right where the apples are picked. Also, it's a delicious recipe!"
Kirkendall owns and operates the farm with other family members including her grandfather Don Holcomb, her husband David, their son, her brother and sister-in-law Matt and Alicia Holcomb and their children.
The agritourism enterprise is rooted in a 6,000-tree apple orchard opened in 1986, the same year Annie concocted her secret from-scratch pie recipe that includes hand-peeled apples and hand-crimped crust. The pies come in old-fashioned, sugar-free, gluten-free, or crumb-topped; combined with tart cherries, raspberries, or rhubarb; and à la mode, if desired.
Apple Annie's now has 7,100 apple trees, 4,700-tree peach, 800 Asian pear, and 300 cherry as well as 37 acres of pumpkins, 19 acres of sweet corn, and assorted produce such as watermelons and peppers.
Customers may pick their own fruits and other vegetables in season and eat pie in the orchard. The family opened year-round Apple Annie's Orchard Country Store in 2013 with fresh pies, bread, fudge, gourmet jar goods, and gifts.
Apple Annie's (appleannies.com) hosts a series of food celebrations throughout the summer and fall, including Peach Mania, Sweet Extravaganza, Watermelon Weekends, Apple Harvest, and Pumpkin Festival. The events also benefit the Lupus Foundation of Southern Arizona, March of Dimes, and Youth Haven Ranch, with more than $100,000 donated so far.
Certified Success
Certified Angus Beef LLC reported record sales of its signature Certified Angus Beef® brand, marketing 1.21 billion pounds (lbs.) in the fiscal year that ended on Sept. 30: a 91 million-lb. increase (8.1 percent) over 2017.
"For the past 40 years, a community of people from farm to plate have shared a passion for excellence, a dedication to quality and ideas and inspirations to achieve our goals," said John Stika, the brand's president. "What started as a simple idea among a small group of cattlemen has become the world's leading beef brand."
Focused efforts by a community of farmers and ranchers to raise cattle meeting the brand's 10 exacting standards enabled licensed processors, distributors, restaurateurs and retailers to meet growing consumer demand for premium beef.
A record 5.18 million cattle were brand certified, up 14.3 percent in one year. The rate of eligible cattle earning the brand name was a record 32.5 percent, compared to 17.8 percent a decade ago.
Records Across Civisions
Manageable prices met strong demand to set sales records in every division of the Certified Angus Beef® brand, comprised of nearly 20,000 partners worldwide.
- Sales exploded in the International Division: 207 million lbs. exported to 50 countries outside of the United States, up 18.6 percent
- Retail Division sales, which make up 41 percent of the total, grew by 8.3 percent to 494 million lbs.
- The Foodservice Division netted sales of 405 million lbs., a 5.3 percent increase
- Value-added Products Division sales rose by 8.1 percent, driven most by smoked brisket, marinated fajita meat and frozen burgers
The brand's Prime extension achieved record growth at 31.2 percent, thanks to ranchers targeting the highest quality. Ground beef sales grew 10.3 percent, with end and middle meats up 8.2 percent and 6.5 percent, respectively.
The Certified Angus Beef® brand set sales records in all 12 months of its 40th anniversary year, with August being the most successful month ever recorded.
The Case for Convenience
A recent finder.com study that revealed Americans are spending $177 billion on convenience services each year, with 46 percent spending on services such as delivery, driving, handiwork, pet needs and subscription boxes. The most common type of convenience Americans are willing to pay for is food delivery, with roughly 45 percent of Americans spending an average of $63 each month on services like Seamless, UberEats, Grubhub, DoorDash, Caviar and Eat24. That is an estimated $7 billion each month, or $84 billion per year, spent to avoid cooking at home.
Subscription services revealed its popularity among Americans, with 44% spending an estimated $2 billion each month on signups with HelloFresh, BarkBox or Rent the Runway, bringing this service to the second most common convenience.
Completing the top five in a three-way tie are pet services (walkers, groomers), handy and cleaning services and car services, with roughly 43% of Americans spending an average of $19, $17 and $22 respectively on each of these.
The full report can be found here
When comparing convenience spend between men versus women, the study showed men spend roughly 50 percent more than women on food delivery services, about 200% more on subscription services and over 100% more on pet services, handy services, cleaning services and car services.
From a generational standpoint, Gen Y are the most likely to drop cash on convenience services across the board, spending on average $41 per month compared to baby boomers ($20) and Gen X ($13).
Those in a committed relationship spend an average of $101 per month on food delivery services, which is double that of widows ($52), triple that of singles ($31) and almost seven times as much as divorcees ($15).
“As the saying goes, time is money, and according to recent research from finder, Americans are willing to attach a pretty hefty price tag to it.," said finder’s Consumer Advocate, Jennifer McDermott. “The amount we’re shelling out for services that, in many cases, we could do ourselves is staggering. Particularly when you calculate the potential savings. I recommend those taking advantage of these savings do an audit of those that are needed e.g pet walking when you’re at work and those that can be minimized, such as food delivery. Consider a spending freeze on that particular service for a month and see how you fare at the end of it. In addition to savings, you may pick up a new skills or enjoy other positive benefits of doing it yourself.”
Beer Volume Declines
It was another rough year for the beer category, as total volume fell 1.1 percent to 2.8 billion 2.25-gallon cases in 2017, according to the Beverage Information Group's 2018 Beer Handbook. While the craft and imported beer segments showed growth and increased market share, total beer consumption has declined for five consecutive years, as U.S. consumers turn more to spirits and wine.
The Craft beer segment grew 4.9 percent in 2017 to 310 million cases. While craft beer's growth has slowed from 6.0% for the past two years, the category has pushed its market share to 11.1 percent in 2017, up from 10.4 percent in 2016 and 9.8 percent in 2015. Still, the oversaturation of some local/regional markets has hurt craft beer. Another factor impacting craft beer: U.S. consumers have never been more experimental or less brand-loyal.
The Imported beer segment was up 3.5 percent to 470.7 million 2.25-gallon cases, increasing its market share a bit to 16.8 percent in 2017. Beers imported from Mexico continue to thrive, as consumers see these brands as a step up in flavor and quality from macro U.S. lagers, while also representing a product that's appealingly authentic.
Flavored Malt Beverages (FMBs) were up 1.3 percent, reaching 112.3 million cases in 2017. The category's growth has cooled considerably, as it was fueled largely by gains in the Bud Light Rita's line, which has slowed in recent years.
Beer segments that have dropped include Light beer, which slipped 3.1 percent in 2017 to 1.22 billion cases; Popular beer, down 2.5% to 180.9 million cases; Super-premium and premium beers, which fell 3.7 percent in 2017 to 371.5 million cases and Malt Liquor, down 4.3 percent to 52.8 million cases. These segments of the beer category don't represent the current trend of "craft" or "premium" beverages, which makes it more difficult to connect with modern consumers.
Restaurant Labor Force Survey
Sixty-one percent of the restaurateurs believe labor shortage is their biggest challenge for restaurant operation. Menusifu, one of the fastest-growing provider of restaurant software solutions, unveiled its Restaurant Labor Force Report for Chinese Restaurant Industry in the United States. The findings cover market research, interviews and case analysis, and provide actionable solutions to restaurateurs in their operation optimization, management skills and corporate culture building.
Key findings include:
- The employee turnover rate in the restaurant industry in the U.S. is 72.9 percent.
- The average cost of replacing an employee is $5,864.
- The restaurant industry has the highest job vacancy rate amount all the non-agricultural sectors.
- The number of restaurants has increased by 40 percent since 2000, while the population growth of teenagers, the primary labor resource for restaurants, falls far behind.
- Job seekers' willingness to work in the restaurant industry declined by 33 percent in the last four years.
"Labor shortage is an industry-wide issue for all types of restaurants," said Yue Xie, the co-author of the report. "As a responsible company committed to help leverage the restaurant industry, we are excited to provide free access to industry reports and insights for restaurateurs. Menusifu is always here for all restaurants."
To access to the free report, visit Restaurant Labor Force Report.
Snacking as 'Meal of Choice'
Only 27 percent of Americans today eat three square meals a day, opting to often graze on a variety of snacks instead. Whether at home, at work or on the go, "snack meals" are on the rise.
In revealing that 86 percent of Americans have eaten snacks in place of meals, the new national survey of 2,000 adults (ages 18 and over), commissioned by Farm Rich, also found:
- The average person today eats two meals and three snacks each day
- Men more likely to still consume traditional three meals a day
- Almost half (49 percent) say they replace lunch for snack meals
- Peak snacking hours are between 1 and 4 p.m.
- 81 percent consume snacks while at home
- The average person eats five snack meals each week
- 45 percent prefer the microwave when preparing heat-and-eat snacks over conventional oven, toaster oven, air or deep fryer
"The growth of digital streaming and desire for quick foods that fuel us have led to an increase in snack consumption, especially at home," said Shannon Gilreath, Director of Marketing, Farm Rich. "People are no longer feeling bound to the traditional three meals a day, which gives them more variety and time back to do the things they enjoy most, and for many, that doesn't involve a ton of time in the kitchen, especially on busy days."
Millennials are most likely to support the idea that "three standard meals a day is a thing of the past," consuming snacks in place of a meal at least six times a week and eating at least six snacks while on the go during that time. Two in five reach for snacks to fuel them throughout their day, compared to one in five older adults (55 and older). Instead, 60 percent of older adults use snacks to curb cravings.
While 49 percent turn to snack meals due to a lack of time for planning and prep,
- 35 percent say they eat snack dinners to reduce food waste
- For 31 percent, snack meals offer more quick variety
- 33 percent shop the freezer aisle at least once a week
"Snacking gives flexibility to busy families and individuals with untraditional schedules," Gilreath added. "This shift toward enjoying an all-snack meal or snacks on the go speaks to changing lifestyles, and the grocery freezer is a great resource for foods that offer the ease, long shelf life, variety and sustenance people sometimes need."
Other findings:
Top 10 Foods That Make Up Small Plates or 'Snack Meals'
- Cheese
- Crackers
- Fruit
- Chips
- Nuts
- Veggies
- Yogurt
- Sweets
- Pretzels
- Frozen Mozzarella Sticks
Top Five Reasons to Snack
- Cravings
- Taste/Flavors
- Enjoyment
- Fuel/Energy
- Boredom
The survey was conducted in August 2018 by OnePoll, with a sample of 2,000 adults aged 18+ years. For a short survey video, click here or visit FarmRich.com for more information.
Word of Mouth Matters
- When choosing a restaurant, Gen Z and Millennials are 99 percent more likely to rely upon social media and online reviews than are Gen X and Boomers.
- When choosing a restaurant, 50 percent of Americans rely on recommendations from friends and family.
- Americans value word of mouth recommendations from friends and family 41 percent more than social media recommendations.
- 55 percent of Americans make product or service recommendations to others at least once per month.
Download the full report here.
Spirited Trends
As the spirits industry booms – with U.S. consumers drinking almost $44 billion worth of product in 2017 – strategy consulting firm L.E.K. Consulting released a new report based on their research identifying the most striking trends in the space.
Most noteworthy is that the already booming spirits market is only projected to grow. U.S. consumers are expected to consume $58 billion worth of spirits per year by 2020, at an annual growth rate of 6%. And the spirits industry is relatively unaffected by economic downturns: During the 07-08 recession, the industry still grew, though at a more modest rate.
Some of the other most noteworthy trends in the spirits industry are…
- Ecommerce and direct-to-consumer (DTC) sales are on the rise. There are a lot of different DTC business models cropping up: distilleries are selling directly to consumers at a physical location or online, third-party cocktail clubs are gaining popularity in “cocktail culture” and ecommerce delivery platforms that deliver liquor purchased from local retailers directly to consumers.
- Millennials are a key demographic. Even though only 29 percent of the drinking-age population are millennials, they comprise 32% of spirits consumption by value. And as the buying power of millennials increases as they advance in their careers, this trend is only set to become more relevant to the space.
- “Drinking in” is now in. There are a lot of factors going into this trend, including a wealth of deals on spirits in the retail space, and millennials refusing to pay for the mark ups that are the norm at bars.
- Premium products are outpacing their mid-to-low shelf counterparts, especially among millennials. Specifically, from 2012 to 2017, high end spirits sales grew 6-7 percent per year by volume.
- Craft spirits are the next big thing. The number of craft distilleries has increased around 35% per year since 2011 and the craft spirits market has grown 19 percent per year since 2015.
“Additionally, major brands, such as Maker’s Mark and Roca Patron, are seeing the big future opportunities in the craft spirits space and are developing products to capitalize on this trend,” says Rob Wilson, Managing Director at L.E.K. Consulting and report author. Wilson adds, “Also of note, consolidation and M&A activity in the spirits industry has been high, with over 25 deals since 2014, and this is expected to continue through 2018.”
Finishing off the trends identified in the report: whiskey, tequila, brandy and cognac are outperforming other types of liquor; and smaller, more portable packaging is increasingly becoming the norm for spirits.
Best States for Allergy-Friendly Dining
AllergyEats announced its inaugural list of the Best States for Allergy-Friendly Dining.
The 10 Most Allergy-Friendly States (plus D.C.) for Dining Out with Food Allergies
1) Delaware
2) District of Columbia
3) Maine
4) Massachusetts
5) New York
6) Vermont
7) Florida
8) Rhode Island
9) South Carolina
10) New Hampshire
The 5 Least Allergy-Friendly States for Dining Out with Food Allergies:
1) Oklahoma
2) Kansas
3) West Virginia
4) Utah
5) Texas
These rankings are based on the compilation and averaging of all AllergyEats restaurant reviews into state-specific allergy-friendliness dining out scores. The scoring is based on a 5-point scale, with the best ranked state earning a score of 4.30 versus the worst at 3.46.
“While each state certainly has its share of allergy-friendly restaurants, as well as those that are not so friendly, there is a stark difference in the general level of accommodations by restaurants in the best versus the worst states on this list,” Paul Antico, Founder and CEO of AllergyEats said. “The results also paint a fascinating picture about food allergy-friendliness across the various regions of our country, particularly between the Northeast versus the Western U.S.”
Allergy-Friendly Restaurant Rankings by Region (Continental U.S. Only)
1) New England
2) Mid-Atlantic
3) South
4) Midwest
5) West
6) Southwest
“The difference between the average food-allergic diner rating of restaurants in New England and the Mid-Atlantic versus the Southwest and West is quite significant,” Antico said. “While one can only speculate as to the cause of this difference, there definitely appears to be a greater focus on advocacy, restaurant training, and food allergy restaurant laws in the Eastern U.S. We are hopeful that this list can provide an impetus for greater efforts in those regions currently lagging, continuing a trend of improving allergy-friendliness by restaurants across the country.”
Consumers Want More Fish
Americans and Brits are increasingly saying "I'll take the fish," according to new research from Cargill.
In its latest Feed4Thought survey, Cargill found that, over the past five years, 44 percent of American and British consumers surveyed had added more fish to their diets. Poultry came in a close second, followed by beef and pork.
"More and more people are choosing fish as a source of protein because of its big impact on health and relatively small impact on our planet," said Dan Burke, group director for Cargill's aqua nutrition business in the U.S. and U.K.
Nearly three-fourths of the consumers surveyed said they choose to eat fish for health reasons—and that number increased with a person's age. Fish is low in saturated fats, carbohydrates and cholesterol and high in a range of essential micronutrients, including vitamins, minerals and omega-3 fatty acids, according to the World Bank.
When it comes to health and environmental impact, nearly half of the respondents in the U.K. and one-third of those surveyed in the U.S. said there was no difference between farmed and wild-caught fish. The European Food Safety Authority agrees there are no consistent differences in the safety or nutritional value of wild and farmed fish, and both wild and farmed salmon have low levels of environmental pollutants, according to the Washington State Department of Health and Norway'sNational Institute of Nutrition and Seafood Research.
Keeping fish healthy was ranked as the most important duty of a company committed to responsibly raising seafood. Cargill notes this is increasingly important to its customers too, which is why the company is developing innovative feeds and solutions that help animals stay healthy in the farm environment. As part of an integrated health management system, connecting farmers, feed companies and veterinarians, these allow for a proactive focus on fish health.
"We're also seeing growing interest in wholesome food production," says Brian Knudson, strategic marketing and technology director for Cargill's aqua business, "That's why Cargill is expanding its micro nutrition business—focused on products that work with an animal's natural biology to improve their overall health and wellbeing, and reduce the need for antibiotics in aquaculture."
Cargill recently acquired global animal health company, Diamond V, and has a strategic partnership with Delacon, the world's leading maker of plant-based phytogenics. Both reinforce the company's focus on fish health.
Healthier fish mean better resistance to disease, less reliance on antibiotics and more efficient use of feed. Survey respondents indicated the importance of these sustainability attributes as they confirmed that using resources responsibly and minimizing impact on the environment should be priorities for the responsible fish farmer. Cargill supports this priority as an active member of the Global Salmon Initiative (GSI), a group that propels innovation and improved sustainability performance in the farmed salmon sector using a pre-competitive model of collaboration.
One trend to note for the aquaculture industry: younger generations polled looked beyond the health of the fish and the environment to the overall societal impact of seafood farming. For Americans, this surfaced as an expectation that the seafood farm will help local communities. In the U.K., younger generations prioritized the treatment of seafood employees.
"We prioritize listening and responding to these expectations around responsible food, working with our value chains to deliver and communicate about healthy and sustainable seafood," noted Dave Robb, sustainability manager for Cargill's aqua business. "We're committed to leading a global transformation toward sustainable seafood production by offering better feed for our customers, a safer workplace for our employees and more sustainable, transparent operations that support thriving communities."