
MRM Research Roundup: Mid-May 2019 Edition
26 Min Read By MRM Staff
This edition of Modern Restaurant Management (MRM) magazine's Research Roundup features Mother's Day dining results from the team at QSR Automations, top restaurant industry concerns, technology's effect on day-to-day restaurant operations and 'The Truth about Dining Out."
Happy Mother's Day for Restaurants
Sales Stumble, Staffing Woes Remain
The upward momentum in restaurant sales halted again during April. Same-store sales growth was -0.4 percent, hence sales growth has now been negative during two of the last three months. Although these results were undoubtedly disappointing for restaurant operators, it is too soon to start worrying about a true downturn for the industry. These insights come from Black Box Intelligence™ data from TDn2K™, based on weekly sales from over 31,000 locations representing 170+ brands and nearly $72 billion in annual sales.
“April was a soft month for restaurants. Putting these results in context helps us remain cautiously optimistic about the current state of the industry,” said Victor Fernandez, vice president of insights and knowledge for TDn2K. “First, the industry was lapping over one of the strongest months in same-store sales growth last year. When taking in a longer-term view of sales, the two-year growth rate of 0.9 percent during April still reflects a growing industry. Furthermore, all months since October of 2018, with the exception of February which was plagued by extremely bad weather, have reported positive same-store sales growth when compared with the same month two years ago. The average for two-year sales growth during the previous twelve months was -1.6 percent.”
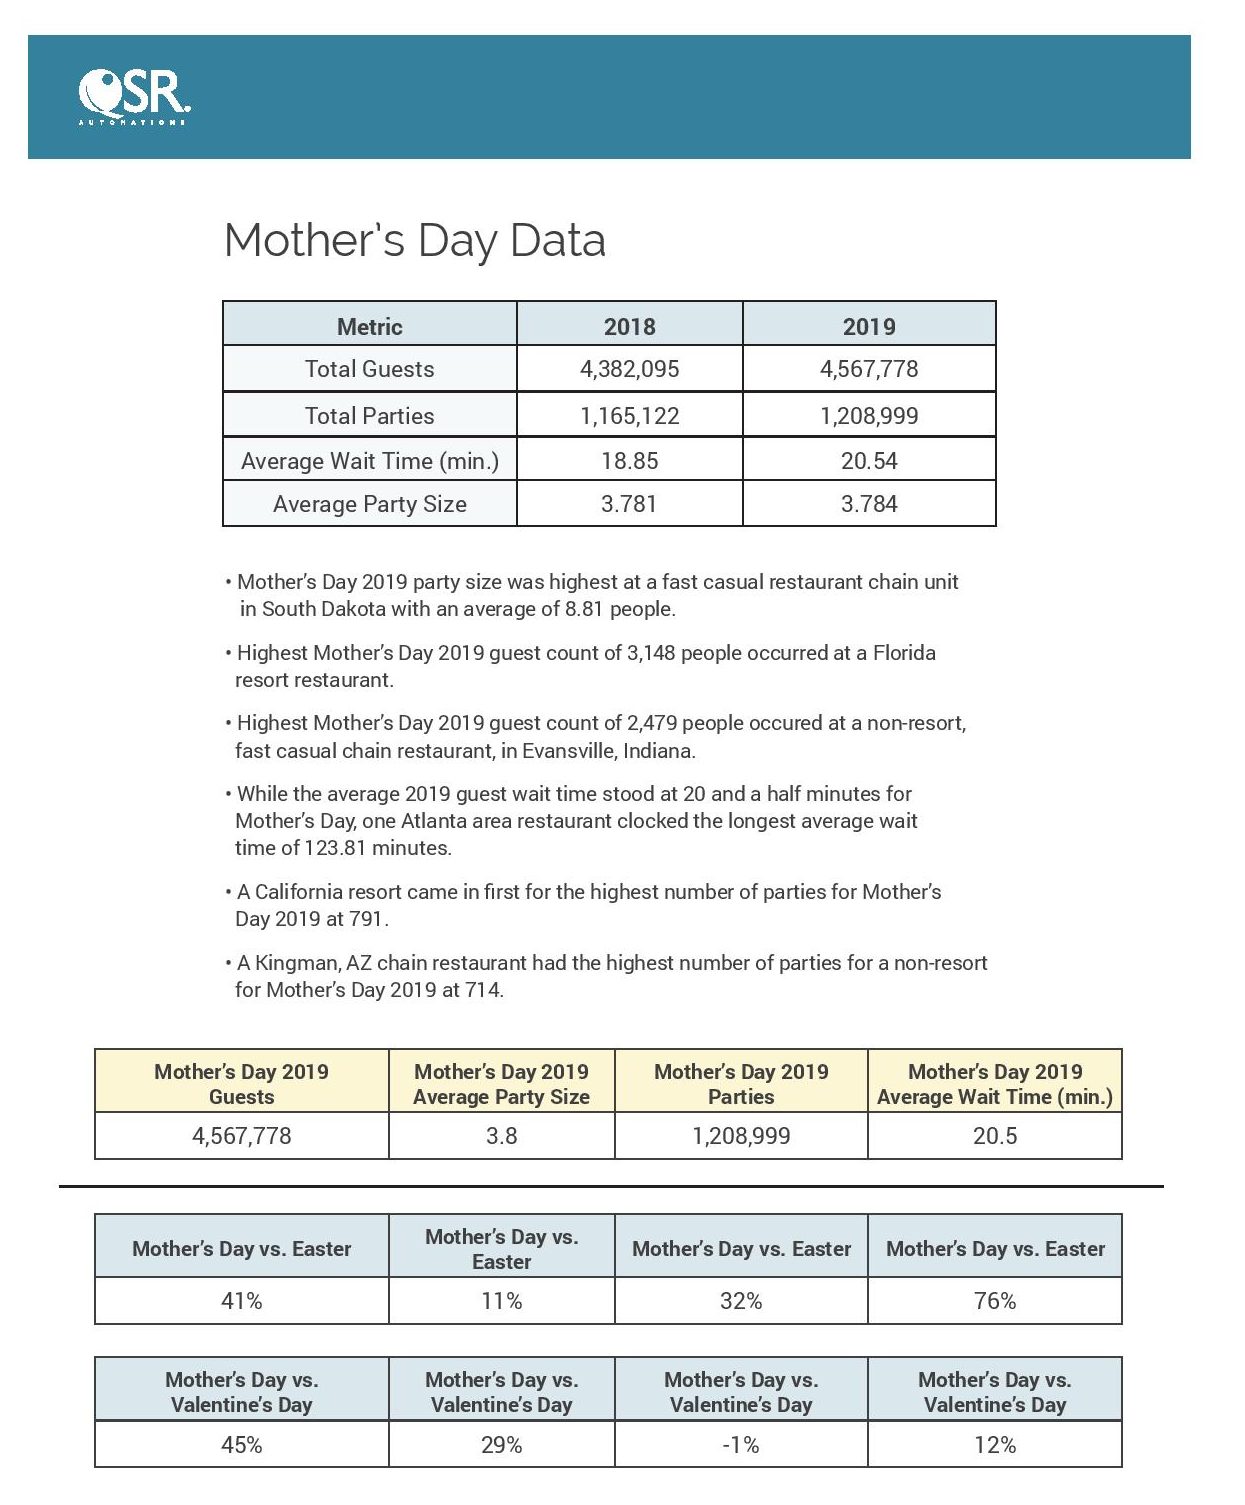
Additionally, April was negatively impacted by the Easter holiday. This holiday translates into decreased restaurant visits for many brands and in some cases, closed restaurants. This year Easter was celebrated in April but in 2018 it fell in March. As a result, same-store sales growth approached -2.0 percent during the week of Easter. This negative sales growth was the worst for the industry since the last week of February when winter storms severely hurt sales in large portions of the country.
Declining Guest Visits Remain the Norm For Most Brands, Guest Checks Accelerating
Same-store traffic growth during April was -3.5 percent, a decline of 1.6 percentage points from March. However, the Easter effect also needs to be taken into consideration for traffic. The third week in April also experienced the worst traffic numbers since the end of February. The holiday shift aided March’s guest counts but negatively impacted April’s.
These poor traffic results again highlight how restaurants continue to rely on their guests spending more per visit to try to grow their sales. Average guest check growth has been accelerating since the fourth quarter of last year. This is likely a result of restaurant brands raising their menu prices at a faster pace and a favorable shift in product mix driven by a more confident consumer.
Fine Dining and Family Dining Favored by Easter Holiday Shift
Fine dining and family dining were the two best performing segments based on same-store sales growth during April. These segments were also the most favored by their incremental Easter sales. Quick service was the only other segment that achieved positive growth during the month, despite a soft Easter week.
Consumer Spending Softened, Positive Economic Outlook Remains for Restaurants
“Despite what looked like a strong first quarter expansion in the economy, there were some warnings in the latest GDP report,” commented Joel Naroff, president of Naroff Economic Advisors and TDn2K economist. “Most importantly, the growth in consumer spending was the weakest in four years. There has also been a decline in the year-over-year growth in retail sales at restaurants. Is this softening worrisome? Maybe not. Incomes are still expanding moderately, consumer confidence is high and job gains remain strong. Thus, personal income growth is solid enough so that restaurant sales should improve. What is likely happening is the rebound in demand that began in 2018 and accelerated this year, is simply moving back toward sustainable levels.”
“Barring an all-out trade war, the economy should continue growing solidly the rest of the year. As labor markets tighten further, wage gains and household demand should pick up. Indeed, the only dark cloud is the elongated poor weather patterns that have restrained typical spring spending patterns. Since no one really knows how to forecast the weather, if we assume normal summer conditions, restaurant sales should accelerate.”
Rising Employee Vacancies Pose Threat to Restaurant Performance
Employee staffing issues give restaurant operators little reason to celebrate. TDn2K studies continue to feature service as the one consistent differentiator for top performing brands based on sales growth. Even if other attributes of the restaurant experience, such as food and ambiance, have fluctuated in relative importance, superior execution on service remains at the heart of what successful restaurant brands do consistently.
Yet, most companies are facing the toughest challenges in their history when it comes to staffing their restaurants, unquestionably at the cost of subpar service levels. According to TDn2K’s Workforce Index, vacancies have increased at a relatively consistent rate over the past several quarters as the number of unfilled unit level positions across restaurants escalates. During the first quarter of 2019, 35 percent of companies reported an increase in their unfilled management positions, while only 12 percent were able to reduce their vacancies. 38 percent of companies had an increase in their unfilled hourly employee positions and only 10 percent of them made any progress reducing their vacancies.
The drivers behind these staffing difficulties continued their pressure on the industry during March. Rolling 12-month turnover for both restaurant hourly employees and managers increased again, adding to the already historically high turnover rates experienced by the industry in recent quarters. Additionally, the industry continues to create new jobs that need to be filled at a rapid pace. Year-over-year growth in the number of restaurant employees grew by 2.7 percent during March, an uptick from the 2.6 percent growth rate reported for February.
‘Jittery’ Consumers Among Top Industry Concerns
Even though to date the economy remains relatively strong, the chain-restaurant industry in the year ahead faces a consumer base that is starting to show signs of possible fatigue plus multidimensional labor issues made even more complex by the strong economy of recent years—in particular, low unemployment—itself. Those are among the findings in a survey of more than 1,000 U.S. consumers, released today by AlixPartners, the global consulting firm.
On the labor front, the survey finds that 59 percent of consumers are in favor of raising the minimum wage to $15 an hour, which is more than double the current federal minimum of $7.25 per hour—and which would undoubtedly cause restaurant operators to rethink business models whose profit margins are already razor-thin. Moreover, a whopping 68 percent of millennials, the poll finds, are in favor of such a wage hike, indicating that the “Fight for 15” (and perhaps more) issue is unlikely to go away anytime soon.
Meanwhile, results from the survey reveal several signs that financial concerns seem today to be taking precedence when it comes to decisions both about dining-out to begin with and how much to spend when they do. For instance, among those who expect to dine-out less often in the year ahead, consumers were given the option of pick as many reasons as applicable among 15 in total. The result? Those choosing a financial concern—as opposed to such things as restaurant service or predictable food—was up eight percentage points net versus responses to the same question in an AlixPartners survey fielded a year ago. In particular, in this year’s survey 49 percent said they plan to reallocate savings toward purchases other than restaurant meals, 30 percent said restaurant meals are too expensive, 30 percent said their current finances mean they need to cut back on spending, and 15 percent said they’re concerned about their future financial situation.
In addition, the survey finds that millennials may be impacted more than older generational cohorts by economic worries, as the percentage who plan to spend $10 to $30 per meal is down in this year’s survey (to 55 percent, from 57 percent in last year’s) while the percentage that plan to spend $10 or less per meal is up (to 42 percent, from 40 percent). The survey also finds 38 percent of consumers plan to use discounts, such as coupons and promotions, to reduce their restaurant spending in the year ahead, down from 46 percent in the survey of a year ago—a sign that discounts are perhaps losing their allure. And, in perhaps another sign of caution, the survey also finds that among those planning to reallocate their restaurant spending on other things, 35 percent said they’d reallocate toward retirement (of the eight options available), up two percentage points from last year’s survey—while 38 percent said travel, down three points from the year-ago survey.
“The restaurant consumer today is jittery, and for good reason,” said Adam Werner, global co-head of AlixPartners’ Restaurant, Hospitality and Leisure Practice and a managing director at the firm. “The economy—which, of course, drives so much of restaurant spending to begin with—looks great in the rear-view mirror, but what lies ahead is uncertain, and our survey results reflect that consumers are very aware of that.”
“Whether it’s the minimum wage, staffing and hours, or even automatic gratuities, labor issues in this industry are only going to get thornier and more complex,” said Kurt Schnaubelt a managing director in AlixPartners’ Restaurant, Hospitality and Leisure Practice and one of the authors of the survey. “Operators need to use strategic pricing to put value right on the menu to begin with, and they need to have a toolbox of strategies to deal with all the labor issues coming their way. Given the pennies-on-the-dollar margins in the industry today, there is no alternative.”
The Tech Effect
US Foods Holding Corp. released the results of a survey of 500 independent restaurant decision makers to gauge their outlook on critical operational decisions. Although half of restaurant decision makers think technology is a way to address food waste, manage staff and drive customer traffic, only one-third of them are implementing it.
“This gap between the promise and adoption of technology to run restaurants successfully is an important one to close,” said Adam Stinn, director of business solutions for US Foods. “There is a universe of technology solutions that can reduce the operating headaches. But that’s also the problem – the number of choices and the time it takes to sort through them. Through our CHECK Business Tools program, we have taken the guesswork out of the equation by helping operators diagnose the opportunity and invest in the right solution. Whether it’s a website upgrade, online ordering or back of the house efficiency, we have vetted hundreds of solutions to bring our customers the right technology to solve their biggest challenges.”
There are three primary areas in which independent operators have identified the biggest opportunities: driving customer traffic, simplifying staffing and reducing food waste. US Foods’ survey further explores restaurant decision makers’ views on these topics.
Driving Customer Traffic
It’s no surprise that in today’s shifting digital world, the way restaurants attract new customers has changed. According to the survey results, a quarter of restaurant decision makers feel that attracting customers has gotten harder in the last year.
Compared to a year ago, marketing decision makers are investing more into how they promote their restaurants, with 75 percent offering more specials for customers, 68 percent spending more on digital advertising, 67 percent hosting more events and 51 percent using third-party services. Most marketing decision makers (80 percent) said keeping up with the competition’s marketing efforts was important to them.
To help drive online and in-store customer traffic, US Foods offers a suite of solutions through CHECK Business Tools, including menu design support to drive profitability, online ordering capabilities for to-go sales and website design support.
Staffing Can Be Stressful
Thirty-five percent of restaurant operators say that they currently have job openings that are proving hard to fill.1 So it’s no surprise that US Foods’ survey found that half of restaurant decision makers named hiring, training or managing staff as their greatest sources of stress.
Forty-nine percent also expressed concern about a labor shortage in the restaurant industry, and only 59 percent felt confident in hiring skilled employees. Further, only 20 percent said they were increasing their recruiting efforts and only 30 percent were creating robust employee training programs.
To help solve for these staffing challenges, CHECK Business Tools can help operators optimize key restaurant staffing processes including team management, scheduling and staff training so operators can recruit quality candidates, track labor expense, simplify payroll, and attract and retain quality staff.
Fighting Food Waste
Waste is a costly part of running a restaurant. More than a third of food in the U.S. is lost or wasted, which amounts to 133 billion pounds or $161 billion worth of food each year.2 According to the US Foods survey, 79 percent of restaurant decision makers are at least somewhat concerned about food waste in their restaurant, but they struggle to prioritize and act on their concern, citing inefficient food preparation (36 percent), the inability to accurately forecast demand (35 percent) and portion sizes (34 percent) as the main drivers of waste in their restaurants.
Three in five (58 percent) food decision makers say they are tracking some things related to food waste but know they could be doing more to meet their goals. Meanwhile, only about a third (30 percent) have a formal process in place to track their goals.
'Truth about Dining Out'
Fourth revealed the findings of its first annual “Truth about Dining Out” survey. With the goal of providing restaurant operators an inside look at how Americans prefer to eat out, the survey, conducted by OnePoll and commissioned by Fourth, shows that quality of service is oftentimes more important than the actual meal among respondents who dine out. The survey results reinforce that engaged staff are happier, provide better service, create loyal customers and increase sales.
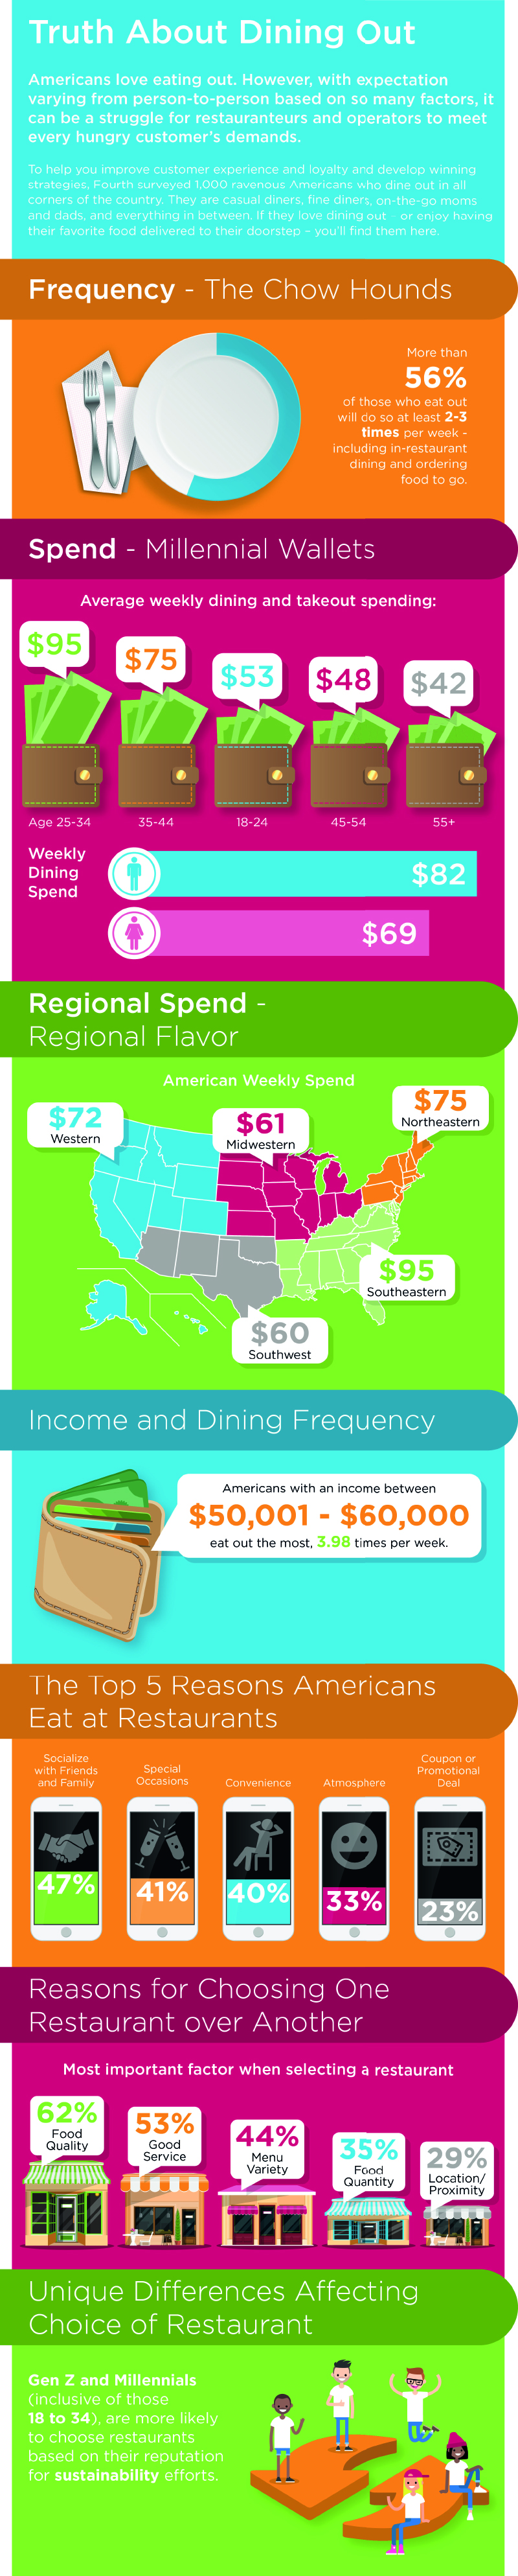
Americans Love Eating Out
With a strong U.S. economy, consumers continue to spend money eating out rather than cooking meals at home. In fact, the survey results showed that more than half (56 percent) of respondents who eat out – which includes eating in restaurants, ordering food to-go and delivery – eat out at least 2-3 times per week. Additionally, 10 percent of Americans said they eat out 4-6 times per week, and 6 percent of consumers cited they eat out every day.
When broken down to gender, the survey found that men typically spend more per week eating out ($82) while women spend $69. In fact, 10 percent of men eat out every day compared to only 2 percent of women.
Respondents who earn between $40,001 – $50,000 per year spend the most money eating out, averaging $117.82 per week or between 12.25 percent to 15.31 percent of their yearly income.
The survey also examined, through multiple-answer questions, why consumers eat out at a restaurant. Forty-seven percent of respondents selected “social, spending time with family and friends” as the main reason, followed by “special occasion” (41 percent), “it’s convenient” (40 percent) and “I enjoy the atmosphere” (33 percent).
Gordon Ramsay – America’s Favorite Celebrity Chef
With the ongoing popularity in celebrity cooking shows and competitions, the survey asked respondents to select their favorite celebrity chef. According to the results, Gordon Ramsay took the number one spot with 11 percent of the votes, followed by Anthony Bourdain (7 percent) and Bobby Flay (6 percent).
Gordon Ramsay was the favorite celebrity chef among respondents between the ages of 18-54. Surprisingly, Emeril Lagasse was the top pick for respondents who are 55 and older.
When broken down to region, respondents in the West selected Anthony Bourdain (13 percent) as their favorite celebrity chef with 13 percent of respondents citing “known celebrity chef” as an important factor when selecting a restaurant.
Customer Loyalty Begins with a Smile
As restaurants compete for customers, providing superior service is no longer an added bonus, but expected. More than half of survey respondents (53 percent) cited “good service” as the second most important factor when selecting a restaurant following “food quality” (62 percent), which received the most votes.
When determining a server’s tip, 58 percent of respondents cited “friendly and pleasant demeanor” as the most important factor followed by “attentiveness” (50 percent) and “accuracy of order” (44 percent).
Nearly a third of respondents (30 percent) cited “rude restaurant service” as their biggest frustration when eating out at a restaurant.
When asked to pick one thing that you would generally change in restaurants, the majority of open-ended responses included complaints around bad service.
When discovering new restaurants, 59 percent of respondents rely on “friend recommendations,” followed by “social media” (46 percent), reinforcing that great customer service and maintaining a good online reputation is key to driving sales.
Third-Party Delivery Services are on the Rise
To accommodate consumer demand, restaurant operators are turning to third-party delivery services to manage the ordering, payment and delivery of meals. But with so many options available, it can be hard for a restaurant operator to keep up. Understanding this pain point, the survey asked respondents to select which delivery services they used most often. According to the results:
Among third-party delivery services, Uber Eats was selected as the most popular (31 percent), followed by DoorDash (27 percent) and GrubHub (24 percent).
When asked what your main reasons for using third-party delivery services are, 50 percent of respondents cited “convenience,” followed by “ease of payment” (42 percent) and “good customer service” (40 percent).
A quarter of respondents (25 percent), cited that they use third-party delivery services because they’d rather place their order online or via an app than talk to someone on the phone.
Surprisingly, the restaurant’s in-house delivery service was the second most used delivery service (29 percent) among general respondents and the number one delivery service used by respondents in the Southeast (28 percent) and Midwest (35 percent), proving that in-house delivery is still popular.
Room for Improvement
Although Americans enjoy eating out, there are a number of factors that can contribute to a negative experience. To enable restaurant operators to better understand the expectations of today’s restaurant patrons, the survey asked respondents to disclose their biggest frustrations when eating out at a restaurant and having food delivered. The survey results showed:
When eating out at a restaurant, the top five frustrations for survey respondents include “the time it takes to receive their order” (35 percent), “the price of the meal and getting an order wrong” (34 percent), “not being satisfied with the quality/taste of food” (31 percent), “rude restaurant service” (30 percent) and “restaurant cleanliness” (25 percent).
When having food delivered, the top three frustrations were “the time it takes for the food to be delivered” (20 percent), followed by “the condition of the food” (18 percent) and “missing items from my order” (14 percent).
“Having been in the hospitality industry for more than 30 years, it’s interesting to see how quickly customer expectation can be changed,” said Simon Bocca, chief operating officer at Fourth. “It’s clear from the survey results that customer service and a tight back-of-house operating system are key to optimizing profits. We’re excited for the future of the industry and to continue to help restaurant operators enhance guest satisfaction and scale profitably by ensuring they have the right amount of labor and inventory on hand to deliver a great guest experience – every time.”
Download the free eBook here.
The Catering Opportunity
ezCater®, published The Catering Opportunity: Understanding a $60+ Billion Market, a comprehensive report on the U.S. catering market with in-depth data and insights to help restaurants develop successful catering strategies.
The report combines insights from a new survey conducted in partnership with Technomic, a leading foodservice industry research firm, with data from millions of orders placed on the ezCater Marketplace. Technomic surveyed more than 450 foodservice leaders representing 45,000 restaurant locations on their attitudes about, experience with and investment plans for catering.
Key findings include:
Catering is growing: Catering is growing 50 percent faster than the overall restaurant industry, with business catering driving much of the growth.
Catering is important: 90 percent of restaurants consider catering important to their business.
Catering is worth the investment: 91 percent of respondents who reported increasing catering revenues are investing in their catering operations, with top investments in personnel (34 percent), technology (25 percent), and marketing (24 percent).
Catering is in demand: Demand for catering is coming from a wide range of industries, with healthcare, finance, IT/technology, advertising and construction among the top 10 sources of orders.
Catering is big: The average check size of a catering order is $283.
Catering is profitable: Large orders drive efficiencies in food and labor costs, which drive a larger portion of dollars to the bottom line than smaller consumer orders.
“Catering is different,” said David Meiselman, Chief Marketing Officer at ezCater. “It’s huge, it’s driving significant incremental profit and it’s growing fast. Our goal for this report was to shine a light on what sets catering apart, what business catering customers want and which catering investments are being made by the brands that are growing the fastest in the market. We’re excited to provide restaurant operators with critical insights to help build and grow profitable catering businesses.”
To download The Catering Opportunity: Understanding a $60+ Billion Market, click here.
The Burger v. Chicken War
Burgers have been a top item ordered at U.S. restaurants for decades but chicken sandwiches have come on strong over the last several years. There are more chicken sandwich restaurant concepts and chicken sandwiches are appearing on more menus. So have burgers been knocked off their perch by chicken sandwiches? “No,” says The NPD Group, which daily tracks U.S. consumers use of restaurants and other foodservice outlets. Burgers still rule the roost and are the top sandwich ordered overall.
By the numbers, the average number of times a buyer purchased a chicken sandwich over the 12-month period ending February 2019 was 8.7 times and the buyer purchase frequency of burgers was 14.7, according to NPD’s receipt harvesting service, Checkout, which can follow the same buyer over time. Burgers also have the upper hand when it comes to menu importance or the percentage of all restaurant orders that include one. Burgers are included in 14.1 percent of all restaurant orders and chicken sandwiches are included 6.5 percent of orders.
Although chicken sandwiches are #2 in the sandwich pecking order, they are gaining ground. Chicken sandwich servings ordered in the year ending February 2019 were up 4 percent from same period year ago at 4 billion servings. Burger orders, on the other hand, were flat from year ago at 8.6 billion ordered, reports NPD.
“Both burgers and chicken sandwiches are winners for foodservice and restaurant operators,” said David Portalatin, NPD food industry advisor and author of Eating Patterns in America. “Both are popular with consumers and both can be dressed up with different flavors and fixings to meet a variety of different tastes.”
Favorite Pub Grub
Sunday roast is Brits’ favourite pub grub.
- One in three Brits visit their local pub for a meal at least once a month (29 percent)
- Quality of produce is the most important part of eating out for almost half of Brits (43 percent)
- One in ten 18-24 year-olds visit their local pub several times a week for a meal
- Further information can be found here, and graphics can be downloaded for use here
A classic Sunday roast has been crowned Britain’s favourite pub grub, according to new research. Almost one in five of those surveyed admitted that they would choose a roast over any other dish on the menu (17 percent). Fish and chips were a close second (13 percent) followed by steak and chips (12 percent).
Britain’s top five favourite pub dishes:
1. Sunday roast
2. Fish & chips
3. Steak & chips
4. Hunters chicken
5. Scampi
Those in Belfast are breaking the mould with more of taste for food inspired from overseas. The club sandwich came out as top choice (20 percent), followed by lasagne (19 percent) and fish and chips (15 percent). The research, conducted by catering equipment supplier Nisbets, also looked at what Brits consider the most important aspect of eating out. Quality of produce is key for nearly half of Brits (43.5 percent), followed by value for money (33 percent). Although for 18-25s, 40 percent admit value for money is crucial. Aesthetically pleasing meals were of least importance to respondents – only 2 percent said this was the most important aspect of a meal in a pub restaurant. 25-34 year-olds are the most avid pub goers with 17 percent dining out several times a week, followed by one in ten 18-24 year-olds. Once a month is the optimum number of times for most age groups to visit the pub for a meal with one in three from every age group admitting they go this often.
The survey also asked Brits’ opinions when it comes to food presentation. 67 percent of those surveyed said that their preference is to have food served on plates rather than anything too gimmicky. Other causes of irritation were foods served in items of clothing eg. Bread in a flat cap, drinks served in shoes and being served sauce in a tray or not being served enough sauce.
Portion size is also a consideration for people when eating out with one in four Brits admitting that they eat more in a restaurant than they would at home. For those of us who struggle to finish the bigger portions, asking to take our leftovers home is something of a taboo with one in ten admitting they would be too embarrassed to ask.
Anne Betty, a registered nutritionist and owner of AB Food Nutrition said, “Everyone has their own individual requirements when it comes to food portion sizes. Generally, bigger, more active people can eat more calories without gaining weight whereas smaller, less active people need fewer calories. Portion sizes also depend on your hunger and fullness levels as well as your appetite – which changes from one day to the next.
“Studies have shown that if we are served a bigger portion, we will almost always eat more – because it takes time for the body to register that we are full. If you are given a large portion size when eating out, see if you can take some home with you in a “doggy bag” for another time. You could even try ordering a half portion, choosing a starter as your main meal or splitting a dessert with a friend.”
Dean Starling, Head Development Chef at Nisbets, commented on the findings, “As a nation, eating out at our local is something most of us enjoy. A Sunday roast is the epitome of classic British cuisine so it’s not that much of a surprise it came out top of the list alongside fish and chips.
“It’s great to see that quality of produce is such a big factor for so many consumers as chefs are more conscious than ever of the quality and source of the ingredients they use. For consumers to be so aware just goes to show that this message about produce being key is filtering down. When it comes to presentation, consumers prefer a simpler approach – not too many additional extras on the plate and let the ingredients to do the talking.”
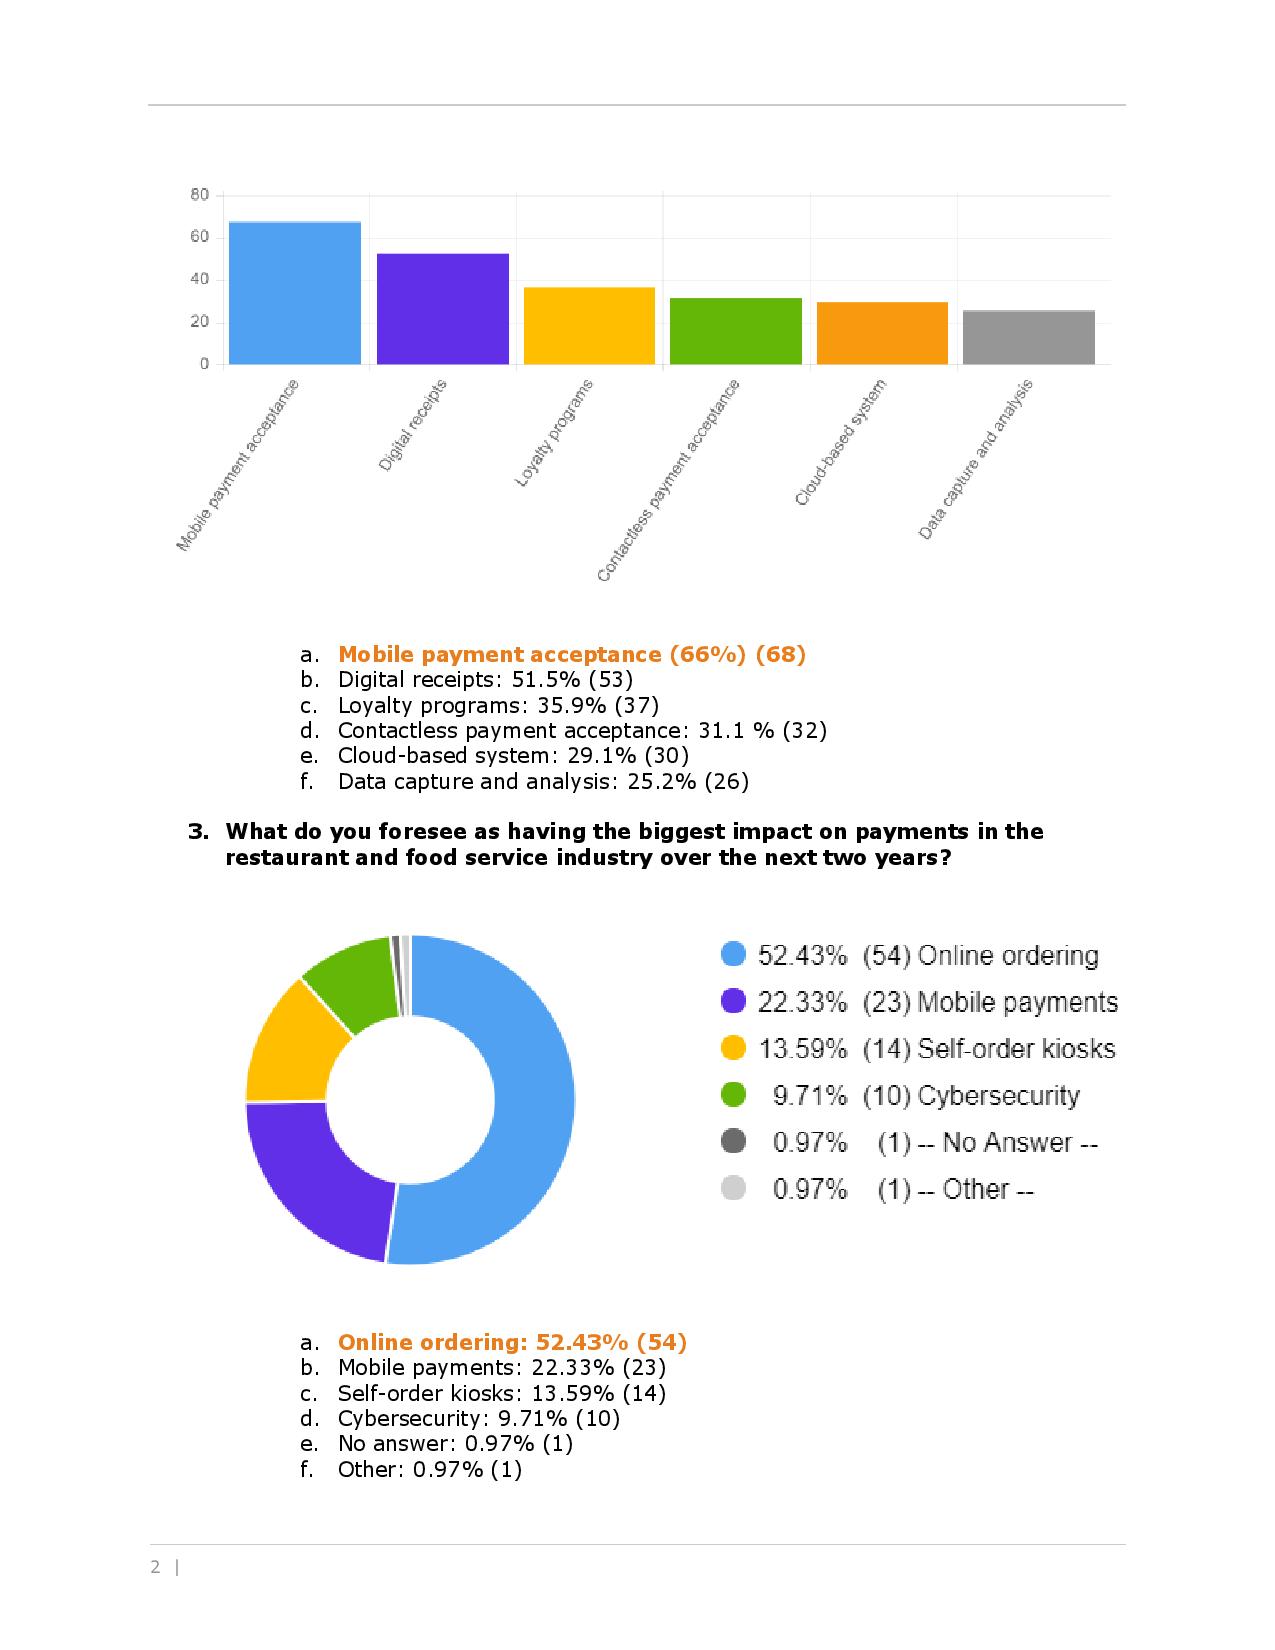
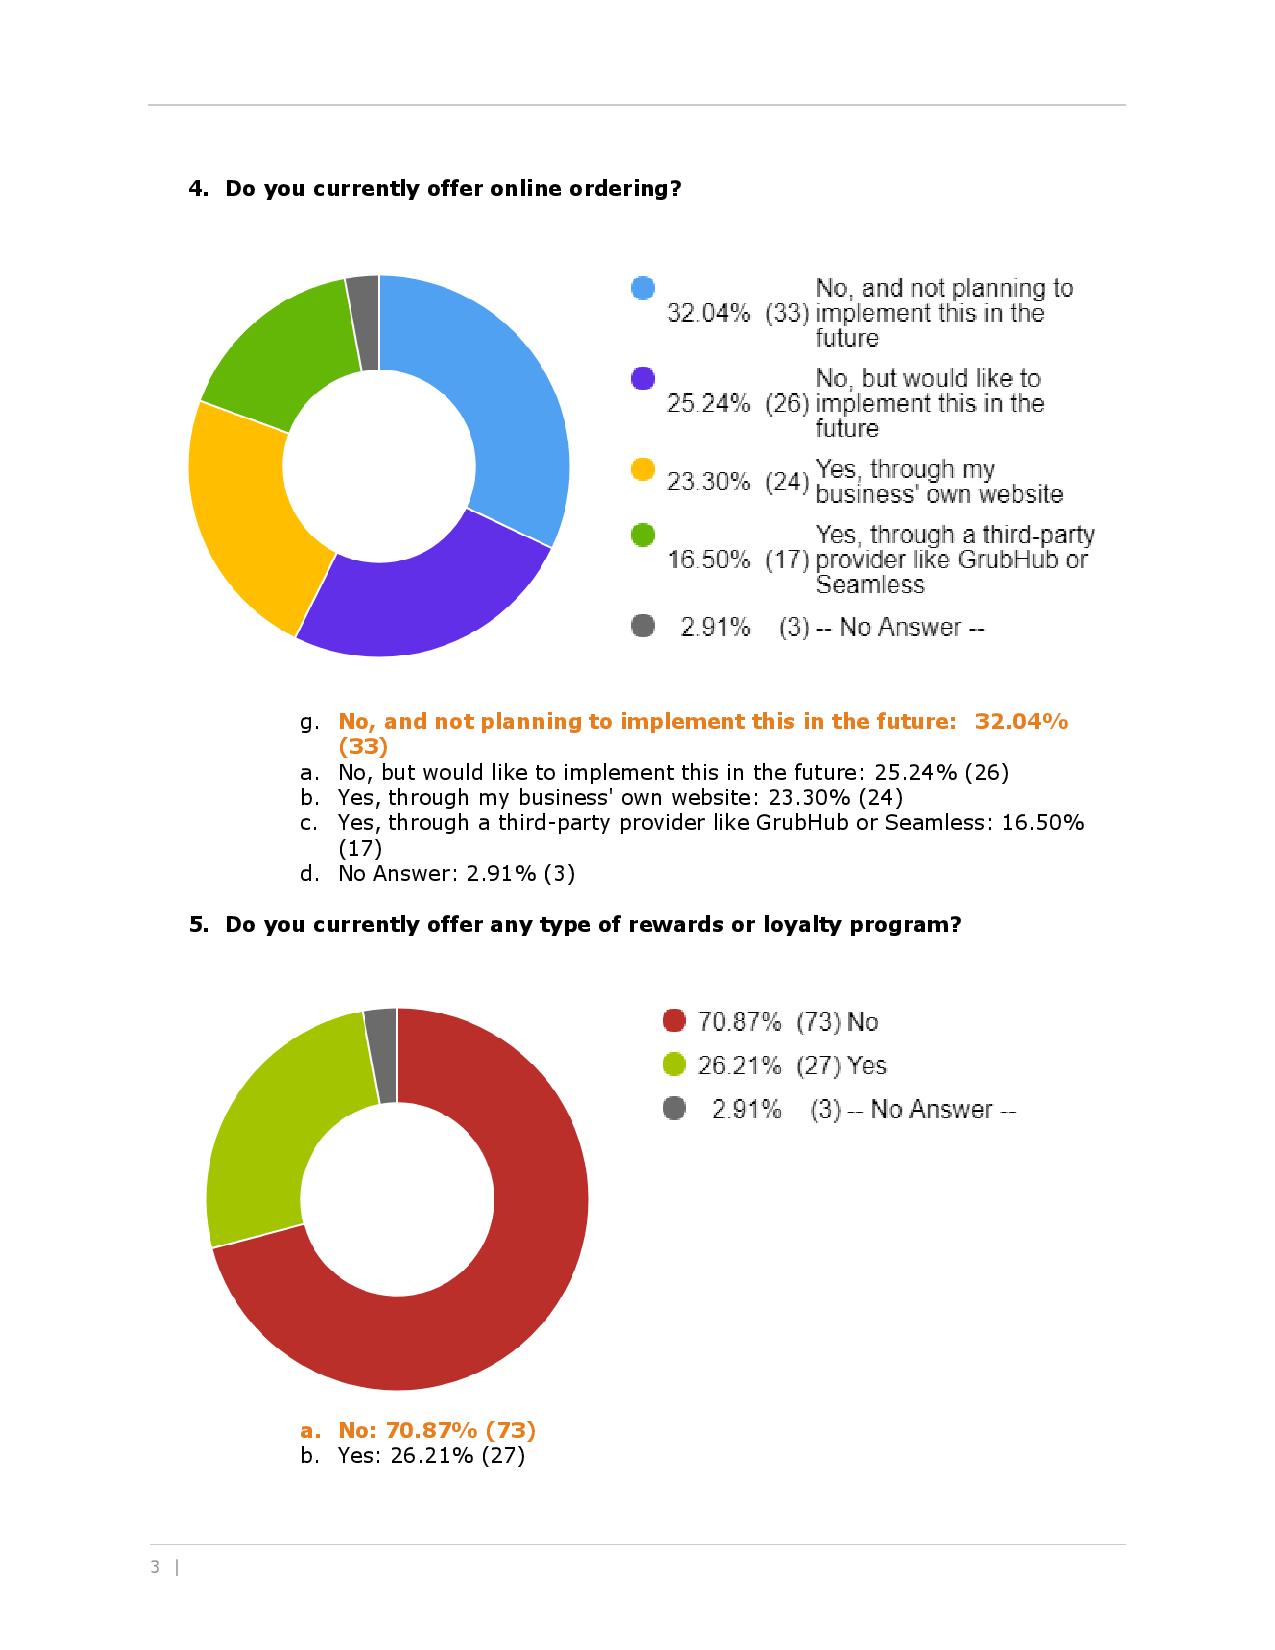
Owners Need to Adapt to Online Ordering
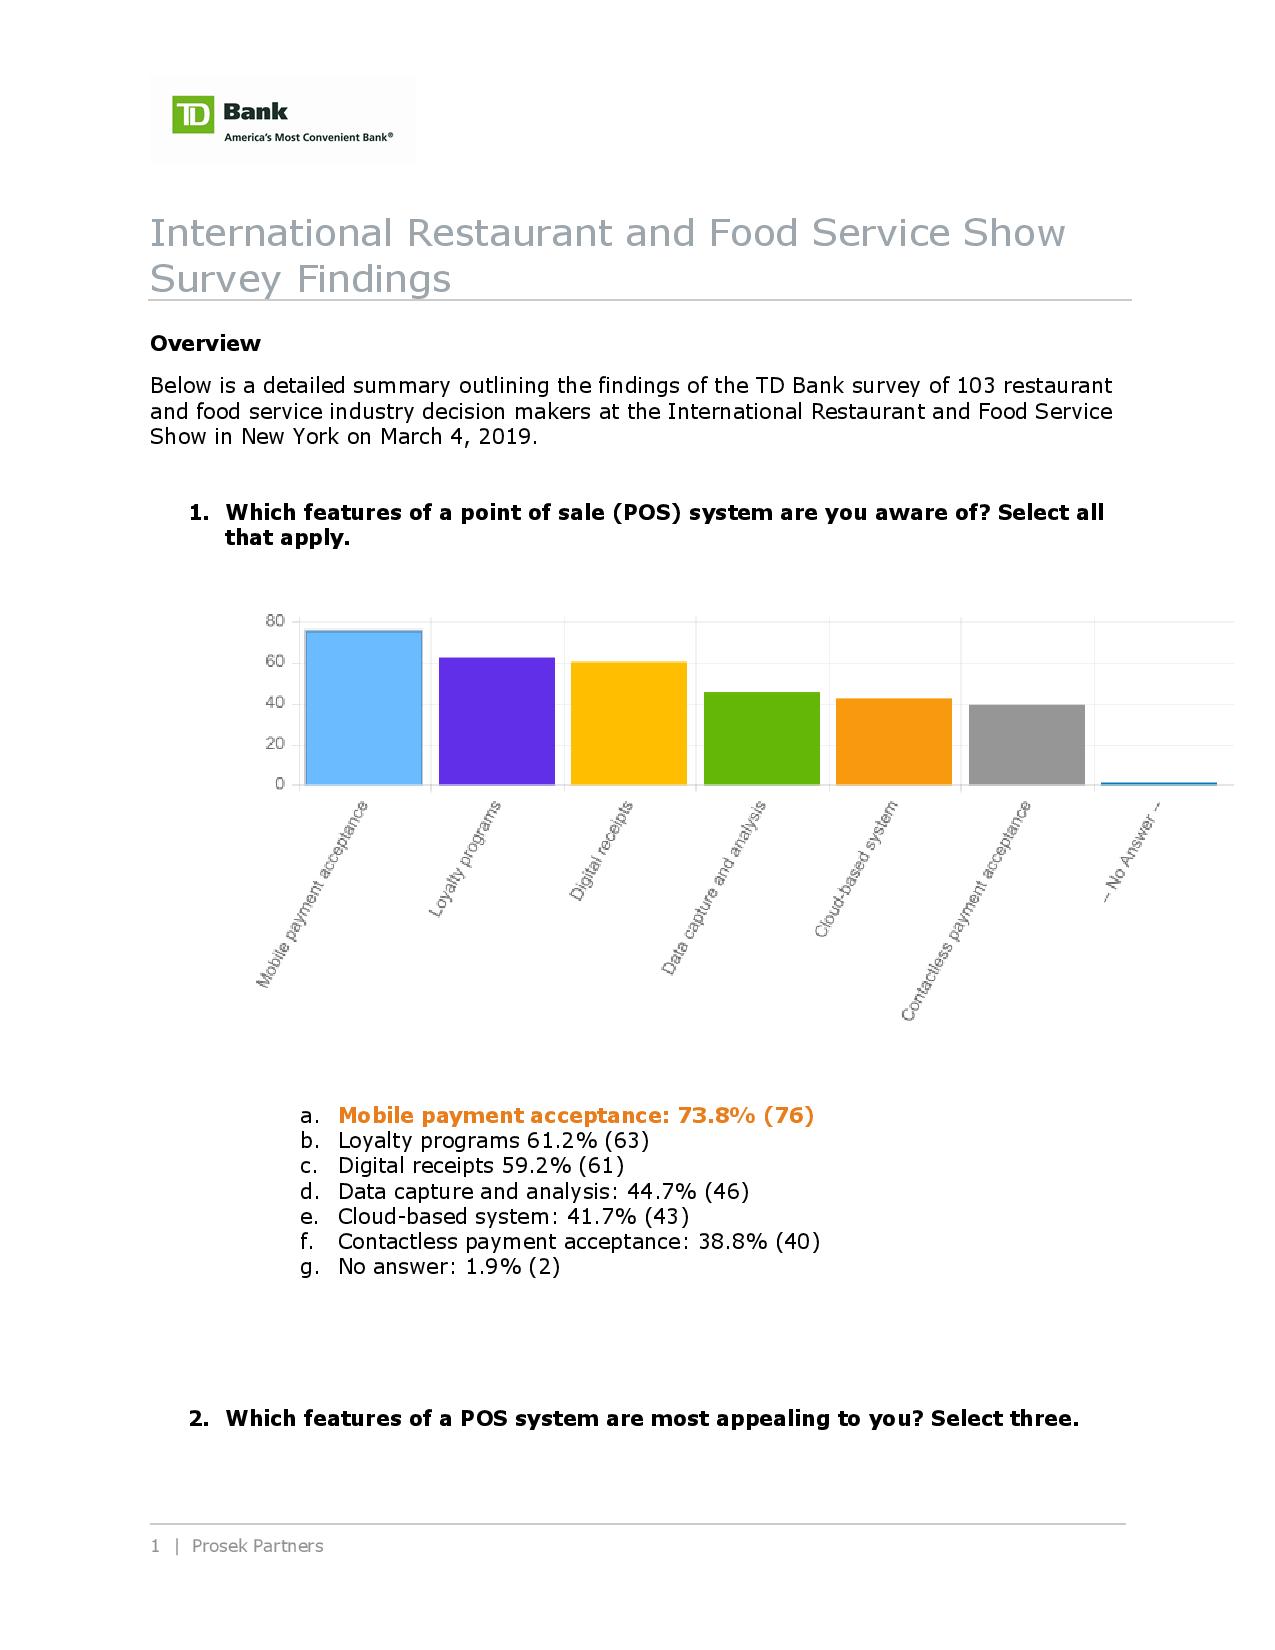
No one wants to deal with hangry (hungry & angry) customers, but restaurant owners who aren’t offering online ordering options might have to, unless they adapt. TD Bank recently surveyed food service and restaurant industry professionals at the International Restaurant & Food Service Show of New York, and over half (52 percent) of respondents see online ordering having the biggest impact on payments in their industry in the next two years (Amazon effect in full force). BUT: 57 percent aren’t currently offering this.
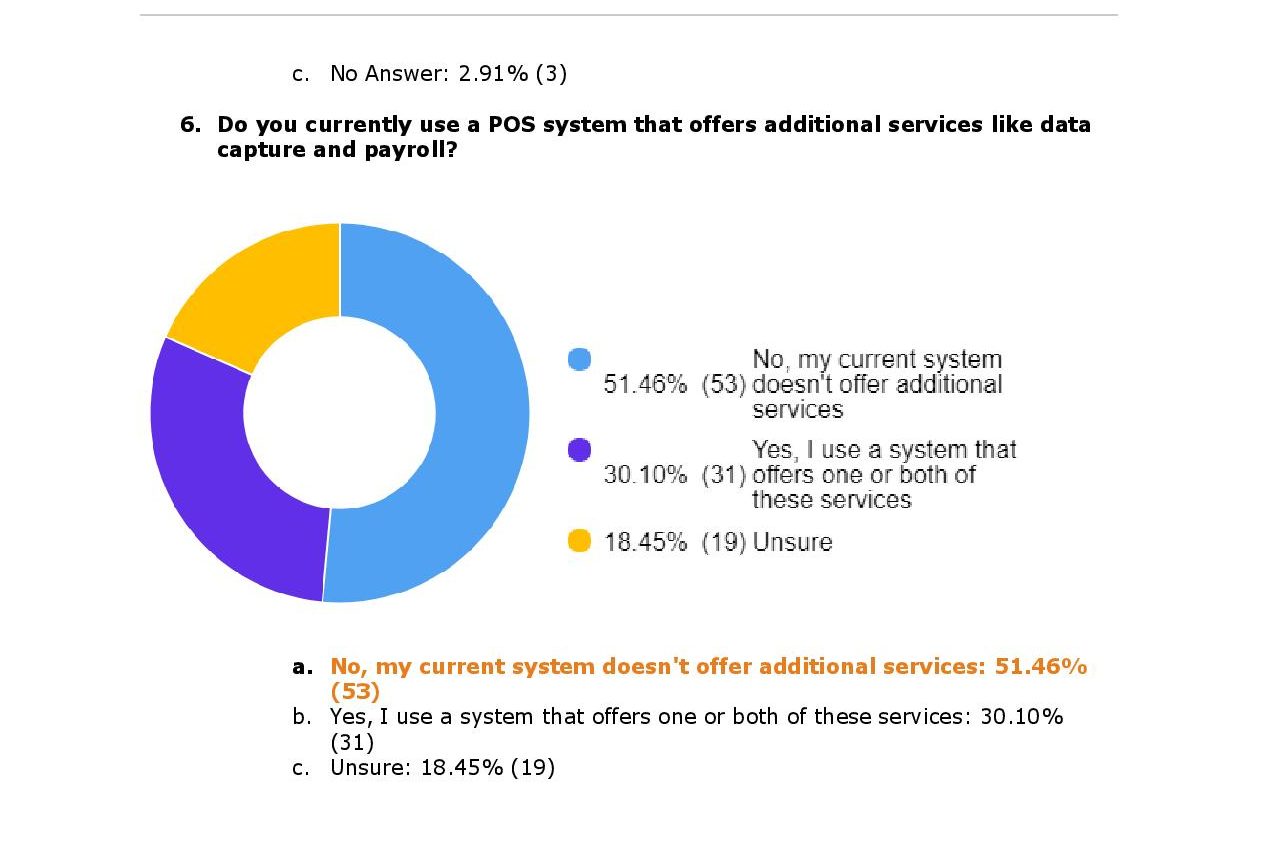
Key data points on point of sales (POS) systems and other payments trends are outlined below:
Mobilizing mobile: 74 percent of survey respondents identify mobile payment acceptance as the POS feature they’re most aware of. In addition to awareness, it’s also the most appealing feature of POS systems, according to more than half of respondents (66 percent).
Contactless what? Only 39 percent of respondents are aware that contactless payment acceptance is a feature of a POS system, and only 31 percent say the feature is the most appealing to them. However, contactless can significantly decrease checkout time and improve customer satisfaction.
Loyalty rewards – time for a makeover: This year, 71 percent of respondents noted that they do not offer any type of rewards or loyalty program, even though in 2017, over half of respondents agreed this would be beneficial to their businesses.
By capturing the value of loyalty programs, facilitating mobile optimization and leveraging emerging technologies to improve and implement online ordering capabilities, merchant solutions providers can help restaurant owners and other food service professionals meet customer expectations and keep up with industry trends.
The Cost of Food Safety
The financial risks and costs associated with food safety are increasing and food suppliers will face continued increases in food safety costs over the coming years. Until there is reliable traceability throughout the food supply chain, the advanced technology that enables faster identification of food safety issues is also increasing the likelihood of more broad-based food advisories being issued.
A new report from CoBank’s Knowledge Exchange Division explains why the stakes are rising for food suppliers in a landscape of continuously evolving food safety challenges, technologies and regulations.
“Contrary to media reports and trending social media, there has not been an increase in food related outbreaks in recent years. This is particularly noteworthy given technology developments, which allow us to better detect food safety issues,” said Crystal Carpenter, senior economist of specialty crops at CoBank.
While our ability to detect food related outbreaks has increased, until traceability improves, this improved detection increases the risk of future advisories, such as the romaine lettuce advisories in 2018.
An advisory is issued when consumers are cautioned not to consume a particular type of product due to a food safety concern, but a specific company or brand is not identified as it would be in a product recall. Carpenter said the unfortunate aspect of an advisory is that it casts a shadow of doubt on all suppliers of a product.
“The total impact of an advisory is much greater than a recall and reaches far beyond the company at the source of the contamination,” said Carpenter. “The entire industry can be negatively affected by an advisory.”
An increasingly complex food chain with many touch points and value-added products has increased the potential points of contact and opportunities for contamination. It has also increased the complexity of traceability. Within the produce supply chain specifically, the greatest challenge in traceability is often in the last mile as product gets closer to the consumer.
“Understanding the risks of food safety incidents, the costs associated with them, and risk mitigation strategies is becoming increasingly critical for profitability and long-term economic sustainability,” said Carpenter. “The financial and reputational implications of a food safety incident can be enormous, and the risk is rising.”
A brief video synopsis and the full report, “Food Safety Trends and Regulations – The Stakes are Rising for Food Suppliers,” are available here.
Why Canadians Choose Restaurants
A new Google survey of 1000 Canadians between the ages of 18 and 65+ explores the things that lead to restaurant selection with some interesting results. Restaurant owners find themselves in a highly competitive market, vying for customers' patronage. There are several contributing factors that lead Canadians to choose one restaurant over another. However, regardless of demographics, the most important factor seems to be based upon the best online reviews.
According to the findings of the survey, when asked what elements contributed to their choice of a restaurant, 39.2 percent of the 1000 respondents indicated that they would choose the restaurant with "the best online reviews".
Taking into account the overwhelming popularity of this response, business owners must realize that a favorable online presence is essential. With a selection of thousands of restaurants in any given urban center, it is difficult to filter the options. Seeing as the vast majority of people have a mobile device readily available at all times, the easiest and fastest method is simply turning to online reviews.
"The findings in the survey aren't surprising to me. A positive online presence is essential for the success of any company. Companies must accelerate digital growth, which attracts quality leads and generates sales.", stated Amine Rahal, CEO of Little Dragon Media.
Another interesting take-away from the survey findings: 21.9 percent of respondents stated that the deciding factor for restaurant selection would be close proximity to their location. Modern life has become increasingly hectic, making time a valuable commodity. When making a restaurant selection, the closest and convenient establishment is an important consideration for people. This perhaps explains why restaurants in busy downtown urban cores have a tendency to fair well, despite stiff competition.
A smaller, albeit still important group, 17.6 percent, stated that affordability was the most important element to their choice of restaurant. Yet interestingly, when demographic filters were factored, 25.3 percent of respondents between the ages of 18 to 34 said that affordability was key.
Another smaller group, 16.2 percent, responded that the most creative menu would influence their decision. However, this percentage increased with 65+-year-olds to 24 percent. Increasingly, dining out is not merely regarded as a means of satisfying hunger, but more about enjoying a culinary experience, especially with the older demographic.
The smallest group of respondents at 5.1 percent, said that an appealing website was what mattered in their decision-making. However, web design appears to be even more pertinent amongst 45 to 55 year-olds, given that 9.3 percent chose this response.
Canada has become a world-renowned on the international culinary stage for its unique, exciting restaurants. In any given urban center from coast to coast, new establishments are opening up, offering a near limitless array of food options for the most discerning palates. There are a myriad of factors that contribute to the success of a restaurant. Seeing as the competition is so fierce, restaurants must employ numerous strategies to increase patronage and thus, sales.
Click here for more information about the survey.
Customer Loyalty Landscape
Customer loyalty is big business and getting bigger. The new research report “Loyalty Big Picture,”from global loyalty expert LoyaltyOne, found that the total 2019 customer ecosystem is a whopping $323 billion. That loyalty landscape includes $126 billion in direct loyalty and customer relationship management, along with significant investment in technology and transaction enablers and customer engagement platforms.
And the loyalty industry is growing: 69 percent of C-suite executives reported that they’ve increased loyalty investment in the past two years, with more than half (55 percent) saying their investments will continue to grow over the next two years.
Increasingly, the value of loyalty and the insights garnered from customer loyalty strategy are influencing decisions across organizations, said Caroline Papadatos, Senior Vice President, Global Solutions for LoyaltyOne. In fact, while there might be a public perception that loyalty cards’ usage is waning, the opposite is true – their popularity is exploding, she said.
Companies are recognizing the value of using customer data for everything from product development and pricing optimization to real estate planning and even media. More than half of companies (61 percent) said they use loyalty data across at least three different departments, and a mere 2 percent of industry practitioners surveyed reported that loyalty data is used strictly by traditional departments like marketing and public relations.
“Executive teams see how programs can contribute to company valuation,” said Papadatos. “In fact, 88 percent of loyalty practitioners said their company leaders view loyalty program strategy as an important component of the overall company strategy.”
Companies Invest Upwards of Four Percent of Total Revenue
In short: Loyalty matters more than ever to companies across industries, especially in highly consumer-driven areas such as retail, financial services and hospitality. Facing increasing competition and shrinking budgets, they’re relying on loyalty’s data collection, insights and rewards to unify end-to-end customer management and all the ways to activate customers and shape their behavior.
To that end, companies are putting significant money behind their loyalty efforts: More than 71 percent said they’re investing a minimum of 2 percent of total revenues, with most spending upward of 4 percent, for loyalty and CRM to activate customers and leverage the data asset to create personalized offers and extensions, according to “Loyalty Big Picture.”
What are they getting for that investment? There’s good news on that front: The research found that loyalty program members contribute to almost half (43 percent) of companies’ annual sales. A full 95 percent of companies reported that members spend more than non-members annually, with 60 percent reporting that members spend two to three times more than non-members. As evidence of just how valuable the ROI can be, a significant number of vendors and other third parties are willing to pay for participation in programs. Indeed, more than half (53 percent) of loyalty practitioners surveyed for “Loyalty Big Picture” reported that vendors or other third parties fund offers for their loyalty programs.
Plenty of Opportunity for Change
“Loyalty Big Picture” unveils plenty of opportunities for retailers and other program operators to better capitalize on their investment. One such area: consideration of fee-based programs.
More than three-fourths of consumers (76 percent) reported that they do not pay a fee for the loyalty programs in which they participate, but 64 percent would be willing to do so in exchange for additional benefits including discounts, expedited free shipping and better earn rates. To that end, more than half of companies surveyed reported that they are considering implementing fee-based programs.
Another area of opportunity: Only 30 percent of companies cited “increase the value provided to loyalty members” as a reason they increased their loyalty investment in the past two years. Many loyalty operators fail to fully dig into the data that loyalty programs collect and realize all the benefits.
“The fact is, many loyalty operators benchmark against the competition and take their lead from market forces, not realizing that demand is being shaped by their customer,” said Papadatos.
Dig Deeper into ‘Big Picture’
Decision-makers, loyalty program operators, C-suite executives, industry analysts and others can download “Loyalty Big Picture” for a deeper look at the insights above as well as other key findings, including:
Make it matter: 21 percent of members said they will abandon a loyalty program if it doesn’t provide relevant rewards.
Digital gap: 79 percent of the top loyalty programs have a digital component. However, while a digital presence might be a minimal entry requirement, it doesn’t set programs apart – only 18 percent of members say digital experience plays a role in program preference.
KPI opportunity: Loyalty operators look for member growth (31 percent) and active membership (26 percent) to determine success, but only 13 percent look to estimated lift – or increase in the amount spent by a customer.
Eating with a Conscience
British consumers are increasingly eating with a conscience as latest research from Mintel reveals that last year the nation spent £8.2 billion on ethical food and drink, including organic, Fairtrade, Rainforest Alliance and Marine Stewardship Council (MSC) certified products. Over the past five years, sales of ethical food and drink have shot up by 43 percent from £5.7 billion in 2013. This year, sales are forecast to increase a further 4 percent to reach £8.6 billion. The sector’s ongoing popularity is set to continue, as sales of ethically certified food and drink are projected to rise by 17 percent to reach £9.6 billion between 2019-23.
This popularity is widespread, as today, a caring 83 percent of UK adults say they have bought food/drink with some sort of ethical certification. Proving a hit with more mature Brits, those most likely to buy ethically-certified food/drink are aged over 55 (87 percent).
But while ethical food and drink is growing in popularity, Mintel research reveals that cost is a significant barrier, as seven in ten (70 percent) UK adults say that eating sustainably/ethically is harder when money is tight. Confusion is having an impact too, as six in ten (60 percent) UK adults say that it is difficult to know the differences between the various sustainable/ethical schemes.
Alice Baker, Mintel Research Analyst said: “Ethical food and drink has enjoyed strong sales growth in recent years, but price poses a significant barrier to greater uptake. This makes it imperative for companies to demonstrate to consumers how they can shop ethically without breaking the bank and how ethical products can – in some cases – even be the financially-savvy option. Drawing attention more strongly to where standard own-label products have ethical certifications would allow retailers to demonstrate to shoppers that they can buy ethically and potentially save money too. Products using surplus produce, for example the ‘wonky veg’ boxes offered by various supermarkets, can also be presented as both a financially-savvy option and an ethical one to tackle food waste.” Comments Alice.
Waging a war on plastic
Following the television series Blue Planet II, it seems the “Attenborough effect” is having an impact on plastic use as seven in ten (67 percent) UK adults have made efforts to reduce the amount of plastic packaging they bought in the year to February 2019. Keen to cut back on plastic waste, six in ten (60 percent) Brits say they would be happy to use their own containers at supermarkets (ie for carrying meat or fish). But while consumers are keen to do their part to reduce waste, eight in ten (83 percent) Brits believe that retailers should do more to help reduce packaging waste.
Around half (48 percent) of UK adults say they are loyal to companies/brands whose ethics align with their own, rising to 56 percent of under-25s. In fact, a third (33 percent) of UK adults say they have stopped buying products from companies that have acted unethically, rising to 43 percent among under-25s.
While 49 percent of UK adults believe that their food and drink choices make a difference to the environment, slightly more (51 percent) disagree or are unsure whether or not this is true. This highlights the importance of reassuring consumers that their shopping actions have an impact.
“The recent climate change protests have pushed sustainability high up on the news agenda. The food and drink industry is under growing pressure to take action on issues such as carbon emissions, plastic pollution and food waste. However, any actions here can only be truly effective in tackling these issues if companies are able to persuade shoppers to buy sustainably/ethically certified products on a regular basis. Consumers’ doubts over whether their buying choices make a difference to the environment present a significant barrier, likely causing apathy and inertia. Companies must therefore make the benefits of buying ethical food/drink to the environment, and to wider society as a result, more tangible to shoppers.” Alice adds.
Free-range tops ethical purchases
Finally, Brits’ love of animals sees free-range (66 percent) ranked as the most widely bought food with an ethical certification; a claim which is widespread in selected everyday categories like eggs and chicken. In fact, concern over animal welfare (45 percent) is the number one reason for buying any food/drink with an ethical certification.
Meanwhile, Fairtrade ranks as the nation’s second most popular ethical food and drink, bought by around half (53 percent) of Brits. Foods with a Red Tractor certification are bought by 49 percent of consumers and organic foods are purchased by 30 percent of Brits.
Environmental sustainability appears to chime among under-35s, who show higher purchasing of food/drink with related certifications. A third (32 percent) of 16-34s buy Rainforest Alliance products, compared to an average of 25 percent of Brits; while 30 percent buy products with the FSC (Forest Stewardship Council) label on-pack, compared to an average of 20 percent.
“Free-range is a long-established label that spans various products, including eggs, poultry and – latterly – dairy products, including milk and yogurt. The intuitively tangible animal welfare image of free-range undoubtedly underpins its popularity.” Alice concluded.