
MRM Research Roundup: Mid-July 2021 Edition
21 Min Read By MRM Staff
This edition of MRM Research Roundup features the latest news on restaurant recovery, delivery trends, top ice cream toppings and the ideal "delivery doughnut."
Remarkable Resiliency
The U.S. restaurant industry has shown remarkable resiliency, having lost as much as 35 percent of visits at the beginning of the pandemic, but still has a ways to go to get back to pre-pandemic levels, reports The NPD Group. Total restaurant visits were down -6 percent in May 2021 compared to May 2019 but were up +23 percent from a year ago, recovering from a -23 percent decline in May 2020. The key to the industry's recovery will be the strength of each daypart. Each daypart — morning meal, lunch, dinner, and P.M. Snack — will recover differently depending on the new rhythms of home, school, and work-life according to NPD's continual tracking of the U.S. foodservice industry.
Visits, online or physical, at morning meal, which includes the breakfast and A.M. Snack periods, were down -5 percent in May 2021 compared to May 2020, and for a pre-pandemic view, down -11 percent compared to same month two years ago. Since morning meal visits are habitual, recovery for this daypart will depend on consumers returning to workplaces and schools. Lunch traffic, which was down -4 percent this May compared to a year ago and -10 percent compared to two years ago, will depend on the return to offices and workplaces and more midday activities, like shopping. Visits at the dinner daypart were down -5 percent in May 2021 from a year ago and -12 percent from two years ago. The ability for restaurants, particularly full service restaurants, to operate at total capacity, consumer comfort with dining in, and more business and recreational travel will aid recovery at the dinner daypart.
P.M. Snack, which has benefited from more flexible schedules blurring the dayparts and customers' hesitancy to dine in, is the only daypart that has increased visits over the past year. Visits at P.M. Snack were up this May +8 percent compared to May 2019 and up +3 percent compared to two years ago. Since this daypart has increased traffic during the pandemic, operators will need to innovate their food and beverage offerings to grow traffic.
"Across dayparts, the motivations for visiting restaurants are evolving, necessitating a refocus on how restaurant operators target consumers," says David Portalatin, NPD food industry advisor and author of Eating Patterns in America. "Quality, value, and innovation will always be relevant to the consumer, but we also need to recognize that in many ways the world has fundamentally changed."
Top Recovery Trends
How is the US On Premise shaping up as it continues its journey back from COVID-19 disruption? CGA’s Matthew Crompton and Andrew Hummel analyze the recovery of America so far this year.
1. Falling outlets, rising sales
The pandemic has caused a sizeable number of business closures, with CGA measuring a 7.9 percent drop in On Premise outlets since the start of COVID-19. But sales have bounced back well over the first six months of 2021, and are now running ahead of 2019 levels. “Demand is up and supply is down—and when that happens we see a huge increase in velocity,” said CGA’s client solutions director Matthew Crompton. “The market’s recovered a lot quicker than we thought… I think we’re in for a really good summer.”
2. Consumer confidence soaring
CGA’s surveys of consumers in various states have tracked a rise in numbers planning to go out to eat over the next two weeks—to 74 percent in New York, for example, compared to just 34 percent in December 2020. Frequency is rising fast too, and 43 percent of US consumers plan to visit venues more often than they did in 2019—nearly twice the number who will go out less (22 percent).
3. Check values up
Enthusiasm for getting back to bars and restaurants is translating into higher spend. Average check value is up by 20 percent from pre-COVID-19 times, and younger adults are spending particularly freely. But it’s worth remembering that while some people have cash in their pockets and want to treat themselves, many have been hit financially by COVID-19 and will be more cautious. “We’ll see a polarized market—people going for luxury brands, but value brands doing well too,” Crompton said.
4. Older people coming back to the market
It’s not just young people driving sales in US. After the rapid roll out of vaccines, there has been a particularly sharp increase in numbers of older people in the On Premise too. Four in five (81 percent) of those aged 55+ plan to eat out in the next two weeks—nearly three times as many as in December (29 percent). Since many of these people have a lot of disposable income, this is a valuable group to target.
5. A return to familiar brands
After months in lockdown, consumers are tending to choose drinks options they knew and enjoyed before COVID-19, CGA’s data shows. Nearly half (45 percent) have only chosen drinks brands they are familiar with and trust since COVID-19 hit.
6. Short-term challenges in craft
A side-effect of this return to trusted brands is that craft beer has lost a little market share. However, there is still a big appetite for new beer brands, and volumes should pick up again as the market settles back down. “I expect the more experimental categories to come back,” said Crompton, who emphasised the need for brands to stand out. “Craft is more competitive than ever before… showing what your brand can bring to the table is key.”
7. More growth for hard seltzers
Hard seltzers have picked up where they left off when the pandemic hit—in rapid growth. They have gained 1.3 percentage points of drinks volumes in the last 12 months alone, and increased their penetration into menus. “We’re really seeing hard seltzers taking hold in the On Premise… they’re almost ubiquitous now,” Crompton said. Another growth area could be packaged cocktails, said Andrew Hummel, CGA’s client solutions manager. “RTDs [Ready to Drink] definitely offer consistency and speed of service… there’s definitely opportunity for increased engagement there.”
8. Physical service is still valued
COVID-19 triggered an increase in remote, app-based ordering in the US On Premise. But as restrictions ease, many guests want to return to physical service. More than two thirds (69 percent) of consumers say it is still their preferred method, compared to 9 percent who want to order through their phone. While many younger people have embraced digital order and pay, older ones haven’t. “The majority are still uncomfortable ordering digitally,” Hummel said.
9. People want printed menus
COVID-19 brought a similar shift from paper to digital menus—but two thirds (65 percent) still prefer the former, and many of them are turned off by digital lists. “We think the best approach to reach the broadest audience is some sort of physical menu, supplemented by digital menu,” Hummel said.
10. Operators need suppliers’ help
With so many bars and restaurants packed out with returning consumers, partners have a chance to step up their support and share their knowledge and resources. “Customers need the help of suppliers and distributors more than ever at the moment,” Crompton said.
Top Restaurant Brands
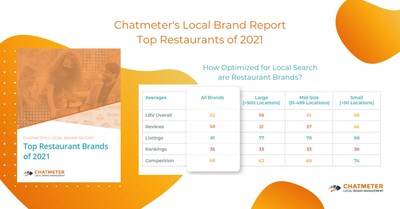
Chatmeter released its latest Local Brand Report: Top Restaurant Brands of 2021. This report analyzes 75 US brands with small, mid-size, or large location counts and identifies the top 10 brands in local brand visibility and online reputation.
The report takes a look at thousands of reviews, listings, and rankings from the past year to identify which brands are going above and beyond to acquire and retain brand loyal customers through local search optimization. Brands that prioritize responding to reviews and maintaining listing accuracy typically have better insight into the true customer experience.
The brands in this report are ranked based on online reputation and Chatmeter's Local Brand Visibility (LBV) score (Chatmeter's proprietary score for measuring reviews, listings, rankings and competitors).
Some of the top ranking brands include; Arby's, Chick-fil-A, Noodles & Company., Bob Evans, Roosters, and Fogo de Chao.
The report revealed several key findings about the Restaurant industry's online and offline customer experience. The following findings are key performance indicators that multi-location brands should be using to determine the effectiveness of their local SEO and reputation management strategies:
- The average LBV score for the industry was 62, representing an above average score.
- The highest scoring LBV category was listings with an average of 81. Every market size earned an average score of over 70 — reflective of an industry leader.
- Small brands (under 50 locations) earned the highest average overall review rating at 4.3 stars.
- The percent of positive customer sentiment found in reviews increased by nearly 10 percent as the size of the brand decreased: large 65.8 percent positive, mid-size 74.7 percent positive, and small 83.1 percent positive.
Local Brand Report Key Findings
The report digs deeper into customer reviews by taking a look at the sentiment around new or expanded experiences implemented as a result of COVID-19. Chatmeter found that experiences like "outdoor seating" and "curbside pickup" earned more positive feedback from customers than experiences that involved "delivery" or "phone". Insights like this show just how important it is for brands to continuously monitor and analyze customer reviews for insight into the true customer experience.
"The pandemic has put restaurant brands through a lot the past year and a half. The brands at the top of this list have been working relentlessly to keep up with changing customer expectations" said Cynthia Sener, CRO of Chatmeter. "This report provides valuable insight into all the ways restaurant brands can improve the online to offline customer experience and drive brand loyalty."
On Premise Impact
According to the latest BeverageTrak data from CGA’s COVID-19 On Premise Impact Report, On Premise velocity in outlets currently trading is +73 percent higher than the same time last year in the week to July 10. The comparable week last year (to July 11 2020), while in recovery compared to the height of restrictions, was still lower than the same week in 2019.
Total U.S.
Across all states, value velocity remains strongly positive compared to last year, with all states either ahead or comparable to 2019
Average outlet $ sales (velocity) trends are slightly negative (-1 percent) in the latest week (July 10 vs July 3) across the average U.S. outlet, following declines of -8 percent across the July 4th weekend
While velocity was down across the weekend of July 4th vs the previous weekend, on the observed national holiday (Monday July 5th), velocity was up significantly vs the previous Monday in key states (between +14 percent and +29 percent).Following these declines, all states also experienced a recoup of velocity on Saturday July 10 vs Saturday July 3
100 percent of states have bars and restaurants open indoor completely (with no capacity restrictions)
Florida
Within Florida, Miami was the only key city to experience non-negative trends (+1 percent) in the week to July 10. As a whole, while Florida did not experience as a great of a decline in the week to July 3 (-8 percent) as other key states, in the latest week it experienced the most negative trends (-4 percent).
Sales velocity is now +27 percent vs July 13, 2019
Sales velocity is now +75 percent year-over-year (comparing the same week one year prior)
Sales velocity is now -4 percent vs July 3, 2021
Illinois
Illinois is the only key state to experience growth in the latest week (+2 percent) driven by trends in Chicago (+9 percent), though as a whole, the state experienced the greatest decline in the week to July 3 (-14 percent).
Sales velocity is now -4 percent vs July 13, 2019
Sales velocity is now +64 percent year-over-year (comparing the same week one year prior)
Sales velocity is now +2 percent vs July 3, 2021
California
California experienced the least declines in the week to the July 4th weekend (-6 percent) across the key states, though San Diego remained flat vs the previous week. While in the latest week, to July 10, although the state experienced declines, San Diego experienced significant growth (+8 percent)
Sales velocity is now +29 percent vs July 13, 2019
Sales velocity is now +118 percent year-over-year (comparing the same week one year prior)
Sales velocity is now -3 percent vs July 3, 2021
New York
Similar to many other states, New York has experienced its second consecutive week of declines, down -12 percent and -3 percent in the weeks to July 3 and July 10 respectively. Performance in NYC is in line with the rest of the state.
Sales velocity is now -5 percent vs July 13, 2019
Sales velocity is now +101 percent year-over-year (comparing the same week one year prior)
Sales velocity is now -3 percent vs July 3, 2021
Texas
Although not positive in trend, Texas experienced the second strongest trend July 10 vs July 3, and was down only -2 percent. Key city performance varies across the state with Austin remaining flat (0 percent), while Dallas (-4 percent), Houston (-3 percent) and the rest of the state (-2 percent) skewed slightly negative.
Sales velocity is now +31 percent vs July 13, 2019
Sales velocity is now +75 percent year-over-year (comparing the same week one year prior)
Sales velocity is now -2 percent vs July 3, 2021
Matthew Crompton, CGA Client Solutions Director, Americas, said: “Although there were declines across most states across the July 4th weekend, overall value velocity remains strongly positive compared to last year and ahead of 2019 levels. The market has recovered a lot quicker than anticipated, and suppliers and operators alike have the opportunity to target consumers returning to the On Premise with a tailored approach to maximize spend.”
The State of Casual Dining
A new report by foot traffic analytics firm Placer.ai, titled “Casual Dining – Who’s Thriving and Who’s Recovering?” shows that the casual dining scene is in the midst of a big recovery from the pandemic — and has almost completed its comeback. The report contains monthly visit data for each month of 2021, comparing it to the same months during 2019, which was sourced from an index of 28 casual dining restaurants (the first chart in the blog) — that data reveals that restaurants are, by and large, seeing an influx of diners.
For reference, the report comprises data from the following restaurant chains, and more:
Longhorn Steakhouse, The Capital Grille, Eddie V’s Prime Seafood, Texas Roadhouse, The Cheesecake Factory, Fleming’s Prime Steakhouse & Wine Bar, Bahama Breeze, Seasons 52, BJ’s Restaurant and Brewhouse, Bonefish Grill, Maggiano’s Little Italy, Chuy’s, Cheddar’s Scratch Kitchen, Applebee’s, Denny’s, IHOP, and Red Robin Gourmet Burgers.
Digging further into the data, the report finds that there are some clear winners and losers among the analyzed brands: “Some chains – most notably diners and casual neighborhood eateries – have struggled more to lure customers back,” the report reads. Overall, the news is good, but some chains are harboring big appetites for foot traffic that may not be satiated in the coming months.
The full report can be found here.
Satisfying the appetite: Overall, the casual dining sector is seeing a big recovery in visits. Compared to the same months during 2019, foot traffic was down more than 29 percent in January, but down less than 4 percent as of June, per the index of 28 chains, on average.
The winners: As for the top-performers during Q2, Eddie V’s Prime Seafood tops them all, with foot traffic up 28.5 percent in June compared to June 2019. The Capital Grille wasn’t far behind (up 19.8 percent), as was Longhorn Steakhouse (18.9 percent) and Texas Roadhouse (16.8 percent).
Hungry for visits: As for Q2’s losers, the list includes BJ’s Restaurant and Brewhouse, Applebee’s, Denny’s, and Red Robin. Some chains are actually seeing foot traffic trend in the wrong direction, too — at Chuy’s visits declined from being down 15.5 percent in April (compared to 2019) to down 17.2 percent in June. And at IHOP, visits declined 0.6 percent (again compared to 2019’s numbers) between May and June.
Restaurant Delivery Trends
BentoBox, in partnership with The Infatuation, released the second installment of its Restaurant Delivery Consumer Trend Report, as part of a year-long study tracking how U.S. consumers' delivery and takeout habits evolve through COVID-19 recovery effort.
The Q2 survey features insights from 1,020 U.S. diners, ages 18+, who dined out at least once per week prior to the pandemic. The report indicates that while diners are eager to return to their normal routines and have far less hesitancy to dine in-person, their delivery and takeout ordering frequency remains unchanged.
Top Three Key Trends:
1. Takeout and delivery routines are here to stay, despite optimism for reopening:
- 78 percent of diners are ready to resume their normal dining habits, an 18 percent increase from Q1 (66 percent), which coincides with a 64 percent decline in vaccine hesitancy among diners from Q1 (25 percent to 9 percent). However, despite increased optimism for the recovery effort, delivery and takeout ordering remained consistent, and even saw slight growth quarter-over-quarter.
- 85 percent of all diners ordered at least once per week (84 percent in Q1)
- 60 percent of diners ordered takeout or delivery 1-2x per week, a three point increase from Q1 (57 percent).
- 88 percent of diners who frequently order takeout/delivery (4x+/week) are increasingly confident they will maintain their current habit, from 83 percent in Q1, showing that pandemic ordering habits are becoming the new normal of how diners engage with restaurants.
2. Ease, convenience, and industry support remain core influences of ordering habits:
- As delivery habits persist, creating a seamless, user-friendly ordering experience is paramount for restaurants to compete in the new landscape of pandemic recovery.
- 75 percent of diners surveyed (+2 points from Q1) order takeout and delivery for its convenience.
- However, while the simplicity of online ordering is generally associated with third-party marketplaces, only one in four diners (23 percent) would be loyal to a third-party marketplace for its convenience (28 percent in Q1).
- When deciding whether to order directly through a restaurant versus via a third-party marketplace, ease of ordering (45 percent), promotions and discounts (41 percent) and delivery and service fees (34 percent) were other top considerations made among diners.
- While ease and convenience is a top priority, diners are increasingly eager to show their support for local restaurants in their community.
- One in two diners (51 percent) cite support for local restaurants during pandemic recovery as a motivation for continuing ordering habits (+2 points from Q1).
3. Age is a factor in how likely diners are to continue their takeout and delivery habits:
- As the recovery effort takes shape, diners aged 25-49 are most likely to be "super users" of online ordering and takeout (3+/week), while the youngest (18-24) and oldest (65+) groups of diners favor light-to-moderate frequency or no frequency at all. Among all diners, four in five (80 percent) are very or somewhat likely to continue their current ordering frequency, with diners aged 25-49 being the most confident that they will continue (84 percent).
- Diners aged 25-49 are most likely to be takeout and delivery "super users" ordering takeout and delivery over 3x+/week. 32 percent of diners aged 25-49 ordered at this frequency, outpacing diners aged 18-24 (23 percent), 50-64 (13 percent), and 65+ (9 percent).
- Diners aged 18-24 are shifting towards a light/moderate order frequency in favor of returning to in-person dining. The number of heavy delivery/takeout consumers in this age bracket was halved since March, with a migration to light-to-moderate consumption (9 percent to 5 percent). This group is also 20 percent less likely to be confident they will maintain ordering habits moving forward, with only 64 percent of the group very or somewhat likely to continue ordering frequency.
- Diners aged 65+ are growing fatigued of delivery and takeout. Interest has fallen to below pre-COVID levels, with more than one in three (36 percent from 31 percent in Q1) currently placing no orders at all. 71 percent of diners over 65 are likely to continue these ordering habits moving forward (-9 points below all diners).
Self-Delivery Doughnut
According to research by VROMO, the most profitable distance for hospitality venues and restaurants operating self delivery is within 2.14 miles. VROMO has identified the exact sweet spot for profitable restaurant delivery, that it’s calling the ideal ‘delivery doughnut’. The company analysed data from users of its platform and found that deliveries within 2.14 miles of a restaurant are the most profitable for restaurants that manage their own deliveries.
For anything beyond the 2.14-mile mark, it usually becomes more cost-effective to use delivery service providers (DSPs), as it gets harder for restaurants to run profitable delivery services using their own fleets of drivers and riders.
VROMO’s CEO Alan Hickey says that use of data is important in helping restaurants to pinpoint where the dividing line is between operating their own profitable in-house delivery teams and drawing on the resources of DSPs.
Offering delivery to more-distant areas will obviously bring many new customers and increase revenue, but using an in-house delivery fleet to cover them will often bring inefficiency. Some contributing factors include the requirement for additional drivers, more driver idle time as they return to the restaurant, fewer opportunities to merge deliveries and, finally, having to extend the delivery time that the customers can expect, which can deter customers from ordering.
“As restrictions are lifted and we get back to something like normal life, those restaurants that manage delivery very well and make it a seamless part of the overall dining experience will thrive," he said. “The smartest restaurants are those already using a mix of self-delivery and DSP strategies because it offers the best of both worlds – they can self-deliver to customers nearby and call on DSPs to deliver orders further afield. There’s never been a better time for restaurants to use all the tools out there to develop an excellent delivery model. They can take advantage of platforms such as VROMO to manage their in-house delivery teams within the doughnut, as well as use DSPs to complete deliveries further away.”
What Restaurants Can Expect
As the restaurant industry recovers from the pandemic, a new report by Mazars, found that 80 percent of survey respondents expect increased sales, employment, profit, and product line growth this year. The survey also found significant industry shifts toward health, wellness and sustainability, with a growing focus on adopting new technology solutions that enhance customer experience.
“The food and beverage industry has had to overcome many challenges over the past 18 months, but it’s clear from the data that it is on a fast trajectory toward recovery,” said Kristen Walters, Mazars Food & Beverage Practice Co-Leader. “Business leaders are looking to innovate and keep pace with the changing expectations of consumers for more sustainable, healthier options, and are adopting data and technology solutions to develop in a more informed way.”
Key Findings
A Movement Toward Sustainability and Healthier Options
20 percent of respondents reported implementing sustainability reporting and nearly half plan to follow suit this year.
The vast majority (91 percent) of respondents also stated that health and wellness is somewhat or very important when introducing new products. 44 percent anticipate that plant-based options will have a positive impact on sales, and 39 percent said that “better-for-you foods” would perform similarly.
Technology, Data, Robotics and AI
While respondents noted that technology solutions that enhance customer experience were the most popular response to COVID-19 (39 percent), data and technology were also important to many food and beverage companies, with the majority (62 percent) of respondents already having implemented data analytics or planning to do so. One in five participants have already implemented, or are planning to implement, robotics and artificial intelligence, with 17 percent considering adopting this technology.
Continued Concerns and the COVID-19 Effect
When considering internal factors that could impact business, restaurant and beverage companies said they were very concerned about increasing sales (41 percent), increasing product customer profitability (34 percent), and the COVID-19 effect (31 percent). Respondents also noted being very concerned about external factors, including rising commodity and other costs (25 percent and delivery costs, including the last mile (28 percent).
The full report can be downloaded here.
Looking for Adventure
New research shows that Americans are ready to put down the phone and pursue some in-person theme park adventures. Consumer confidence jumped from 68 percent to 80 percent from May and June, with people noting they are ‘optimistic’ about the prospect of spending quality time with families and friends at their favorite leisure attractions. The survey also shows that people increasingly want to book ahead not only to have an outing to look forward to, but to also enhance the safety and convenience of the trip. This includes everything from planning and paying for activities to ordering food and drinks in advance.
The research from Merlin Entertainments and Oracle Food and Beverage looks at how consumers are traveling this summer, while COVID-19 still lingers. The research1 highlights how new technologies will enhance the experience for visitors at their favorite theme parks and attractions such as Merlin Entertainments’ brand-new LEGOLAND® New York Resort, SEA LIFE® Aquariums, and THE LEGO MOVIE WORLD at LEGOLAND®California Resort.
New requirements for new adventures
One in three travelers in the US are staying closer to home, while 20 percent are booking more weekend trips and shorter stays than previously seen. “Togetherness & Escape” are most valued by US consumers when visiting attractions. They also noted they welcome the chance for screen-free experiences.
Visitors are also increasingly looking to plan ahead and personalize their journey and continue to reduce contact. Technology is fundamental to providing visitors the control and comfort they crave. For example, the research shows:
● 54 percent of people would love to plan their itinerary in advance so they can beat the queues
● 59 percent favor some sort of “fast pass” system which provides priority access to food, shops and facilities
● 40 percent would pay extra to be able to pre-book their day’s activities in advance
● 58 percent would like to be able to see hotspots on a map in order to avoid the busiest places in a theme park or attraction
● 48 percent of millennials would like to provide preferences in advance to receive relevant offers while at the destination
“After a difficult year, with limited entertainment, guests are excited about a summer of fun. Our customers want to plan and purchase ahead. Pre-ordering meals, refreshments, photos and checking-in online are all happening before they even arrive,” said, Chief Technology Officer at Merlin Entertainments Lee Cowie. “Our guests are excited for feel-good experiences, but they want to feel safe and in control at the same time. For Merlin, the pre-planning technology we’re bringing in offers guests the ability to tailor and personalize their stay while allowing us to flex our business to allow for things like social distancing, staff support and food and beverage pre-ordering.”
Cotton candy on demand
Upwards of 80 percent of consumers (79 percent) agree that refreshments are an integral part of their theme park experience and technology will play a key role in ordering moving forward. Over half (52 percent) of customers would purchase more if they could avoid queues all together, and 54 percent of consumers say they think food and drink pre-ordering and pick-up should be the new standard. Families are especially supportive of this idea, with 55 percent of parents with kids under 12 wanting to schedule food or drinks before arriving at a theme park. In addition:
● 41 percent of families would love to interact with the park via a dedicated mobile app
● 24 percent of Gen Zers noted that using a QR code system is their preferred system for ordering food and drinks
● 28 percent of Baby Boomers still favor staffed-concessions for food and drinks orders
“Nearly 70 percent of consumers want to visit a theme park as soon as possible and technology will play an increasing role in delivering a memorable experience,” said Simon de Montfort Walker, senior vice president and general manager, Oracle Food and Beverage. “As patrons return, Merlin Resort Theme Parks (RTP’s) are well prepared to meet new customer expectations, such as using technology to order food ahead, while driving additional revenue streams.”
Partnerships are paramount
Building a strong network of nearby partners can provide theme parks with the ability to earn additional revenue, and perhaps, more importantly, learn more about their customer. Creating package deals with nearby restaurants and hotels offers parks an additional opportunity to learn about and better serve customers with informed marketing and loyalty programs for compelling personalized experiences.
Consumers are on board with the package idea: 67 percent said they would be likely to visit nearby hotels, restaurants and bars if they received a personalized offer as part of their theme park trip. Meanwhile, half of millennials and Gen X audiences would love to get mobile notifications with personalized offers for nearby food or drinks outlets.
Support for Spirits Shipping
Online shopping for groceries and beverage alcohol have become the norm, and there is overwhelming consumer demand for direct-to-consumer shipping of distilled spirits, similar to wine, according to a national survey released today by the Distilled Spirits Council of the United States (DISCUS).
The survey of more than 2,000 spirits consumers, conducted for DISCUS in March 2021 by IWSR Drinks Market Analysis, was released this morning during a media briefing hosted by DISCUS.
- According to the key findings presented by DISCUS Chief Economist David Ozgo:
- Eighty percent of consumers surveyed believe distillers should be allowed to directly ship their products to legal-age consumers in any state.
- At least 76 percent of consumers would consider purchasing spirits online shipped directly from distillers to them from outside or within their state.
- Seventy-five percent of consumers agree wine and spirits should be subject to the same laws pertaining to DTC across states.
- Close to one in two (45 percent) have purchased alcohol online direct from a brewery, winery or distillery.
- Thirty-eight percent of respondents report having purchased alcohol online from a producer that was shipped from outside of their state.
- The pandemic accelerated the ability and expectation to shop online. Seventy-three percent of all households surveyed shopped online for groceries, and 47 percent report they are shopping online more frequently than in the past year.
- Sixty-two percent of consumers have purchased beverage alcohol online (either through DTC or other e-commerce platforms) and consumers are equally likely to have purchased spirits (32 percent), wine (33 percent) or beer (31 percent).
“The goal of this survey was to get a better understanding of the buying behavior of spirits consumers and determine if current state laws restricting direct shipping of spirits are hampering distillers’ ability to meet the needs and expectations of their customers,” said Ozgo. “These findings underscore that there is a very high level of interest among spirits consumers in purchasing products directly from a distiller located within or outside of their state, and having it shipped to them.”
During the briefing, DISCUS Chief of Public Policy Christine LoCascio presented the current legislative landscape for spirits DTC shipping noting that 46 states plus D.C. allow direct shipments of wine, but only 9 states plus D.C. permit DTC shipping of distilled spirits. LoCascio added that, as a result of the pandemic, an additional seven states temporarily allowed distillers to ship to in-state consumers. The temporary measures in New York and Montana recently ended, and there are bills in some states, including California, to make the measure permanent.
Flavor Favorites
DoorDash listed ice cream flavors and toppings are number one in some of the top cities based on order data from January 1, 2021 – June 29, 2021
ATLANTA
Fried Ice Cream
Green Tea
Mango
Cookie Dough
Rum Raisin
Toppings:
Rainbow Sprinkles
Marshmallow Sauce
Crushed Pretzels
Animal Crackers
White Chocolate Chips
CHICAGO
Mochi
Matcha Oreo
Smores
Basil Chocolate Chip
Apple Cider Strudel
Toppings:
Hot Fudge
Gummy Bears
Chocolate Sprinkles
Strawberry Syrup
Cherries
COLUMBUS
Vanilla Ice Cream Sandwich
Mint Chocolate Chip
Cookies and Cream
Butter Pecan
Cotton Candy
Toppings:
Honey
Whipped Cream
Chocolate Chips
Rainbow Sprinkles
Gummy Bears
DALLAS
Mochi Ice Cream Balls
Fried Ice Cream
Vanilla
Lavender Macaron Ice Cream Sandwich
Almond Brittle
Toppings:
Pecans
Hot Fudge
Caramel Syrup
Chocolate Chips
Whipped Cream
WASHINGTON D.C.
Peanut Butter Cup
Vanilla Ice cream with Apple Pie
Strawberry Shortcake
Mango
Neapolitan
Toppings:
Bananas
Hot Fudge
Caramel Syrup
Rainbow Sprinkles
Waffle Chips
HOUSTON
Ice Cream with Churros
Ice Cream Float
Coconut
Coffee
Strawberry
Toppings:
Chocolate Syrup
Assorted Nuts
Strawberries
Chocolate Chips
Honey
LOS ANGELES
Strawberry
Rocky Road
Mint Chocolate Chip
Pistachio
Vanilla Bean
Toppings:
Rainbow Sprinkles
Cheesecake Bites
Whipped Cream
Marshmallows
Pineapple
MIAMI
Brownie
Fruit Cake
Ice cream cake
Double Fudge Brownie
Strawberry
Toppings:
Rainbow Sprinkles
Chocolate Chips
Hot Fudge
Whipped Cream
Marshmallows
NYC
Ice Cream Cake
Mud Pie
Salted Caramel
Red Velvet
Bananas Foster
Toppings:
Caramel Syrup
Rainbow Sprinkles
Vanilla Wafers
Chocolate Covered Bananas
Peanut Butter Cups
PHILADELPHIA
Green Tea
Peach
Chocolate Fudge Brownie
Butter Pecan
Rocky Road
Toppings:
Rainbow Sprinkles
Graham Crackers
Whipped Cream
Almonds
Bananas
SAN FRANCISCO
Peanut Butter Fudge
Salted Caramel
Mochi
Coffee
Coconut
Toppings:
Cinnamon
Peppermint Bark
Pretzels
Chocolate Chips
Whipped Cream
Best Vegan Ice Cream
Ahead of National Ice Cream Day, PETA has scoured the menus of traditional ice cream shops across the country in search of the best vegan ice creams—and topping the list are:
- Dairy Queen, which created its first-ever vegan frozen dessert—the Non-Dairy Dilly Bar, a crunchy chocolate–coated, coconut cream–based dream—after years of pressure from PETA
- Ben & Jerry’s, whose beloved vegan flavors are available not only by the pint but also by the scoop (Flavors include Chocolate Chip Cookie Dough, Coconut Almond Fudge Chip, and Cold Brew Coffee Fudge Chip.)
- Jeni’s Splendid Ice Creams, whose dairy-free creations include Dark Chocolate Truffle, Cold Brew With Coconut Cream, Roasted Peanut Butter & Strawberry Jam, Texas Sheet Cake, and Caramel Pecan Sticky Buns
- Sub Zero Nitrogen Ice Cream, which can customize any ice cream order with a soy-, almond-, or cashew-milk base—and load it up with all the toppings anyone could want
“Customers are clamoring for ice cream that’s kind to cows, and the country’s top scoop shops are paying attention,” says PETA Executive Vice President Tracy Reiman. “PETA is celebrating the chains that are dishing up some of the most delicious dairy-free treats around.”
The list also features several regional ice cream chains, including Amy’s Ice Creams (Texas), Ghirardelli Ice Cream & Chocolate Shop (San Leandro, California) Halo Top (Los Angeles), McConnell’s Fine Ice Creams (California),OddFellows Ice Cream Co. (Brooklyn), Perry’s Ice Cream (Northeastern U.S.), Salt & Straw (West Coast), Stewart’s Shops (New York State), and Van Leeuwen (Brooklyn and Los Angeles).