
MRM Research Roundup: Mid-January 2021 Edition
11 Min Read By MRM Staff
This edition of MRM Research Roundup features restaurant industry year-end totals, how restaurant labor is evolving, fast-food brand intimacy and top cities for locavores.
An Unpopular Year
The U.S. restaurant industry closed one of the most unpopular years in history moving its way out of the steepest declines the industry has experienced since the Great Recession, reports The NPD Group. Customer transaction declines at major restaurant chains in December were down -10 percent compared to same period year ago, a 27-point improvement from April, the height of the shelter-at-home and restaurant dine-in closure mandates, when transactions declined by -37 percent from a year ago, according to NPD’s CREST® Performance Alerts, which provides a rapid weekly view of chain-specific transactions and share trends for 75 quick service, fast casual, midscale, and casual dining chains representing 54 percent of the commercial restaurant traffic in U.S.
Full-service restaurant chains, which primarily rely on dine-in customers and had few if any off-premises services when the dine-in restrictions went into effect, bore the brunt of the transaction declines throughout the pandemic. In April, the segment’s customer transactions declined by -70 percent compared to year ago, and improved its declines to -30 percent in December. Many full-service restaurant chains quickly pivoted to offer more off-premises services by turning parking lots into drive-thru stations, offering curbside pick-up, and enhancing delivery options. For full-service restaurants now, it’s about government restrictions. In more restrictive states full-service restaurant chain transactions are down -60 percent to -70 percent. In less restrictive states, there isn’t as much of a gap between quick service and full-service restaurants.
Major quick service restaurant chains, which represent the bulk of restaurant industry transactions, learned to expand their already high capacity for off-premises volumes. The chains’ carry-out, drive-thru, and delivery orders soared throughout the pandemic as consumers looked for relief from preparing most of their meals at home. Quick service customer transaction declines bottomed out in April with a decline of -35 percent versus year ago, but quickly improved as shelter-at-home orders were lifted. In December, quick service restaurant chain customer transaction declines were down -8 percent versus last year.
“The struggles of the restaurant industry are well documented and we acknowledge that some operators have not survived the pandemic,” David Portalatin, NPD food industry advisor and author of Eating Patterns in America. “But history has shown that consumers will always value the convenience, quality, and experience of restaurant meals, and the operators that deliver against these expectations have proven it’s a winning formula in good or bad times. Our industry is resilient and consumer demand for restaurants remains strong.”
Restaurant Labor Evolution
The experts at 7shifts’ released a data-backed study titled “How Restaurants are Evolving Labor with Third-Party Delivery in 2021."
Among the key findings:
- Delivery-related roles being created by restaurants have grown by 243 percent.
- 37 percent of restaurants report outdoor dining as their biggest revenue driver during COVID-19
- The average fees paid to third-party delivery services is 20 percent. However, 30 percent of restaurants pay fees at 30 percent or higher.
“The growth at service providers like 7shifts are lagging indicators of what’s really starting, which is a massive technological adoption phase throughout the industry," said Jordan Boesch, CEO. "The next wave of restaurant operators are ushering in and will use technology to run their businesses more effectively. Doing without is no longer an option.”
To access the report, click here.
Top Fast-Food Brand Intimacy
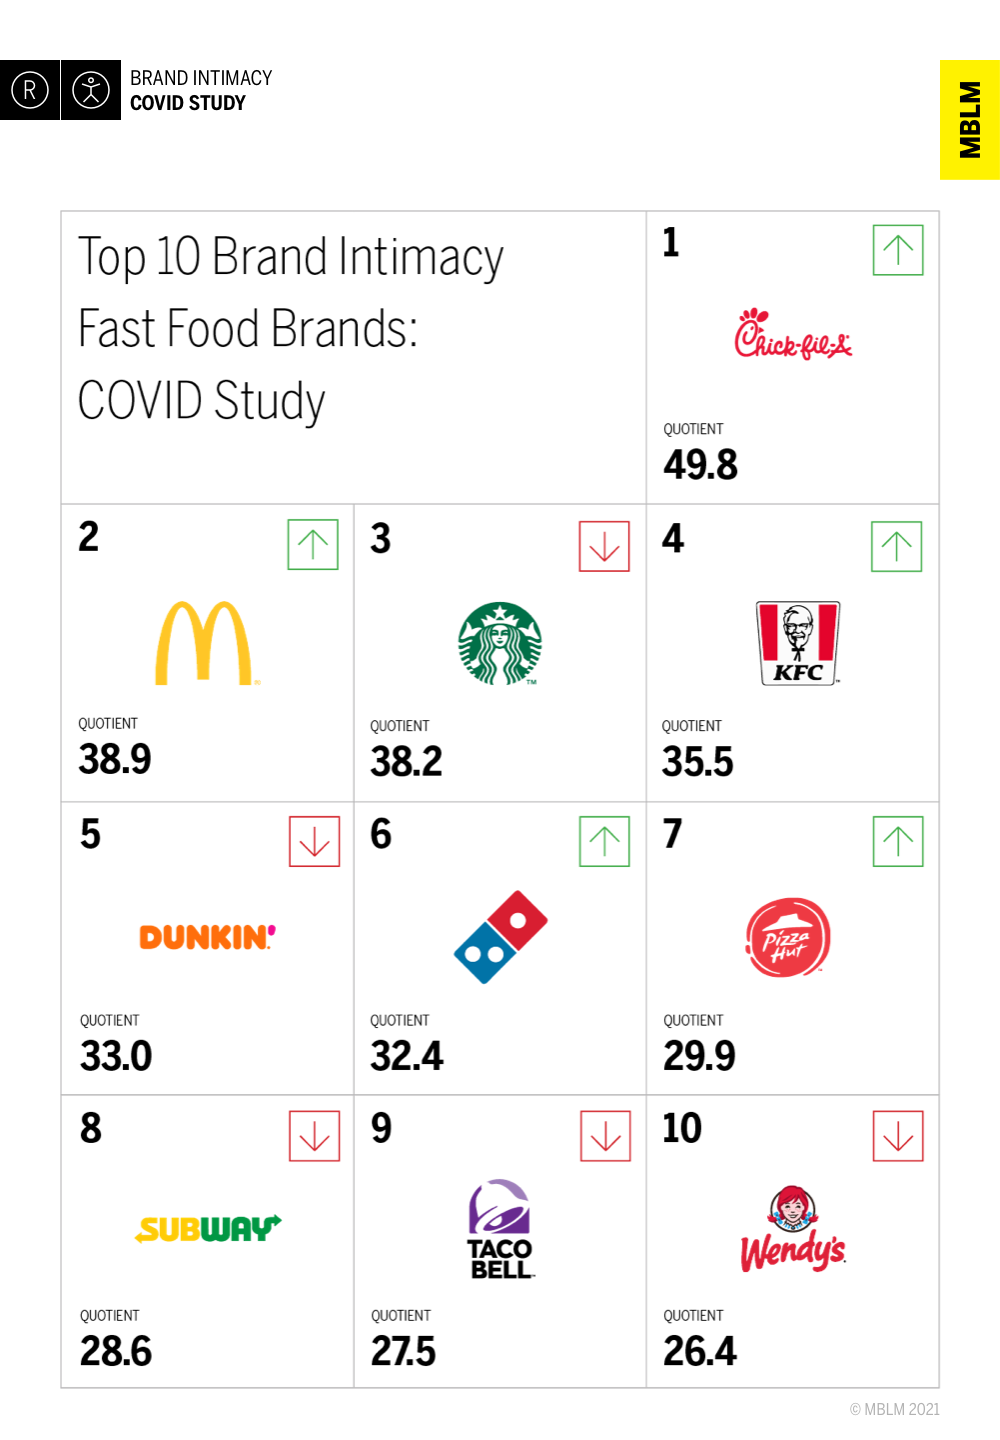
Since the start of COVID-19, daily fast-food consumption has increased by 37 percent, according to MBLM’s Brand Intimacy COVID Study, which analyzes brands based on emotional connections during the pandemic. Although the fast-food industry placed sixth out of 10 industries, overall performance has improved six percent since the previous study. The industry also ranks #1 for the archetype of indulgence, indicating that during challenging times, consumers turn to brands long associated with comfort, pleasure and pampering.
Chick-fil-A regained its 2019 ranking as the fast-food company with the strongest Brand Intimacy, which is the emotional science behind the bonds we form with the brands we use and love. McDonald’s moved up one spot to second place in the BIS COVID Study, while 2020’s top brand, Starbucks, moved to third. The remaining brands in the top 10 for the industry are KFC, Dunkin’, Dominos, Pizza Hut, Subway, Taco Bell and Wendy’s.
“Despite daily consumption increases, the fast-food industry has been severely affected by stay-at-home orders and initial closings. However, consumers have been more emotionally connected to fast food brands during the pandemic,” said Mario Natarelli, managing partner, MBLM. “As we return to ‘normal’ life, fast food brands should find a way to reference what we have all been through together and how they have reliably comforted us through this crisis.”
Despite restaurant closures during COVID, top intimate fast-food brands continue to significantly outperform the leading brands in the Fortune 500 and S&P 500 indices across revenue growth, profit growth and stock price.
Technology will likely continue to play a larger role in how we interact with fast food brands, as many consumers prefer to order ahead, flag their arrival via their mobile phone and track deliveries. Brands that can lead with their digital experience and touchless delivery will also advance consumer relationships.
Additional significant fast food industry findings include:
- The fast-food industry ranks sixth in this study, maintaining its position from the 2020 and 2019 rankings.
- Fast Food performs better with men than women and with younger consumers versus older ones.
- McDonald’s is the top brand for men, replacing Starbucks, while women prefer Chick-fil-A.
- Chick-fil-A exhibits significantly stronger associations in the fulfillment and indulgence archetypes,
- and leads across all three stages of sharing, bonding and fusing.
MBLM also analyzed the industry in an article entitled, “Our Connection to Fast Food During the Pandemic.” To view the fast-food industry findings, click here.
Latest On Premise
According to the latest COVID-19 On Premise Impact Report from Nielsen CGA, with a focus on consumer data in Texas, Florida, New York and California:
- 50 percent of consumers have gone out to the On Premise for an eating occasion since venues reopened, and 17 percent for a drink led occasion. This has stayed relatively even for several months now
- Florida and Texas are still seeing increases in visitation and positively moving to over 3/5 of consumers returning
- Age is not the main factor limiting the numbers returning – state regulations are a much bigger influencer, with California remaining low with much stricter measures in place than Florida and Texas
- Sparkling Wine / Champagne was ordered +3pp higher than in the previous month, showing its strength in the December holiday season
The occasion consumers are most excited to visit bars and restaurants for are Valentine’s Day and Mother’s Day. These are two holidays which can be facilitated in small group numbers, making them significant opportunities to target for visitation, offers, and reminding consumers what they were missing
Foot Traffic Analysis
To get a sense of how sit-down restaurants are faring to start 2021, foot traffic analytics firm Placer.ai looked at data from six large sit-down restaurant chains, which included Olive Garden, Longhorn Steakhouse, Applebee’s, Chili’s, Denny’s, and Outback Steakhouse. And the data paints a fairly bleak picture — though there was an improvement among all the chains this summer and fall, the past two months have seen visit numbers decline again as COVID cases have risen. There was a pretty steep drop-off, too: Visits for the group were down 21.6 percent year-over-year during October, but the gap ballooned back to 38.4 percent during November.
Among the highlights:
- There were no winners last year. To put it bluntly, among the six chains, there were no winners during 2020. All saw significant declines in foot traffic, even after starting 2020 off on a tear — in February of last year, every single chain in Placer’s report had seen visit counts up by at least 8 percent from February 2019’s levels.
- The biggest loser: Denny’s. Taking a look at the last four weeks of 2020 shows that one chain underperformed all others in the group: Denny’s. During the week of December 21st, for example, visits at Denny’s were down nearly 60 percent year-over-year. Longhorn Steakhouse, conversely, performed the best, with visits down only 34 percent comparatively.
- Is there any reason for optimism? The sit-down restaurant recovery will hinge on the country’s continued handling of the pandemic and subsequent economic recovery. That said, plenty of people are likely itching to get out and go to dinner. Once diners feel safe and secure, it’s likely that foot traffic will explode at these chains and others during 2021.
A link to the full report can be found here.
2020 Gift Card Sales
An early analysis of 2020 restaurant gift card sales by Paytronix Systems, Inc., found that while holiday card sales accounted for the same percentage of annual sales as previous years, overall card sales ended the year down 31.8 percent when compared with 2019. Per-card spending remained relatively consistent when compared with previous years.
Paytronix data shows that holiday sales– those that occurred during November and December – accounted for 45.8 percent of all restaurant gift card sales in 2020, and approximately 48.6 percent of all gift card spend. This is on par with the previous three years, during which holiday card sales accounted for an average of 46.3 percent of all annual gift card sales.
Despite a nearly one-third decline in overall card sales, the average dollar amount loaded onto each card remained fairly consistent in 2020, indicating that guests maintained their spending power. Fine Dining restaurants fared exceptionally well in this regard, realizing a 7.7 percent increase in the average spend per gift card over the course of the year.
Full Service Restaurants (FSRs), meanwhile, took the brunt of the losses in 2020. FSRs’ share of the market fell by more than 15 percent to account for just 26.3 percent of gift card sales across restaurant sectors. The bulk of those sales were recouped by Quick Service Restaurants (QSRs), which accounted for 66.5 percent of sales in 2020. The remaining two restaurant types – Fast Casual and Fine Dining – accounted for 4.5 percent and 2.7 percent of annual gift card sales, respectively.
“Guests appear to have opted for either QSRs or Fine Dining over FSRs in 2020. QSRs have emerged as the big winner throughout the pandemic, so it’s no surprise to see them with strong gift card numbers. The Fine Dining category is interesting, because it suggests that people still crave a dining experience, either through high-quality food or in the hope that they can dine-in soon,” said Lee Barnes, head of Paytronix Data Insights.
Even as sales were lower this year, traditional sales patterns continued to hold. The holiday season kicked off with Black Friday sales down 30.1 percent from previous years, then experienced a last-minute peak in the last few days leading up to Christmas.
The holiday sales analysis is a key component in the development of the Paytronix Annual Gift Card Sales Report, which will be available later this year.
Dining Trends
HealthCare.com released a survey of American dining trends in the new year.
Among the key highlights:
- 40 percent said they already feel comfortable shopping indoors, followed by 30 percent who said hugging someone close, and 26 percent who said they’re already comfortable drinking and dining indoors.
- They asked pollees when they’d feel comfortable resuming ten specific activities of normal life. Pluralities of respondents also favored summer 2021 for drinking and dining indoors (16 percent), working out in a gym (10 percent), shopping indoors (14 percent), and hugging someone close (14 percent).
- Only 4 percent said outdoor dining was the trend most likely to continue.
They crunched the data and found some more disparities as it relates to indoor dining comfort levels.
- Males (14 percent) are 40 percent more likely than females (10 percent) to feel comfortable drinking and dining indoors in spring 2021.
- Millennials (14 percent) are almost 30 percent more likely than Baby Boomers (11 percent) to feel comfortable drinking and dining indoors in spring 2021.
- People in the Midwest (29 percent) and South (27 percent) are more likely than people in the Northeast (25 percent) or West (22 percent) to say they already feel comfortable drinking and dining indoors.
- Whites (29 percent) are more likely than Blacks (22 percent) or Hispanics (17 percent) to say they already feel comfortable drinking and dining indoors.
- People without a high school diploma (14 percent) or with only a high school diploma (13 percent) are more likely than college grads (9 percent) or post-grads (8 percent) to feel comfortable drinking and dining indoors in spring 2021.
- Whites (8 percent) are more than twice as likely as blacks (3 percent), and well more than Hispanics (5 percent), to cite drinking and dining indoors as an activity they look forward to when the pandemic ends.
- College grads (10 percent) and post grads (9 percent) are twice or almost twice more likely than high school grads or those without a high school diploma (5 percent) to cite drinking and dining indoors as an activity they look forward to when the pandemic ends.
- People with incomes over $80k (9 percent) are almost twice more likely than those with incomes under $40k (5 percent) to cite drinking and dining indoors as an activity they look forward to when the pandemic ends.
For full survey results, click here.
Going Local
Despite the rapid rise in digital orders, IHL Group released research that shows close to 90 percent of all orders in 2021 are expected to be fulfilled by local stores. The study, 2021 Store Matters: How Retail Still Runs Through Local Stores in Digital Age, surveyed over 300 top retail brands about their plans and sales expectations for 2021 and the conclusion was clear that the local store is key to success moving forward for profitable order fulfillment.
The research study also investigated the hottest technologies being deployed by retailers to aid their transformation to position for the future of retailing.
“The most significant area of investment for retailers are those technologies that allow for digital orders to be fulfilled by local stores more profitably,” said Greg Buzek, President of IHL Group. “The average retailer is losing 3-8 points of margin with every digital order for store fulfillment compared to traditional store sales. So, all things related to better inventory management, better planning, and better execution are in play for 2021.”
According to the study these investments include a move to edge computing for better architecture, 2ndinventory locations within stores specifically for digital orders and the use of dark stores (locations that are only for local digital order fulfillment) instead of building new full-service locations as well as the technologies to support these strategies.
“We are also seeing the rapid adoption of technologies that are touchless for associates in the store such as more self-checkout, kiosks, electronic shelf labels, digital signage and robotics,” said Buzek. “Several technologies that have been held back in previous years because they typically were justified by labor savings only have now been positioned as ‘associate and customer safety’ and are seeing rapid adoption that should continue over the next 18 months.”
2021’s Best Cities for Locavores
Eating locally is in — again. During the pandemic, Americans renewed their appetite for the “locavore” diet, which consists of food from local places like nearby gardens, farmers markets, and farm-to-table restaurants.restaurants.
Before lockdowns, nearly three-quarters of Americans were already eating locally produced food. A recent surge in direct farm-to-consumer sales suggests the trend has continued to grow.
But not all U.S. cities are equally suitable for meeting the needs of locavores. That’s why LawnStarter crunched the numbers to determine 2021’s Best Cities for Locavores. They compared the 150 biggest U.S. cities across 14 key indicators of locavore-friendliness. They range from the prevalence of community-supported agriculture and farm-to-table restaurants to the sales of farm-to-consumer food per capita.
Among the key findings:
Suburbs on a Plate: While many of America’s largest cities find themselves ranked middle- to low-tier, satellite cities control most of the top spots on our list. Suburbs like Vancouver, WA — north of Portland — and Yonkers, NY — just outside the Big Apple — are ideal locations between urban amenities, such as bakeries and vegan restaurants, while still being a short drive from local farms.
California Grown: The Golden State dominates our rankings, claiming 10 of the top 20 cities. The reasons are obvious: California is an agricultural powerhouse. One-third of all vegetables and two-thirds of all U.S. fruits and nuts come from this single state. It’s certainly easier to eat local when much of the nation’s food supply is just down the road.
No Water in the Desert: Three of the 10 lowest-ranked cities are in Texas, with the 11th lowest hailing from the Lonestar State, as well. Amarillo was at the very bottom of our “Access” category, with only a single butcher shop and craft brewery per 100,000 residents. Other Texas cities ranked poorly, but these four near the bottom are all located in arid West Texas, where local produce is difficult to come by.
The full ranking and analysis can be found here.
How did the cities fare? Here are the top and bottom 10 performers.
|
Best Cities for Locavores |
|
|
Rank |
City |
|
1 |
Santa Rosa, CA |
|
2 |
Ontario, CA |
|
3 |
Salem, OR |
|
4 |
Vancouver, WA |
|
5 |
Worcester, MA |
|
6 |
Anaheim, CA |
|
7 |
Yonkers, NY |
|
8 |
Jersey City, NJ |
|
9 |
Fort Lauderdale, FL |
|
10 |
Hialeah, FL |
|
Worst Cities for Locavores |
|
|
Rank |
City |
|
141 |
Lubbock, TX |
|
142 |
Chicago, IL |
|
143 |
Lincoln, NE |
|
144 |
Omaha, NE |
|
145 |
Laredo, TX |
|
146 |
Colorado Springs, CO |
|
147 |
Wichita, KS |
|
148 |
Amarillo, TX |
|
149 |
Sioux Falls, SD |
|
150 |
Anchorage, AK |