MRM Research Roundup: Mid-January 2019 Edition
24 Min Read By MRM Staff
This first-of-2019 edition of Modern Restaurant Management (MRM) magazine's Research Roundup features news on America's favorite fast casual brands from Market Force, the most popular delivery items last year from Bite Squad, the importance of sensory experience from Mood Media, pricing trends from Plate IQ and more.
2018 Was Best Year for Restaurants Since 2015
December closed the year strong for the restaurant industry. December’s same-store sales growth of 2.0 percent was the best monthly performance in over three years, according to TDn2K. The fourth quarter of 2018 was also encouraging for the industry. Not only was the quarter’s same-store sales growth of 1.4 percent the best in over three years, but the industry was able to achieve those results on top of the only quarter with positive sales growth in 2017. From an annual perspective, 2018 saw the industry return to a positive same-store sales growth of 0.7 percent, after two years of declining sales.
As upbeat as these sales results sound, the industry continues to suffer from declining guest counts. Same-store traffic growth was -0.9 percent in December. Traffic growth closed the year at -1.6 percent for the fourth quarter. It continues to be through an acceleration in average spending per guest that the industry can produce positive sales growth amid the persistently falling guest counts. Average guest checks grew by 3.1 percent during the fourth quarter year over year.
Restaurant sales were strong across most of the country during December, another positive sign for the industry. From the 197 DMAs tracked by Black Box Intelligence, 84 percent were able to post positive same-store sales growth. To put this number in perspective, as strong a year as the industry has had, the percentage of markets with positive sales growth never topped 76 percent during the first eleven months of the year.
Furthermore, from a wider, regional perspective, the strength of the industry’s sales growth also becomes apparent. All ten regions of the country except for Florida had strong positive same-store sales growth of 1.0 or better during December. In the case of Florida, sales growth was essentially flat.
According to TDn2K research, one of the keys to restaurant success in the marketplace is delivering superior service. However, this is increasingly difficult to accomplish given the rising staffing difficulties facing the industry. It is not surprising to hear most operators say most of their restaurants are understaffed and it is harder today to find enough qualified employees.
Not only is the restaurant continuing to add a significant number of jobs (restaurant employment has grown by over 1.8 percent year over year during the last two months), but the number of vacancies that need to be filled because of turnover are still rising.
Among the solutions companies are employing to aid in their retention are adjustments to their compensation offerings, improving engagement for their managers and providing training and development opportunities throughout their employee ranks.
2018 Year End Results
|
December |
Q4 |
2018 |
|
|
Comp sales |
2.0 percent |
1.4 percent |
0.7 percent |
|
Comp traffic |
-0.9 percent |
-1.6 percent |
-1.9 percent |
|
Guest check |
3.0 percent |
3.1 percent |
2.6 percent |
The restaurant industry had plenty to celebrate during the holiday season. December’s same-store sales growth of +2.0 percent was the highest since August of 2015. December became the seventh consecutive month of positive growth, which highlights the industry’s strength throughout the year. By comparison, the industry was only able to post positive sales growth during two months in all of 2017. These insights come from TDn2K’s Black Box Intelligence™ data, based on weekly sales from over 31,000 locations representing 170+ brands and nearly $72 billion in annual sales.
“Perhaps the most encouraging news for the industry came in the form of the unusually strong fourth quarter results,” said Victor Fernandez, vice president of insights and knowledge for TDn2K. “Same-store sales growth during the fourth quarter was +1.4 percent, which was the highest in over three years. Moreover, the industry was able to post these results on top of the only quarter with positive sales growth last year. The industry’s recovery from a longer-term perspective also continued to show some upward momentum. Same-store sales during the fourth quarter increased by slightly over 1.4 percent compared with the same period in 2016. Two-year sales growth had been negative for the past eight consecutive quarters.
Annual same-store sales growth for 2018 was +0.7 percent. Though only moderate growth, this is also the best performance by the industry since 2015.
According to government numbers, as a country, Americans have spent more on food away from home than on food at home over the last few years. But an acceleration in restaurant prices compared with groceries and a growing field of competing dining options continue to translate into what seems to be the new normal in chain restaurant performance. Even when sales are up, the industry continues to suffer from declining same-store guest counts.
Even when sales are up, the industry continues to suffer from declining same-store guest counts.
Same-store traffic growth during December was -0.9 percent, while traffic growth for the fourth quarter was -1.6 percent. The latter represented a +0.4 percentage point decline from the previous quarter’s growth rate.
“Although the importance of persistently declining guest counts cannot be overlooked, there are some small signs of recovery in the latest results,” commented Fernandez. “Two-year same-store traffic growth was -3.6 percent during the fourth quarter of 2018. The average two-year growth for the first three quarters of the year was -5.8 percent.
How was the industry able to post its best sales results in years during the fourth quarter, yet traffic growth worsened compared with the previous quarter? The answer is the rate at which restaurant guests are spending per visit accelerated during the quarter. Average guest checks grew by 3.1 percent year over year in the fourth quarter. During the previous three years, average guest check growth never topped 2.5 percent.
“While many brands utilized heavy discounting and price promotions in 2017, average guest checks only grew by 1.9 percent during the year for the industry. Restaurants seem to have eased off this tactic in 2018,” continued Fernandez. “Guest check growth for this year was a significantly higher 2.6 percent pointing to price increases and/or an upward shift in product mix.”
Based on same-store sales growth, the best performing industry segments during 2018 were fast casual and casual dining. But the real story behind these segments’ performance is one of improvement after a previous year of abysmal results. These segments were the worst performers based on same-store sales growth during 2017. The fact that they had soft comparisons the previous year definitely helped boost their results in 2018.
From a consistency point of view, the real winners are the segments with the highest average checks: upscale casual and fine dining. Not only did both of these segments have strong positive growth in 2018, but they are also the only industry segments that were able to sustain positive sales growth averaged over the last three years.
The upscale casual and fine dining segments also have the best average traffic growth results since 2015, but even they cannot escape the trend of declining guest counts that plagues the rest of the industry.
“The chaos in the equity markets was not representative of the condition of the economy,” explained Joel Naroff, president of Naroff Economic Advisors and TDn2K economist. “Nothing made that clearer than the huge December increase in employment. Businesses are still hiring and that is causing wages to rise faster. As a result, consumer spending is holding up and should continue to do so, which is good news for the restaurant industry.”
“However, most indicators point to a moderation in growth going forward, but only from strong to a more sustainable, yet decent, pace. A recession does not appear to be likely anytime soon and if a major slowdown occurs, it probably would not come before late in the year. Though the moderate growth should support continued improvement in restaurant sales, it will also lead to lower unemployment rates and even greater pressure on wages.”
The extremely tight labor market, which undoubtedly helps on the sales side of the equation for restaurants, continues to disrupt the operations side through its effect on staffing levels. On one hand, in this environment operators are increasingly having difficulty finding enough employees to fully staff their restaurants. According to TDn2K’s latest People Report Workforce Index, 74 percent of companies reported increased difficulty finding qualified hourly employees. Perhaps most concerning, 59 percent said they are having a tougher time hiring people to manage those restaurants.
One reason the vast majority of restaurants reported they are constantly understaffed, especially in the back of the house positions, is that restaurant turnover continues to increase. Based on People Report research, during the first eleven months of 2018, median turnover increased for hourly employees and restaurant managers in both limited service brands (quick service and fast casual) and full service brands (casual dining, family dining, upscale casual and fine dining). All levels of restaurant employees have been experiencing historically high turnover rates. Given that turnover is rising proportionally more for restaurant managers than for hourly employees in both service styles (limited and full service), the expectation is for staffing headaches to carry into 2019. Management turnover, TDn2K research has revealed, is a leading indicator of hourly retention as well as restaurant sales and traffic performance. It is those brands that are successful at retaining and developing engaged managers who will be better positioned to win the market share battle in the new year.
America’s Favorite Fast Casual Restaurants
The casual dining sector appears to be rebounding, with higher customer satisfaction levels in nearly every category, and innovative chains putting serious heat on larger brands, according to a new restaurant industry study by Market Force Information® (Market Force). The annual study of more than 6,700 consumers also reveals America’s favorite casual dining restaurants in seven categories, including general menu, pizza, breakfast, steakhouse, Italian and seafood.
Among the key findings:
- Restaurant app adoption has increased 13 percent in the past two years
- Cracker Barrel won the general menu category after gaining 12 percentage points
- Texas Roadhouse ranked first for steak, Maggiano’s for Italian, Golden Corral for buffet and Bonefish Grill for Seafood
- Just 54 percent of diners have been offered restaurant tablets and, although they use them, many say they don’t improve the dining experience
Maggiano’s Takes First Overall
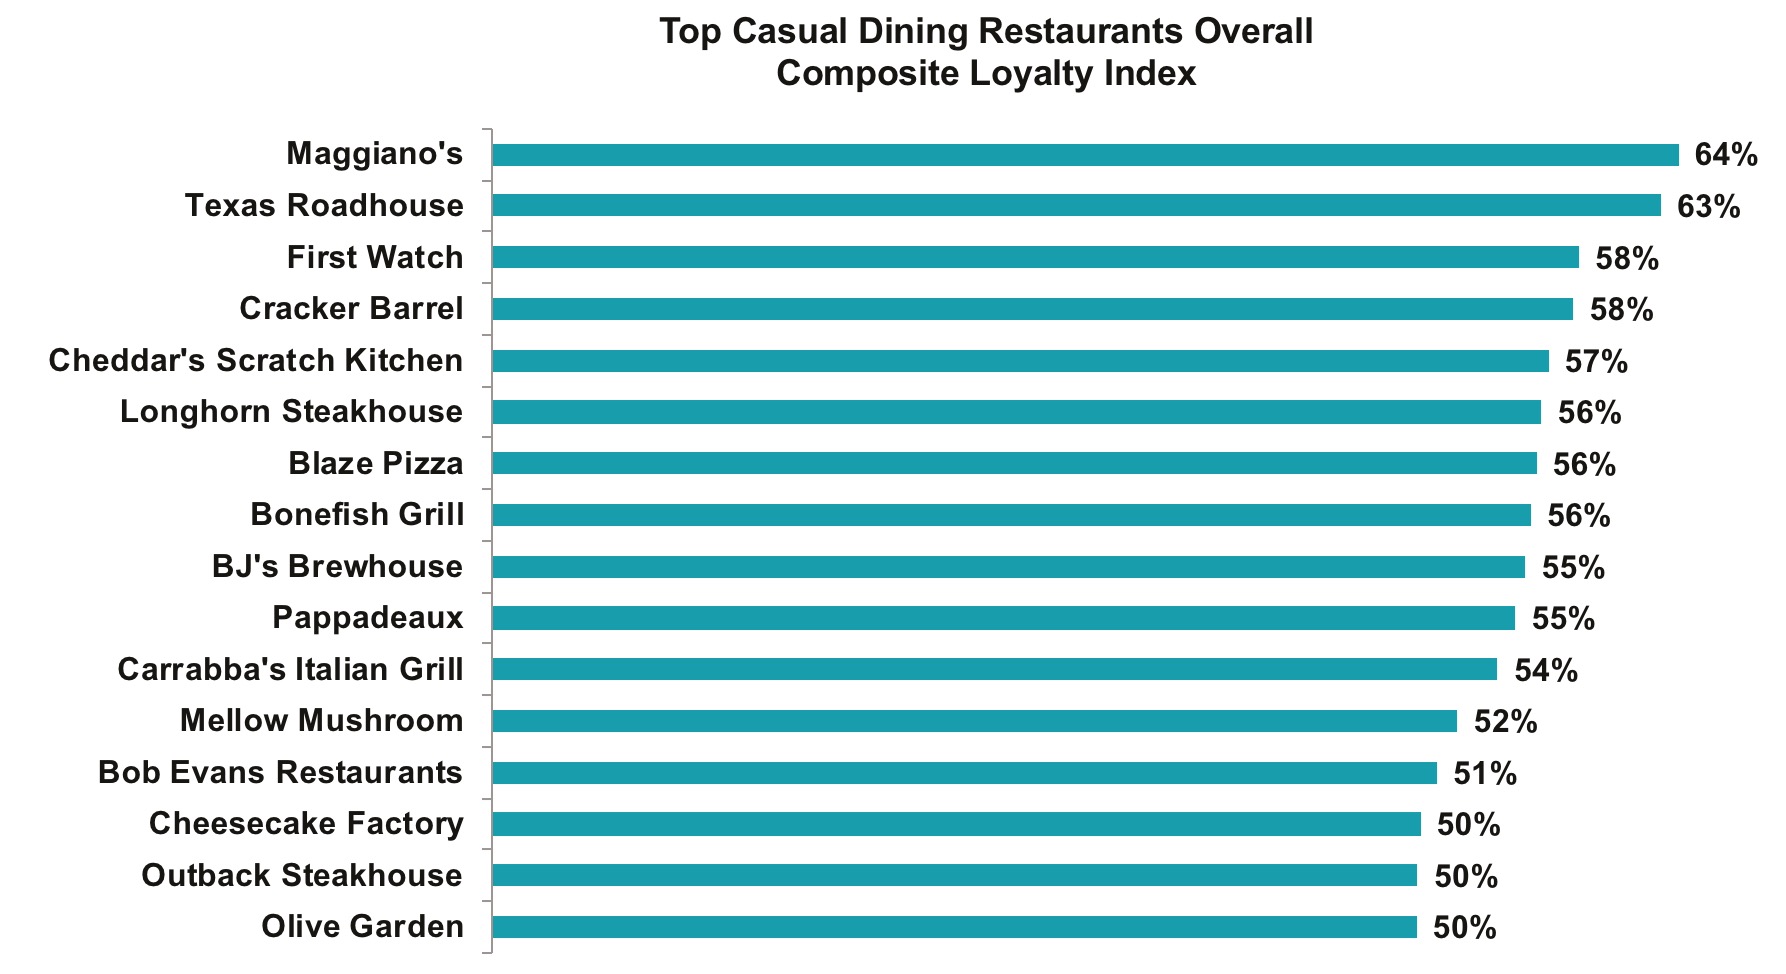
Across all categories studied, Maggiano’s received the highest score on Market Force’s Composite Loyalty Index (CLI) with 64 percent. Texas Roadhouse was a close second with 63 percent, First Watch and Cracker Barrel tied for third with 58 percent, and Cheddar’s Scratch Kitchen was fourth with 57 percent. Last year’s winner, Bonefish Grill, fell four spots to tie for fifth alongside Longhorn Steakhouse and Blaze Pizza.
General Menu Chain Visits Up, Cracker Barrel Leads Category
General menu restaurants are bringing more repeat guests through the door, an aspiration for most casual dining chains looking to boost sales. Eighty-six percent of those polled had dined at a general menu restaurant in the past 90 days, up from 79 percent who did so in 2017, the largest increase of any category.
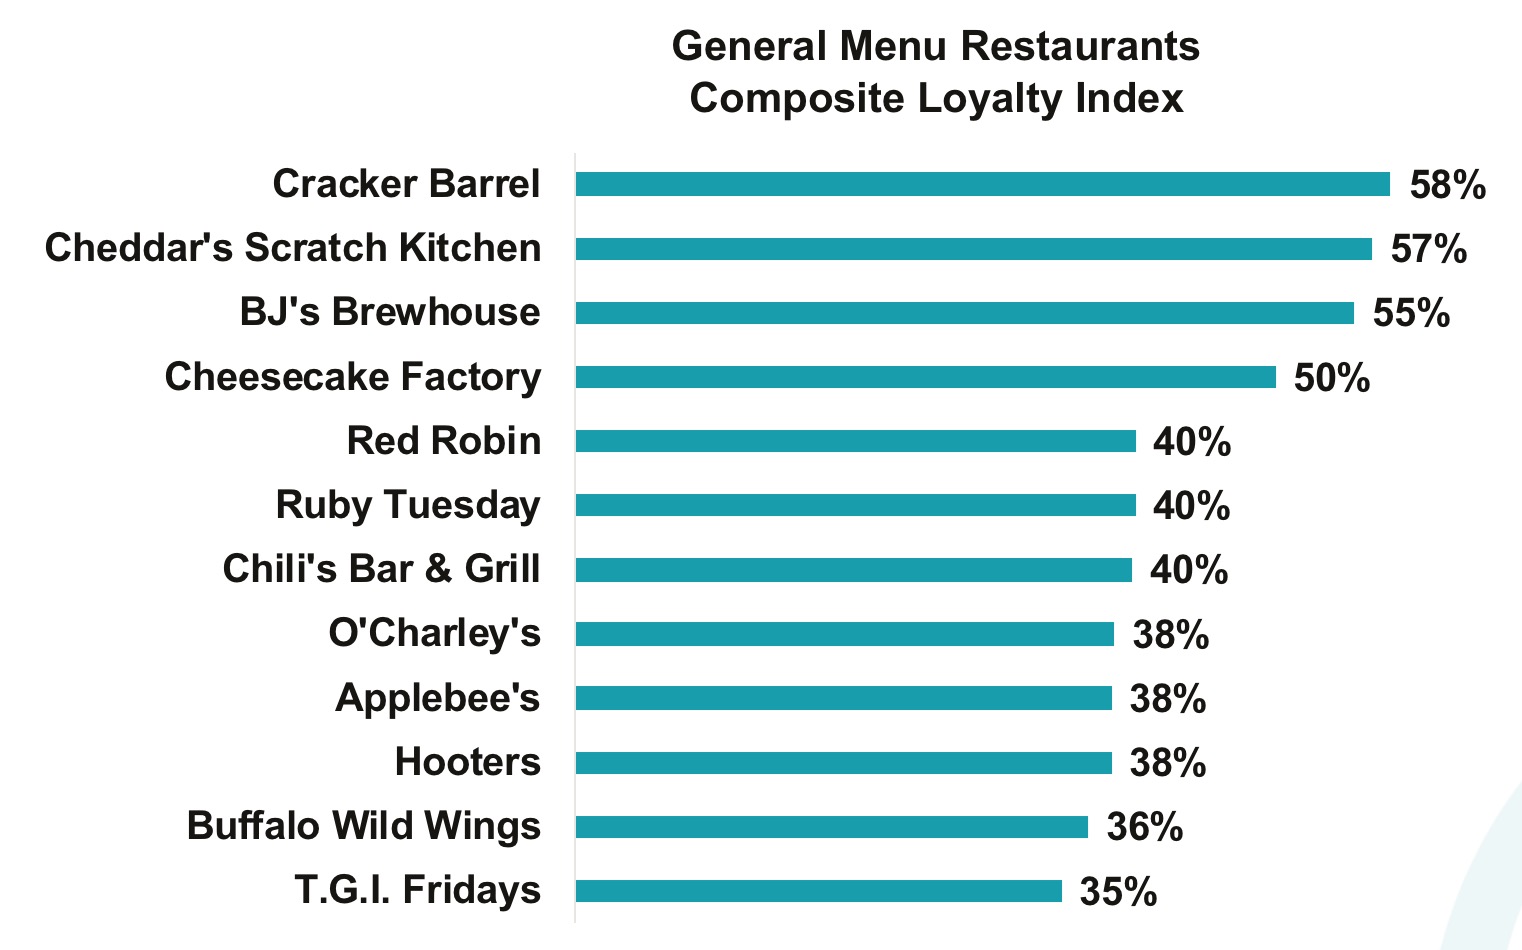
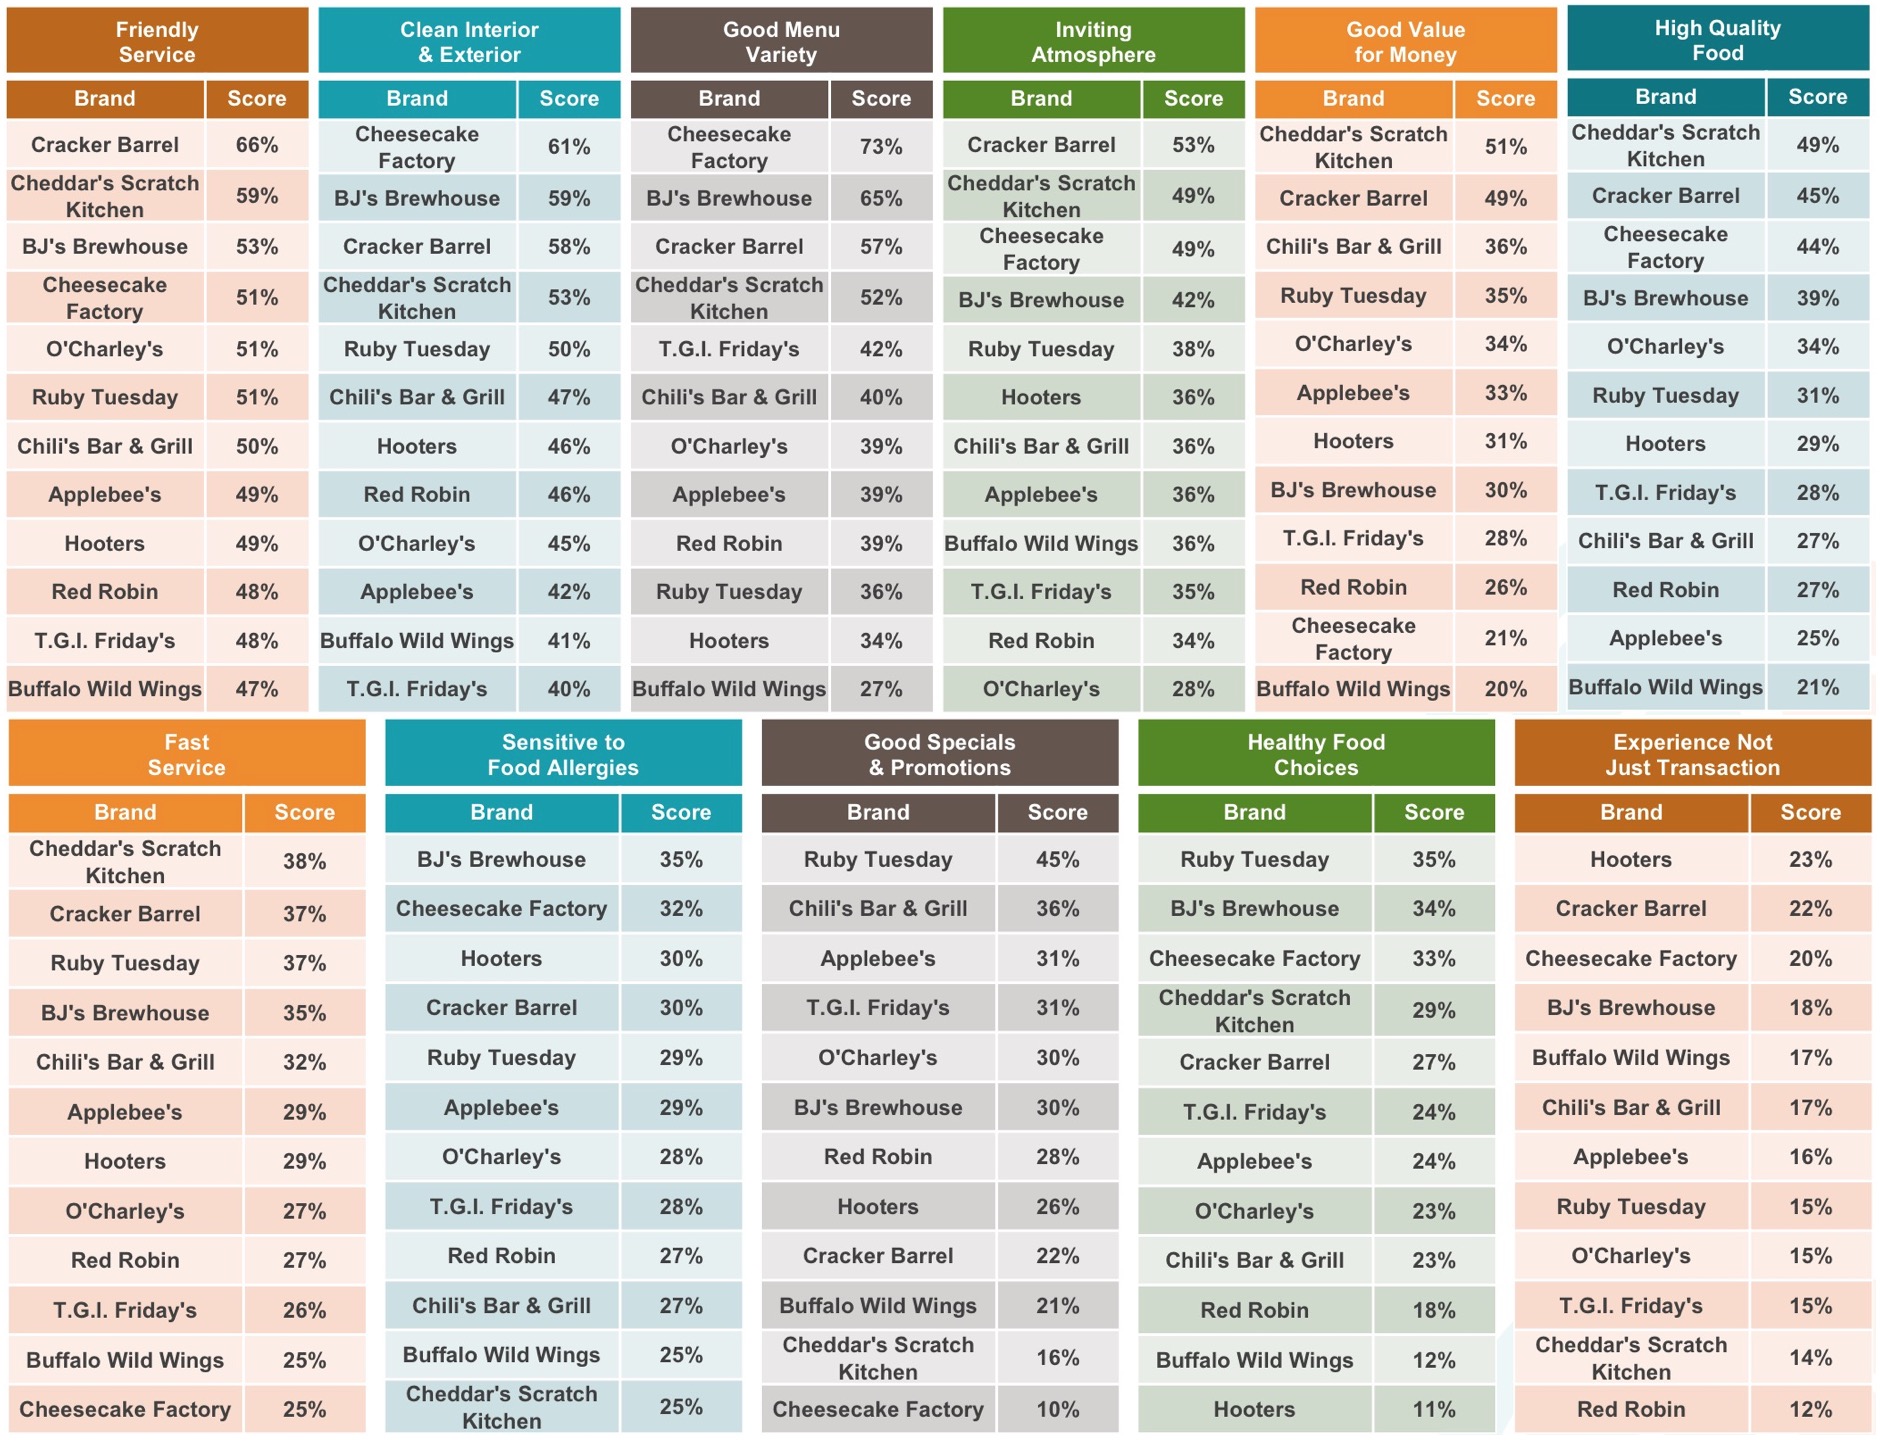
For the most part, every chain in this category is succeeding at delighting guests. Satisfaction scores for nearly all of the general menu chains studied went up significantly over the previous year. Cracker Barrel gained a sizable 12 percentage points to overtake Cheddar’s for the No. 1 spot, and it ranked first for friendly service and atmosphere. Cheddar’s Scratch Kitchen ranked second on the CLI and led in food quality, fast service and value. BJ’s Brewhouse, which saw an 11 percentage point lift, ranked third. Hooter’s also stood out for increasing its score by 12 percentage points over 2017, and ranking highest for delivering an experience, rather than just a transaction.
“Stats show that casual dining hasn’t suffered the same sales slump as the fast casual sector, but they’re not completely out of the woods,” said Brad Christian, chief customer officer for Market Force. “To continue same-store sales growth, casual dining chains rely on repeat visits from loyal guests, particularly since they’re more expensive than fast casual and QSR. These brands should be looking at options such as third-party delivery services, additional promotions and simplifying the ordering process with tablets to continue their strong returns.”
Could Breakfast Be Casual Dining’s New Darling?
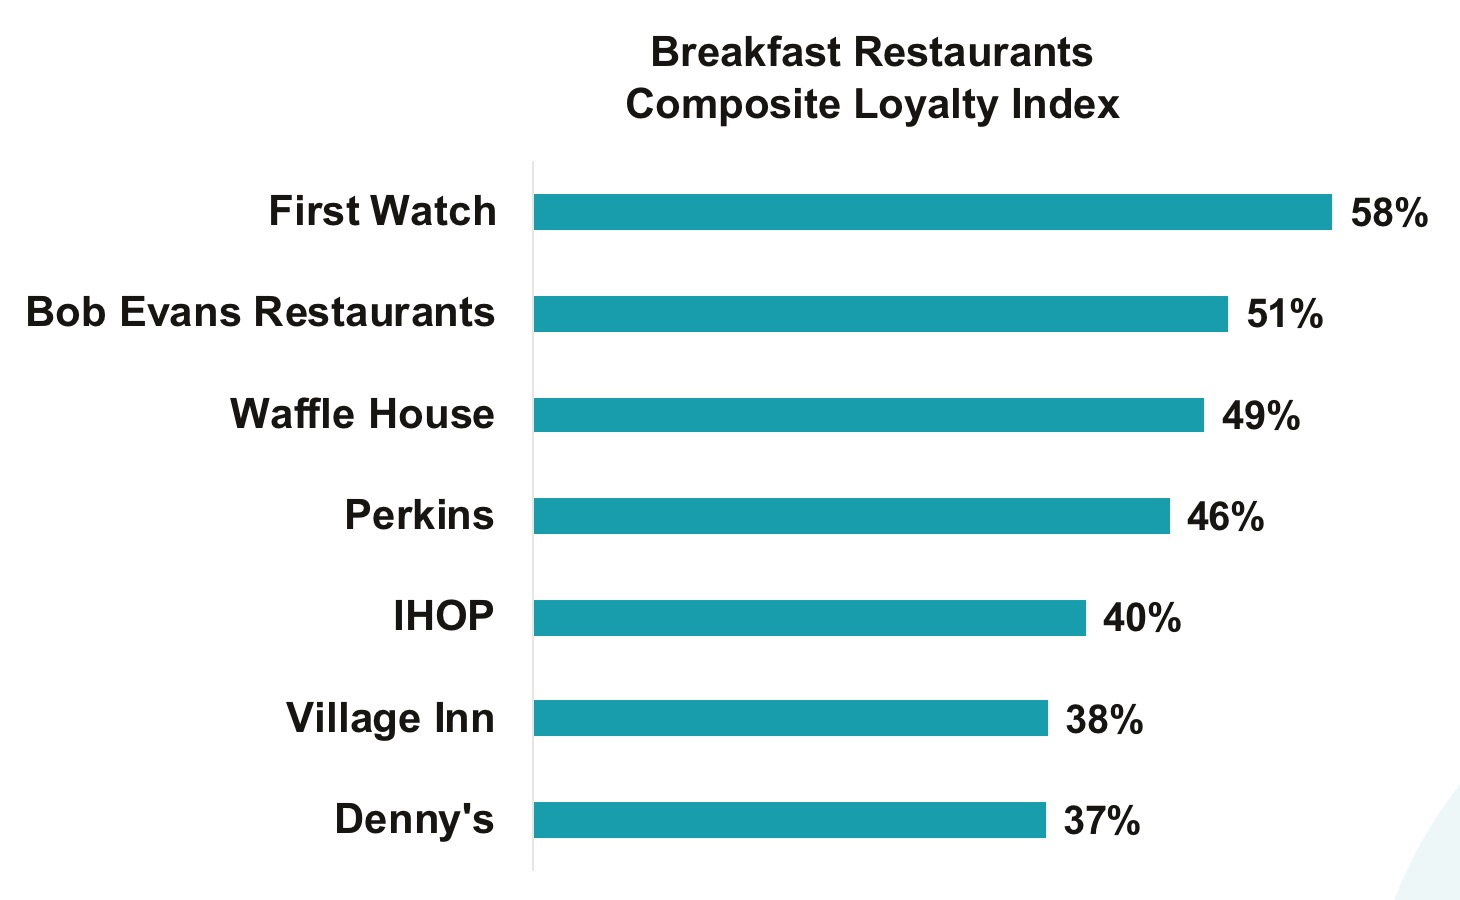
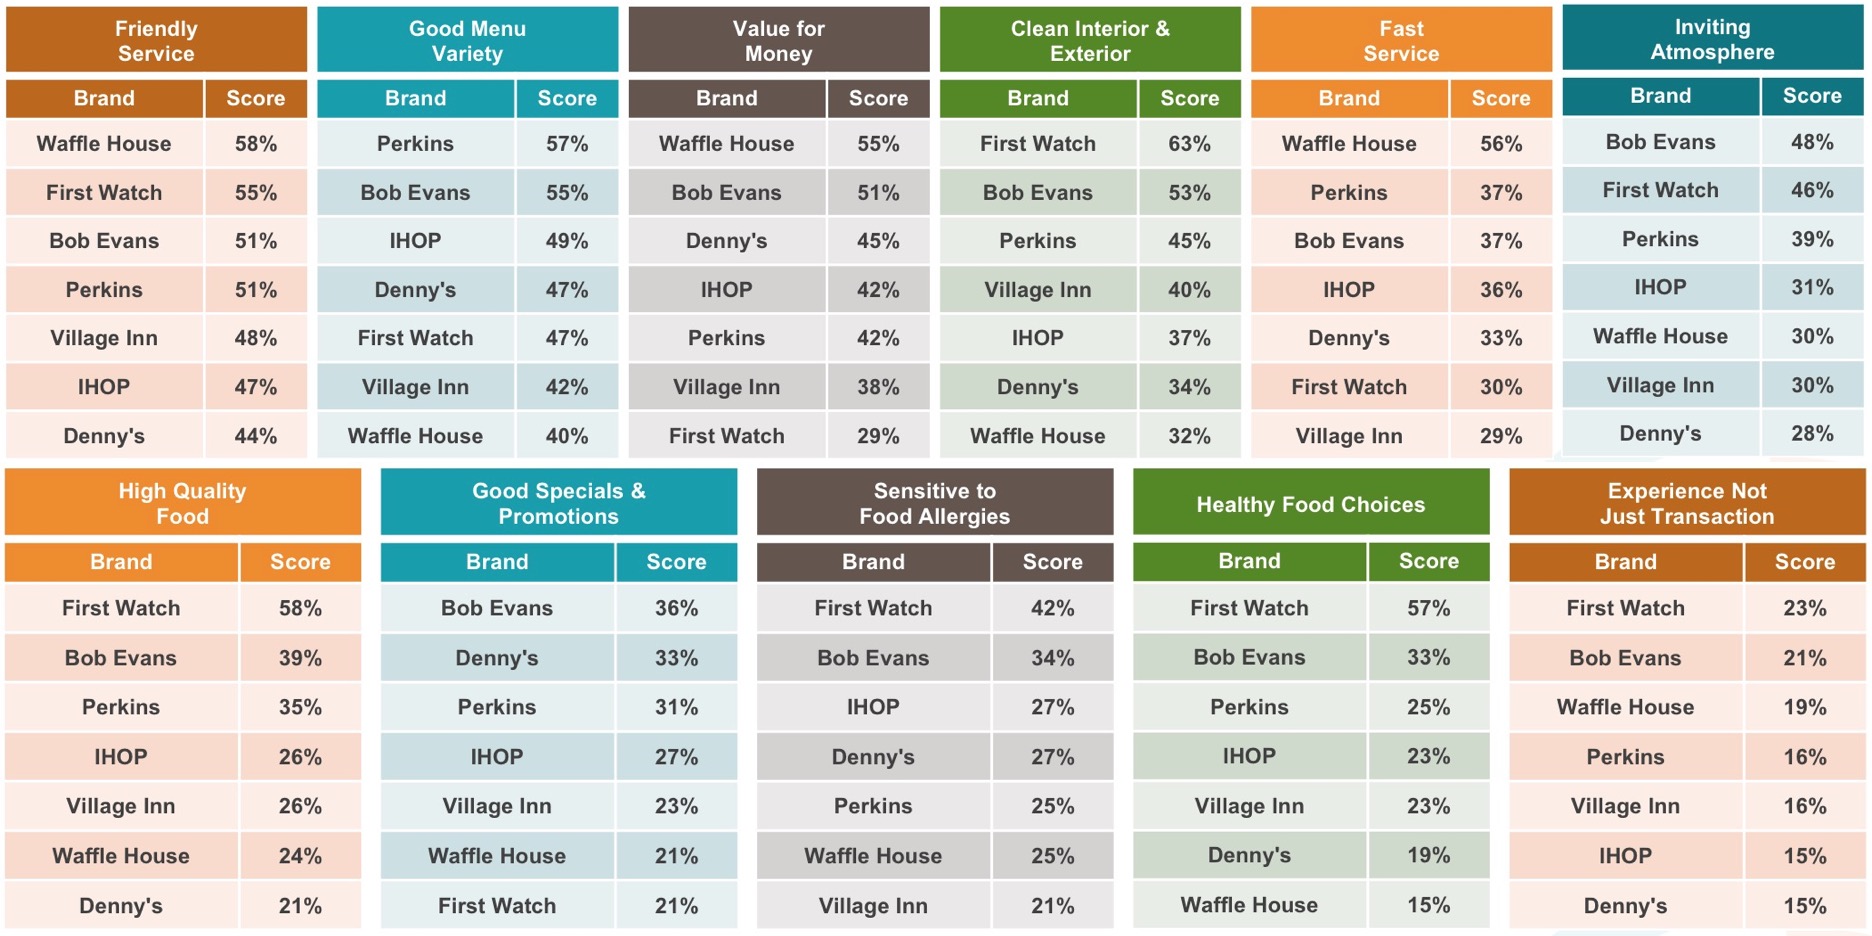
Breakfast and daytime-only restaurant chains are enjoying growing popularity, and First Watch is a prime example. The chain, which boasts fresh, custom-made foods appeared in Market Force’s study for the first time, and captured the top spot in the breakfast category with a CLI score of 58 percent. It dominated in areas such as quality and healthy food, although it ranked last for value. Bob Evans landed in second place with 51 percent, and Waffle House was third with 49 percent. Meanwhile, Village Inn, the 2017 category leader, dropped eight percentage points on the CLI to rank sixth and barely edge out last-ranked Denny’s.
Blaze Pizza on Fire, Mellow Mushroom Psyched
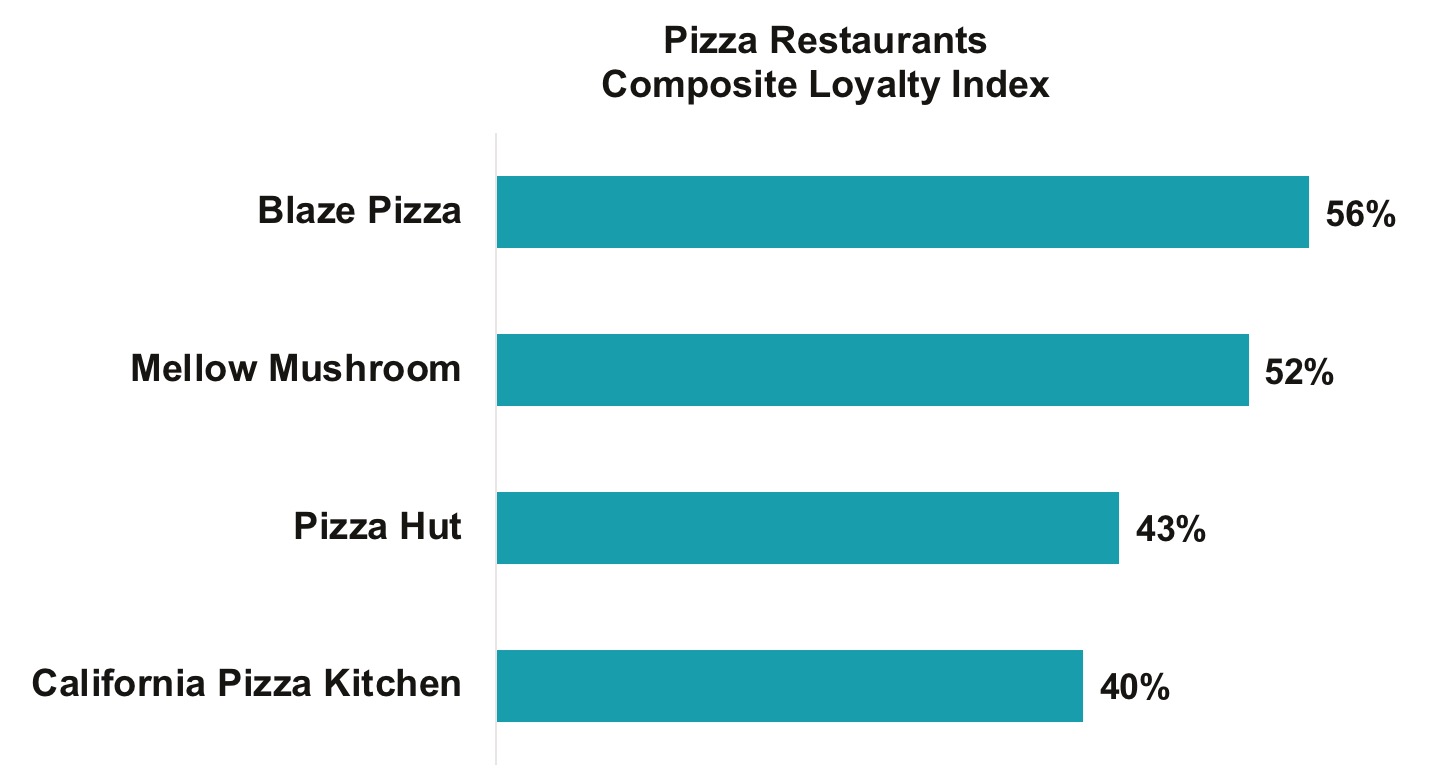
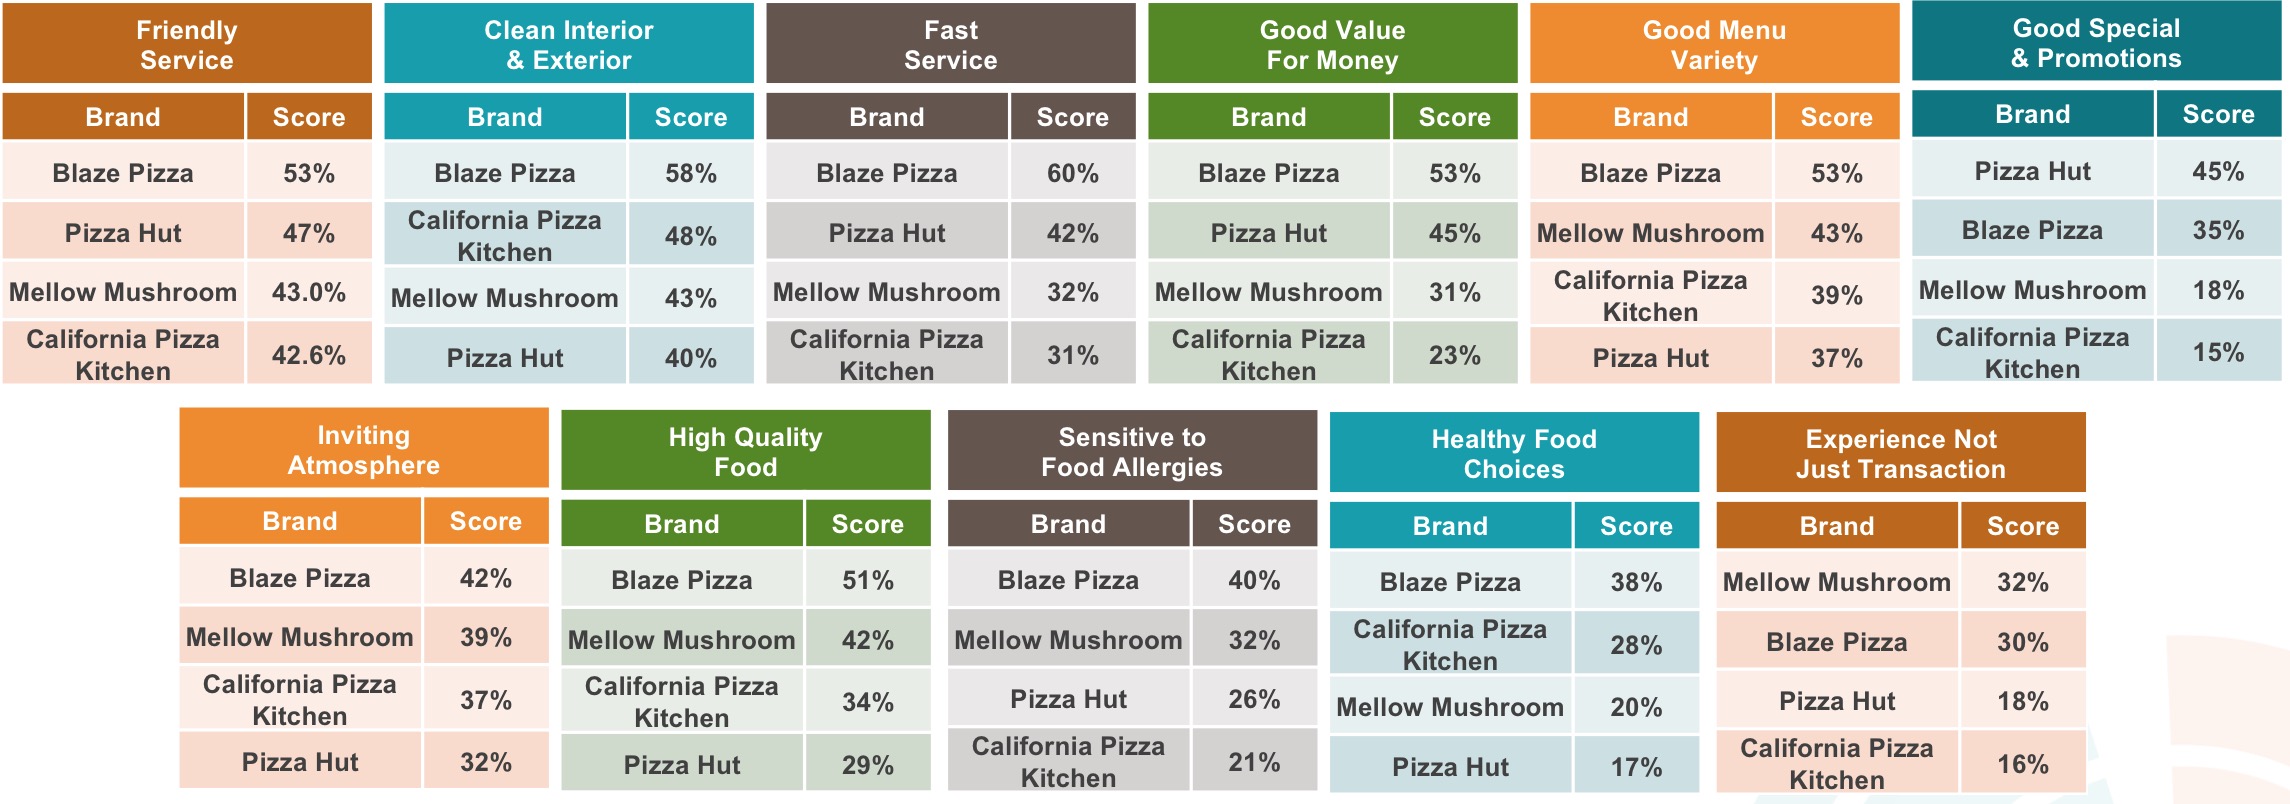
Pizza is another category that saw a shake-up in the 2018 study, with Blaze Pizza and Mellow Mushroom both joining the rankings for the first time and taking the No. 1 and No. 2 spots, respectively. The newcomers bested third-place Pizza Hut and fourth-place California Pizza Kitchen. Blaze Pizza, which has a made-to-order approach and saw its sales skyrocket to $279 million in 2017, dominated in important areas such as fast service, value and healthy options.
Texas Roadhouse Wins Battle of Beef
For the fourth consecutive year, Texas Roadhouse has been named America’s favorite steakhouse chain, earning a 63 percent score, up from 57 percent in 2017. Longhorn Steakhouse received a 56 percent to again land in second place, while Outback Steakhouse ranked third with 50 percent and Logan’s Roadhouse ranked fourth with 47 percent. Texas Roadhouse had generous leads in value and service, while Outback was found to offer the healthiest choices.
Maggiano’s Five-Peats in Italian Category
Overall CLI winner Maggiano’s also scored first in the Italian category for the fifth year running with a score of 64 percent, a four percentage point increase from the previous study. Carrabba’s ranked second with 54 percent and Olive Garden was third with 50 percent. Maggiano’s was found to have the best food and best value, which can be a difficult but critical balance to achieve in casual dining segment.
Golden Corral Lassoes Lead Among Buffet Chains
Growth in the buffet sector has been stagnant, with just 24 percent of respondents dining at a buffet chain in the past 90 days – the same as in 2017. Golden Corral was the clear leader among the three chains studied, followed by Cici’s Pizza and Pizza Hut. Additionally, Golden Corral led by a large margin in categories such as variety and healthy options, although Cici’s was found to be the value leader.
Seafood Remains Sluggish
Seafood restaurants also failed to increase visitors over the previous year and, in fact, has the fewest visits of any category in this study. Bonefish Grill managed to eek out a first place finish with a CLI score of 56 percent, despite dropping 12 percentage points from the previous study. It barely edged out Pappadeaux, which earned 55 percent, and Red Lobster came in third with 48 percent. Bonefish Grill scored exceptionally high for its atmosphere and cleanliness, as well as for food, an area where Red Lobster trailed considerably.
Apps Gaining Influence, While Tablets Falling Short
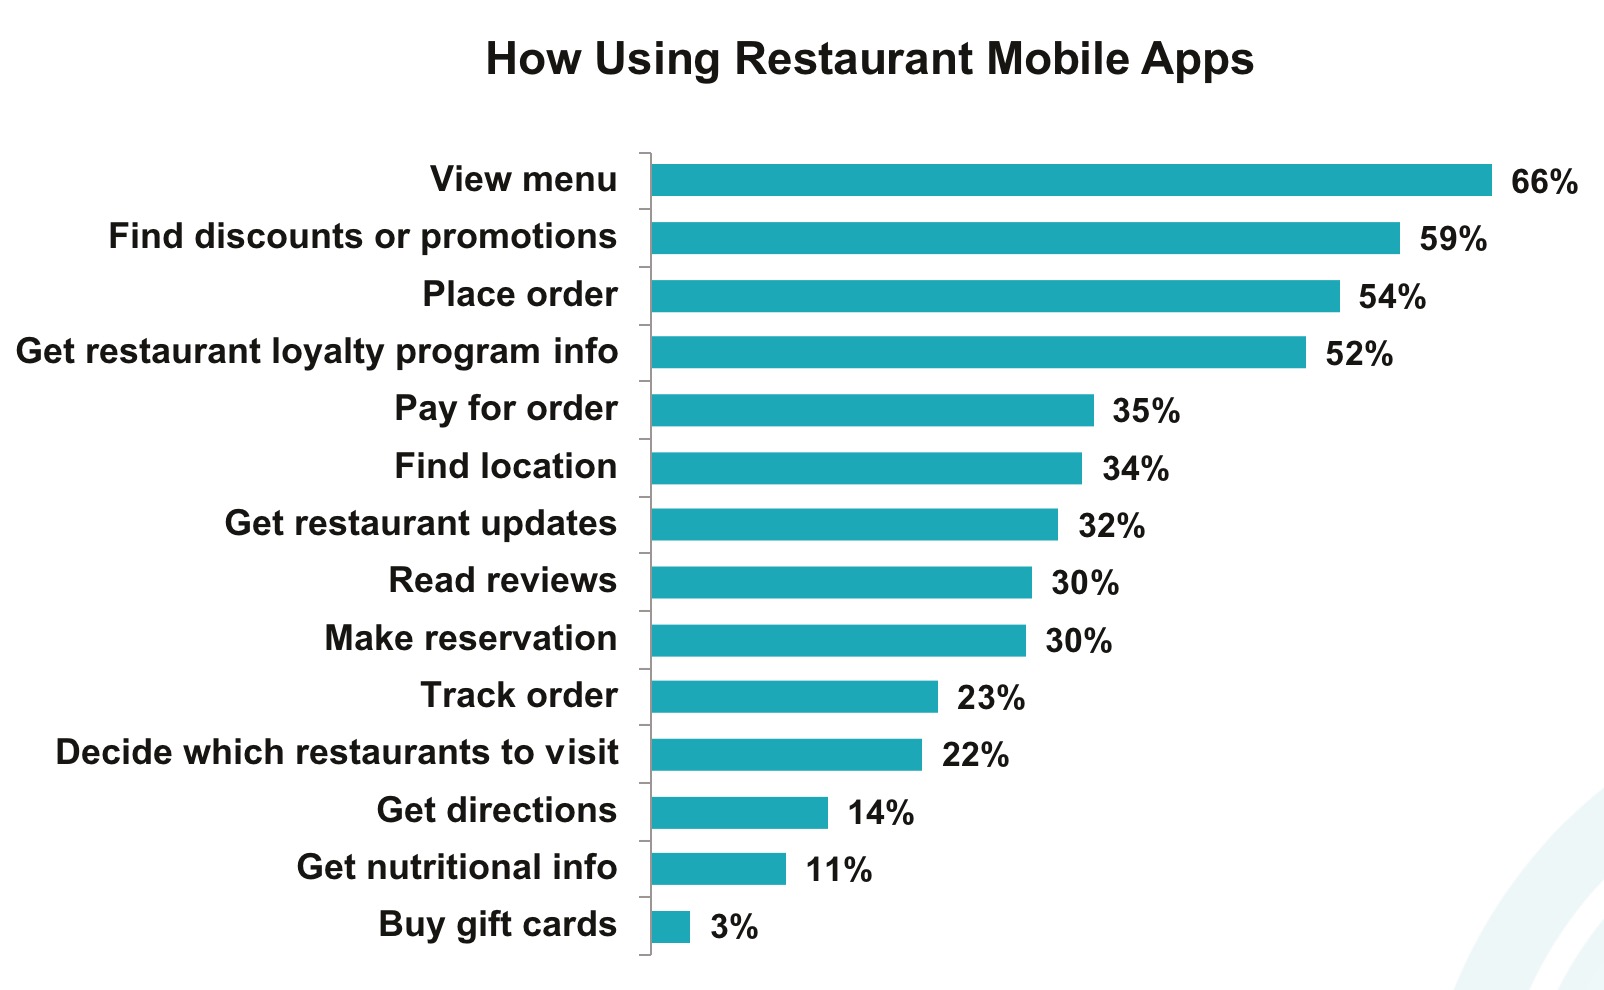
There number of restaurant apps continues to grow, as does adoption among all age groups. In 2018, 54 percent said they downloaded a restaurant app, a 13 percent increase from 2016 when just 41 percent had done so. Restaurant-branded apps are the most downloaded, followed by Groupon, Yelp and Grubhub. Two-thirds of consumers polled are using them to view the menu, 59 percent to find discounts and just 54 percent to place orders.. Of the top apps, Yelp is most likely to impact restaurant choice, although Grubhub and UberEATS is where consumers go most frequently to post positive or negative comments about their dining experience.
The study also found that between seven to 12 percent of consumers are consulting social media reviews before dining at a specific restaurant – those dining at breakfast and Italian chains are checking them less often, while general menu diners are checking them most often. Yelp and Facebook are far and away the most popular social channels for reading reviews prior to dining.
Tabletop tablet adoption in casual dining restaurants remains lackluster, despite guests’ willingness to use them. Fifty-four percent (a drop from 58 percent in 2017) said they were given a restaurant-owned tablet while dining in 2018, and 90 percent of those used it. However, just one-fifth said using tablets made the dining experience more enjoyable. The majority are using tablets to pay the bill, look at the menu or play games, and few are using them to place an order.
For the favorite rankings, Market Force asked participants to rate their satisfaction with their last experience at a casual dining chain, and their likelihood to recommend it to others. That data was averaged to rate each brand on an aggregation of the two measures – a Composite Loyalty Index. Only brands that received 100 or more reviews were included in the rankings. The survey was conducted online in November 2018 across the United States. The pool of 6,724 respondents represented a cross-section of the four Census regions and reflected a broad spectrum of income levels, with 56 percent reporting household incomes of more than $50,000 a year. Respondents’ ages ranged from 18 to over 65. Approximately 74 percent were female, 25 percent were male and 1 percent preferred not to answer.
Most Popular Delivery Items in 2018
Bite Squad announced its most popular delivery picks of 2018. Drivers in more than 375 cities saw foods of all varieties reach the doorsteps of hungry customers—and while everyone has their unique tastes, this year revealed some major trends across the board.
Wings increased an impressive 95 percent year over year, securing the top spot on the list, while traditional American favorites, such as burgers and pizza, also held steady in the top 10. A number of ethnic dishes, such as Pad Thai, sushi and fried rice, made their mark as customer favorites, and Valentine’s Day stood out as the number one holiday for couples ordering in. From Sunday tailgates to Taco Tuesdays, 2018 proved that there is a food for every occasion.
The top ten most ordered foods across the country include:
1. Wings
2. Burger
3. Pizza
4. Burrito
5. Fried Rice
6. Pad Thai
7. Sushi
8. Fajitas
9. Cheeseburger
10. Curry
How do local city’s stats measure up? For more information, click here.
2019 Menu Trends
The National Restaurant Association works with the American Culinary Federation for its annual chefs’ survey of menu trends for the coming year. This year, the Culinary Institute of America- trained chefs identified concept trends, such as zero-waste cooking, hyper-local ingredients and plant-based protein. They ranked 140 items as top trends, yesterday’s news or perennial favorites, as well as by category.
Top Trends
- Cannabis/CBD-infused drinks
- Cannabis/CBD-infused food
- Zero-waste cooking (elevated cuisine using food scraps)
- Globally inspired break- fast dishes
- Global flavors in kids’ meals
- Hyper-local (e.g. restau- rant gardens, onsite beer brewing, house-made items)
- New cuts of meat (e.g. shoulder tender, oyster steak, Vegas Strip Steak, Merlot cut)
- Veggie-centric/ vegetable-forward
- cuisine (e.g. fresh produce is star of the dish)
- Chef-driven fast-casual concepts
- Craft/artisan/locally produced spirits
Pricing Trends
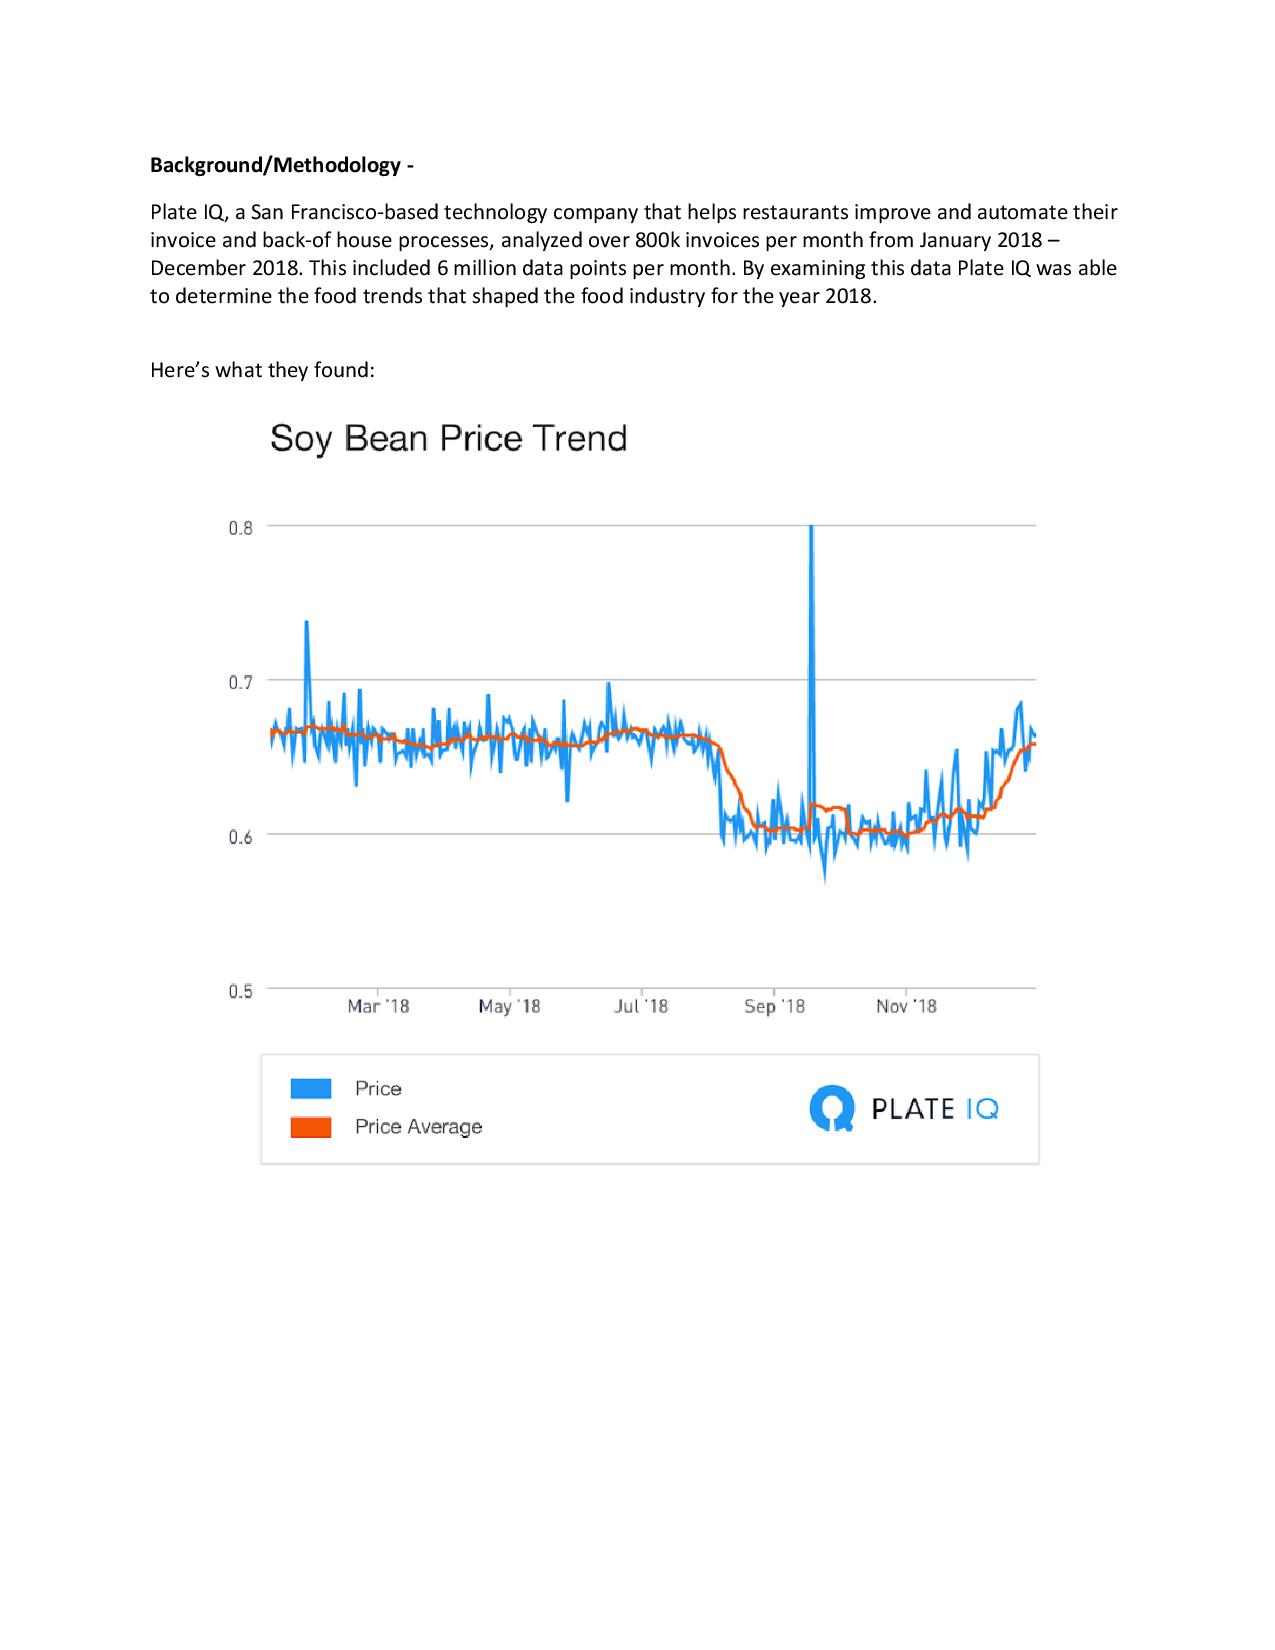
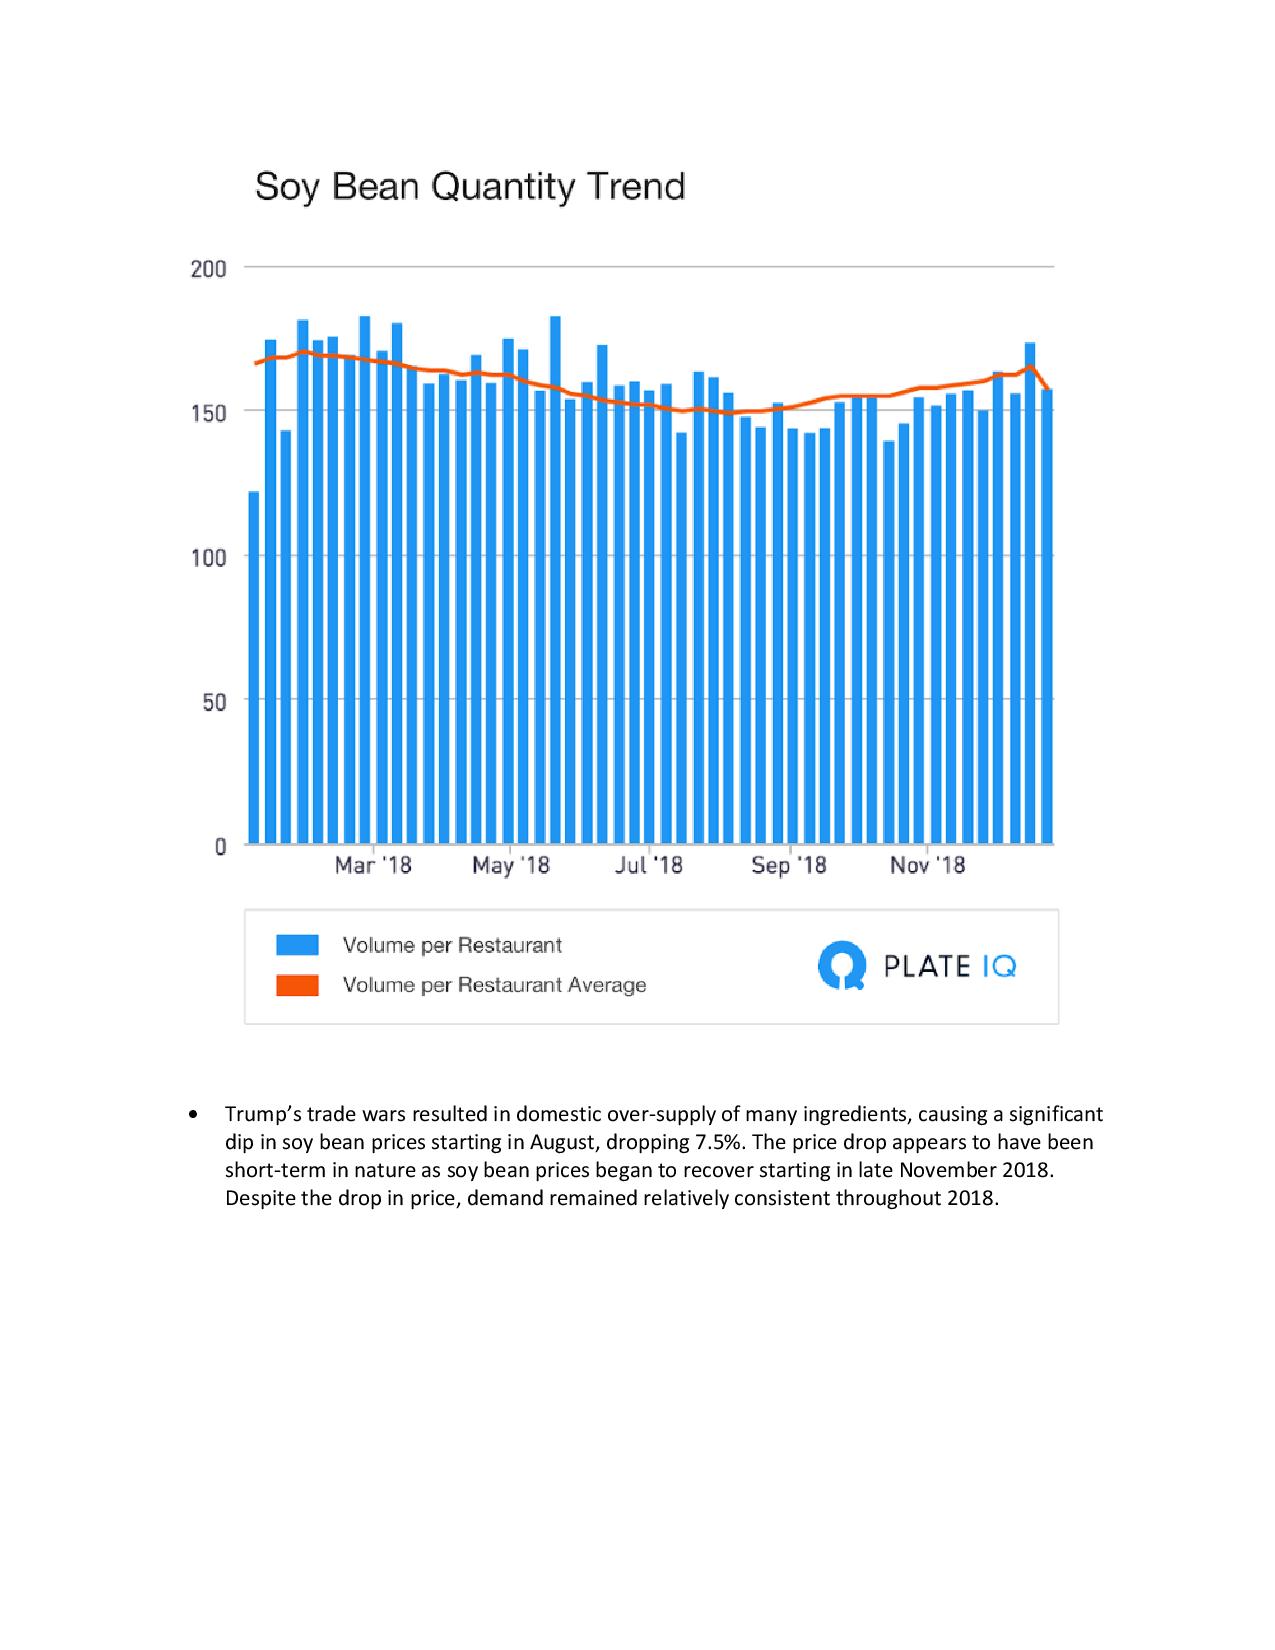
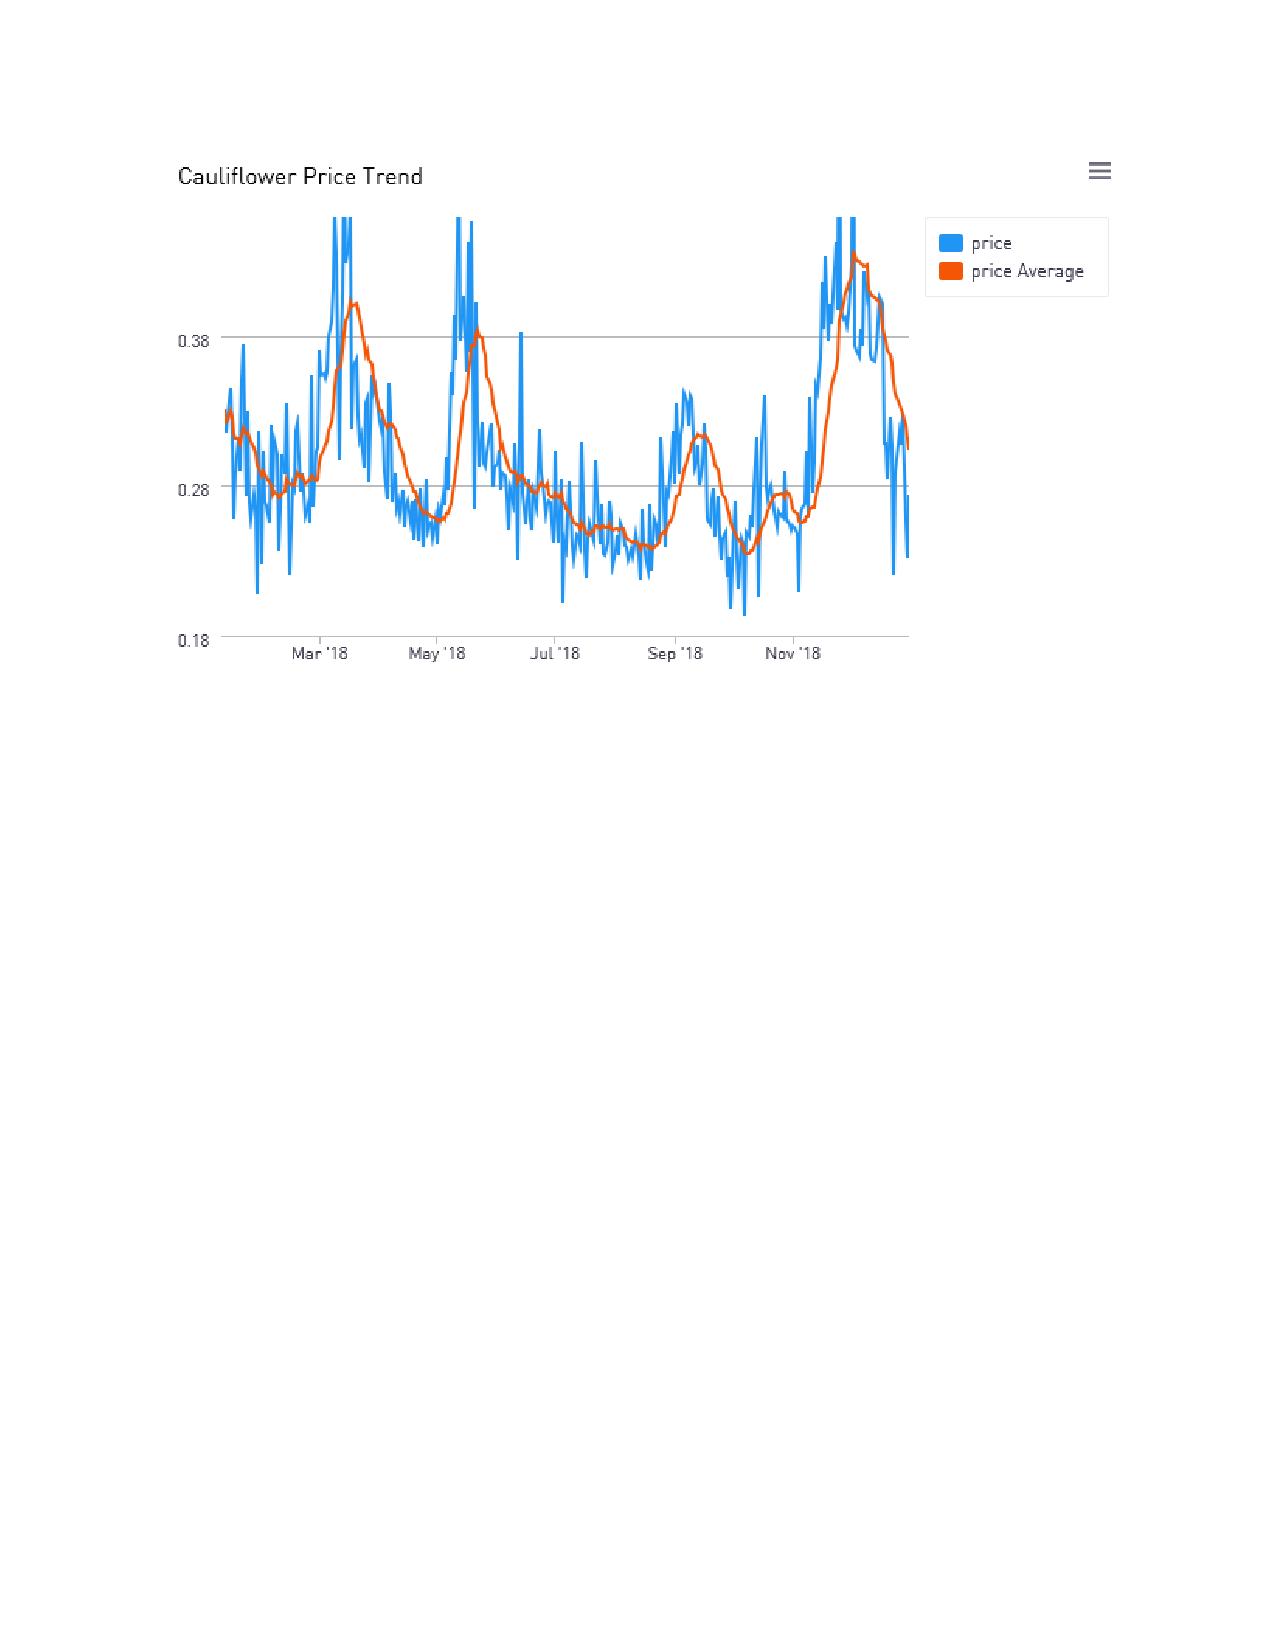
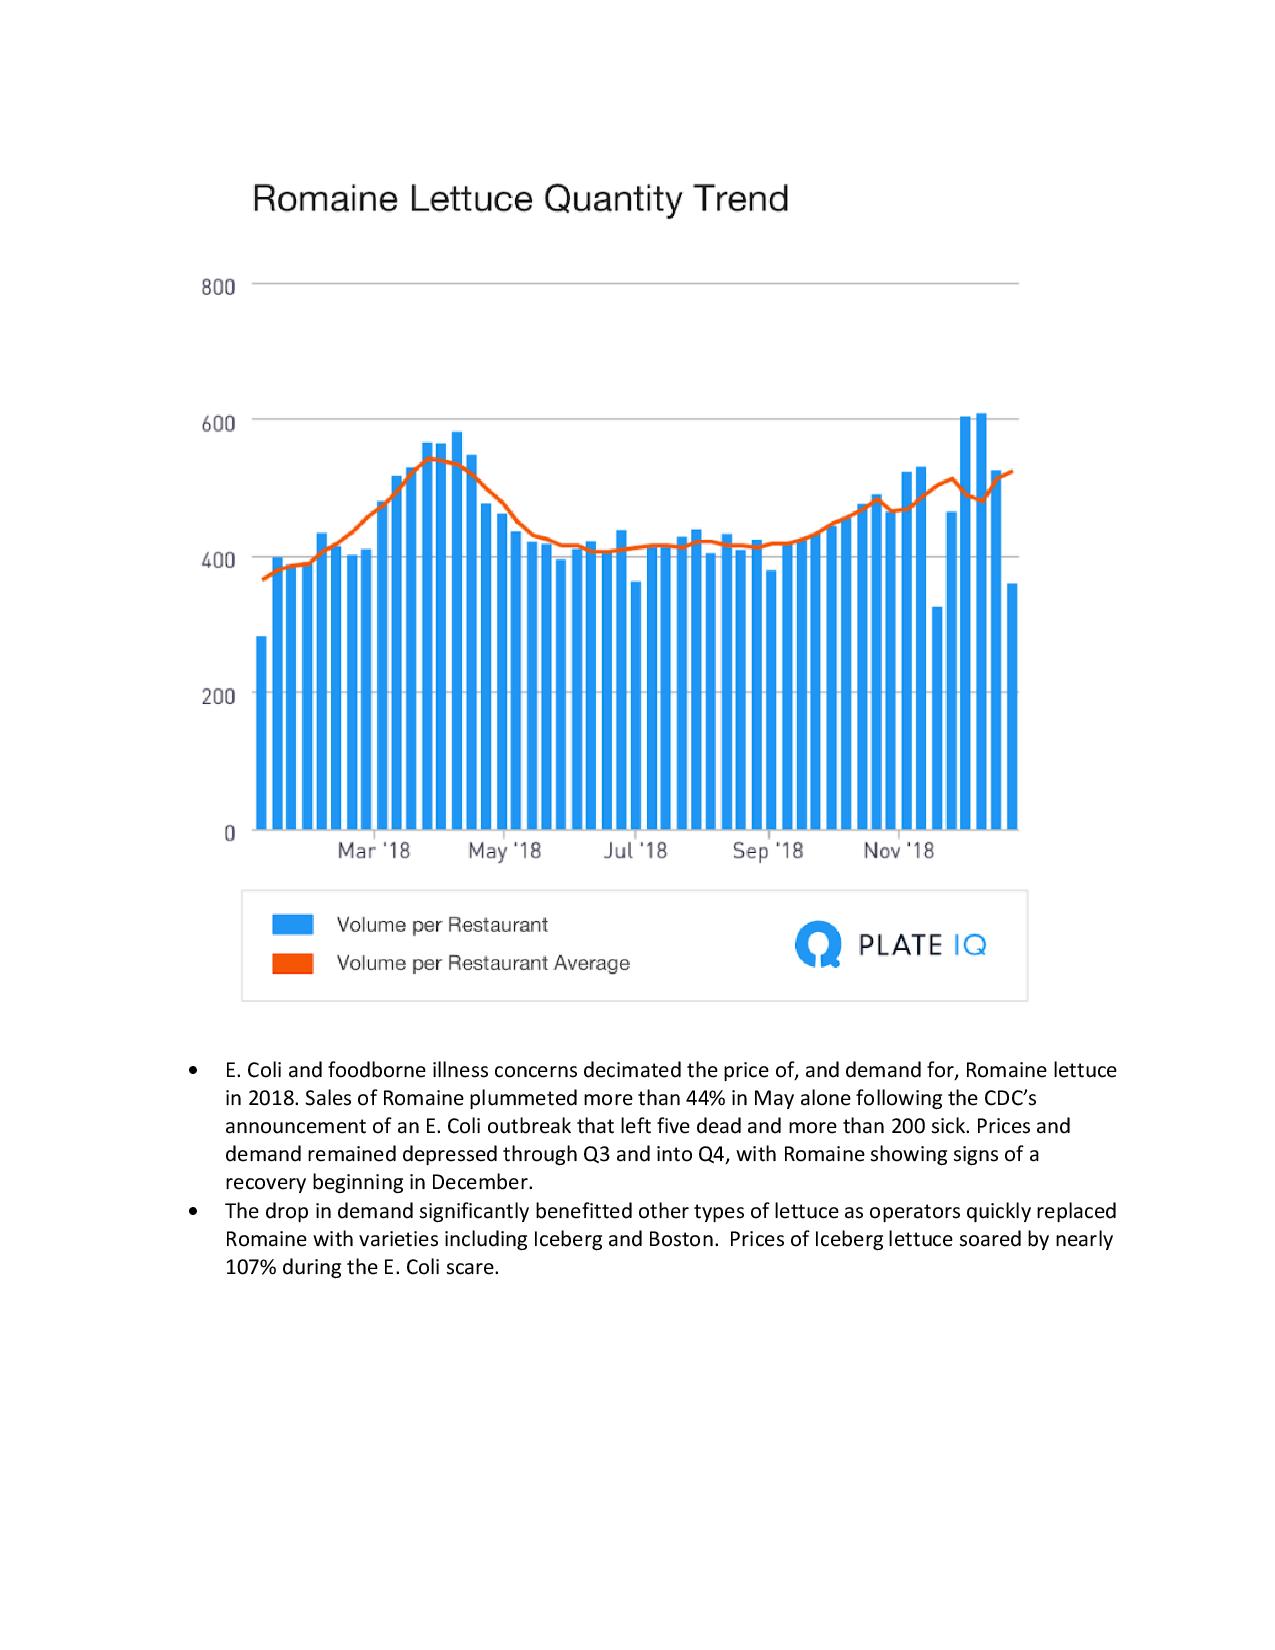
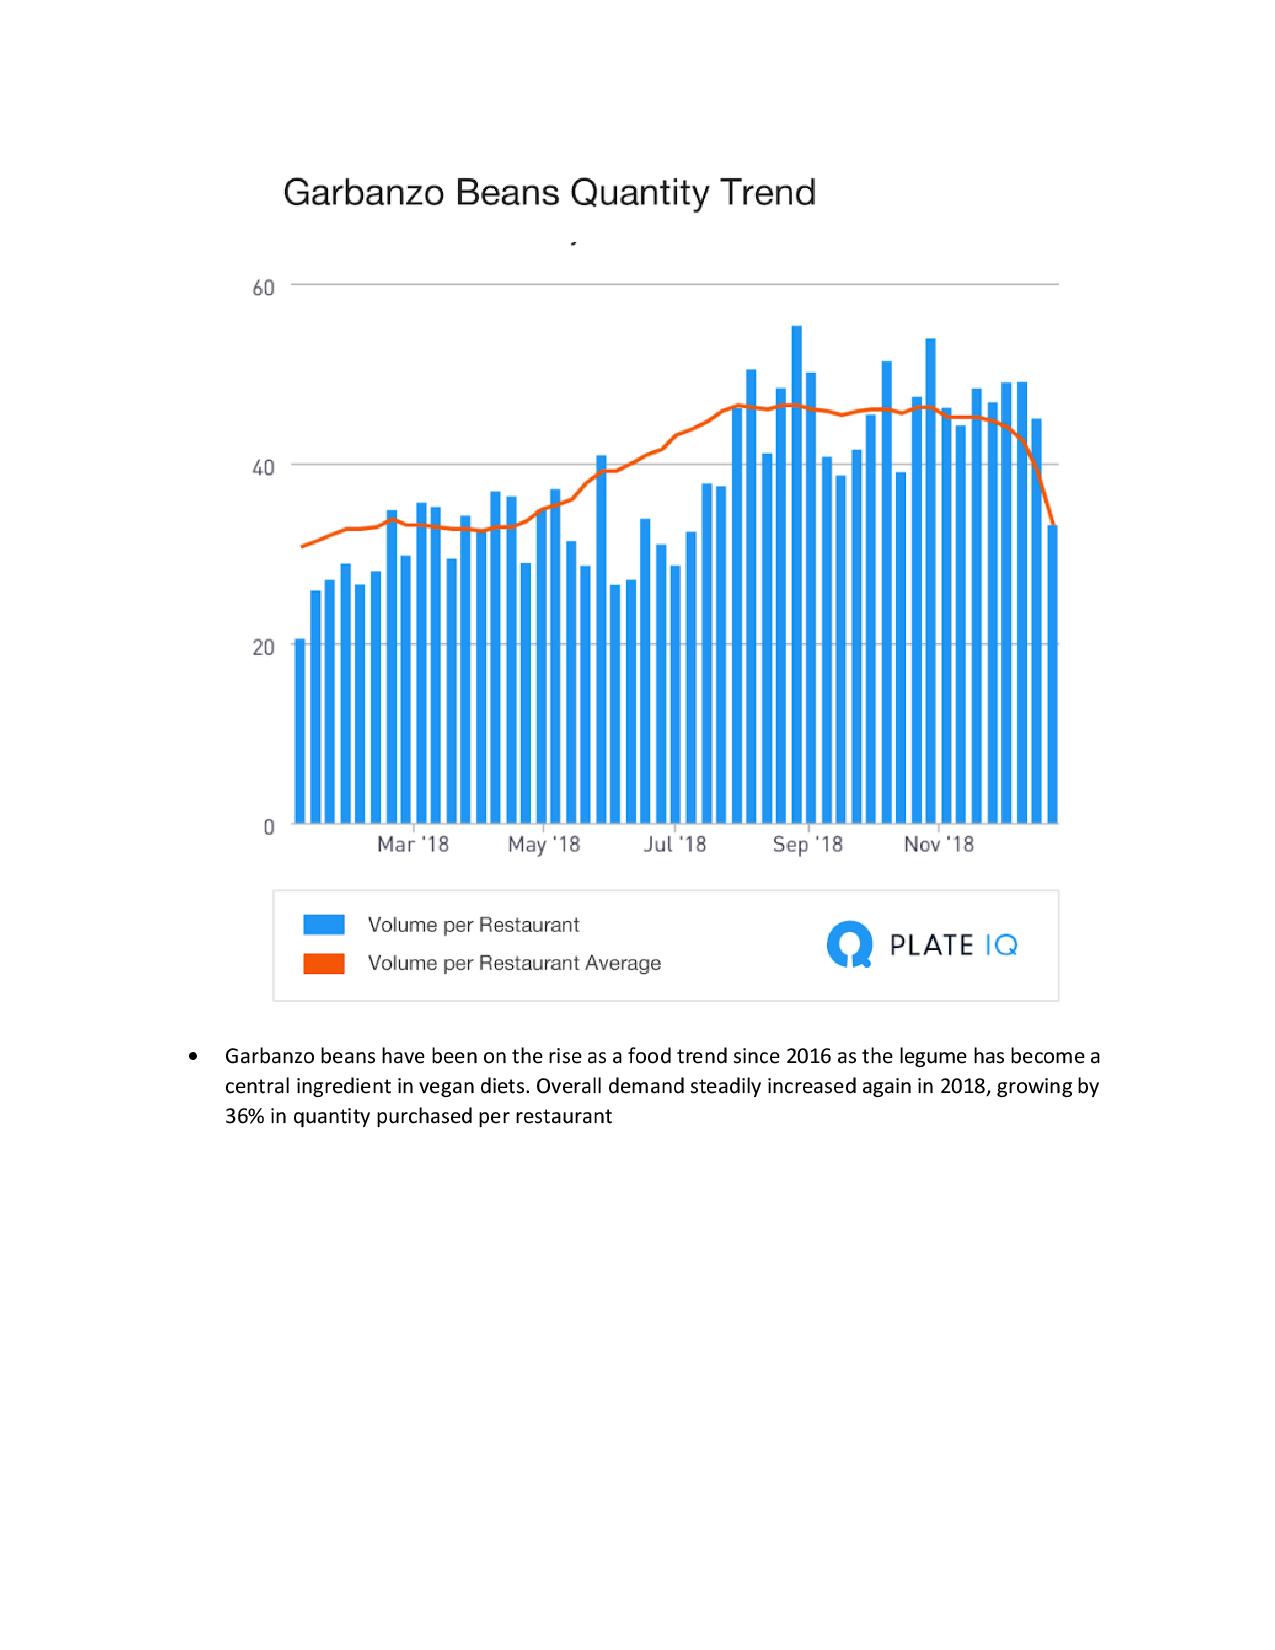
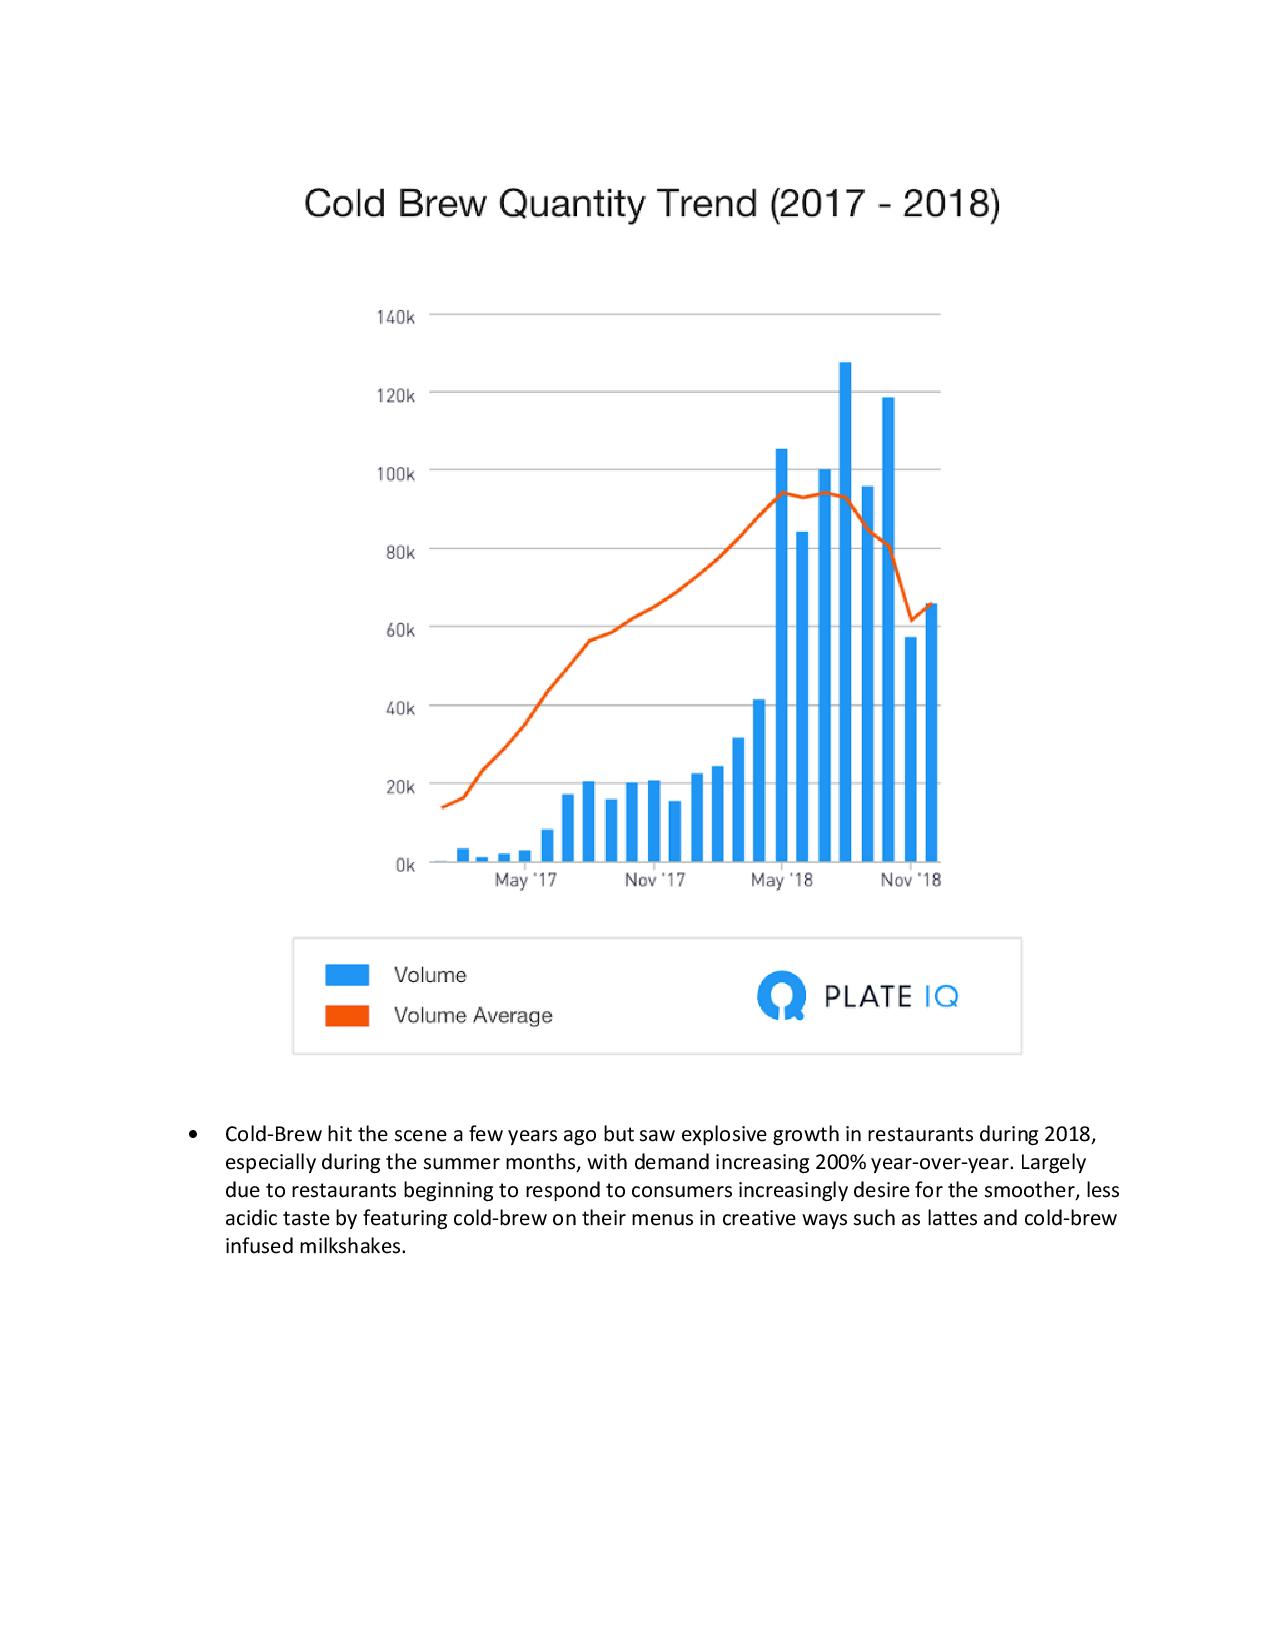
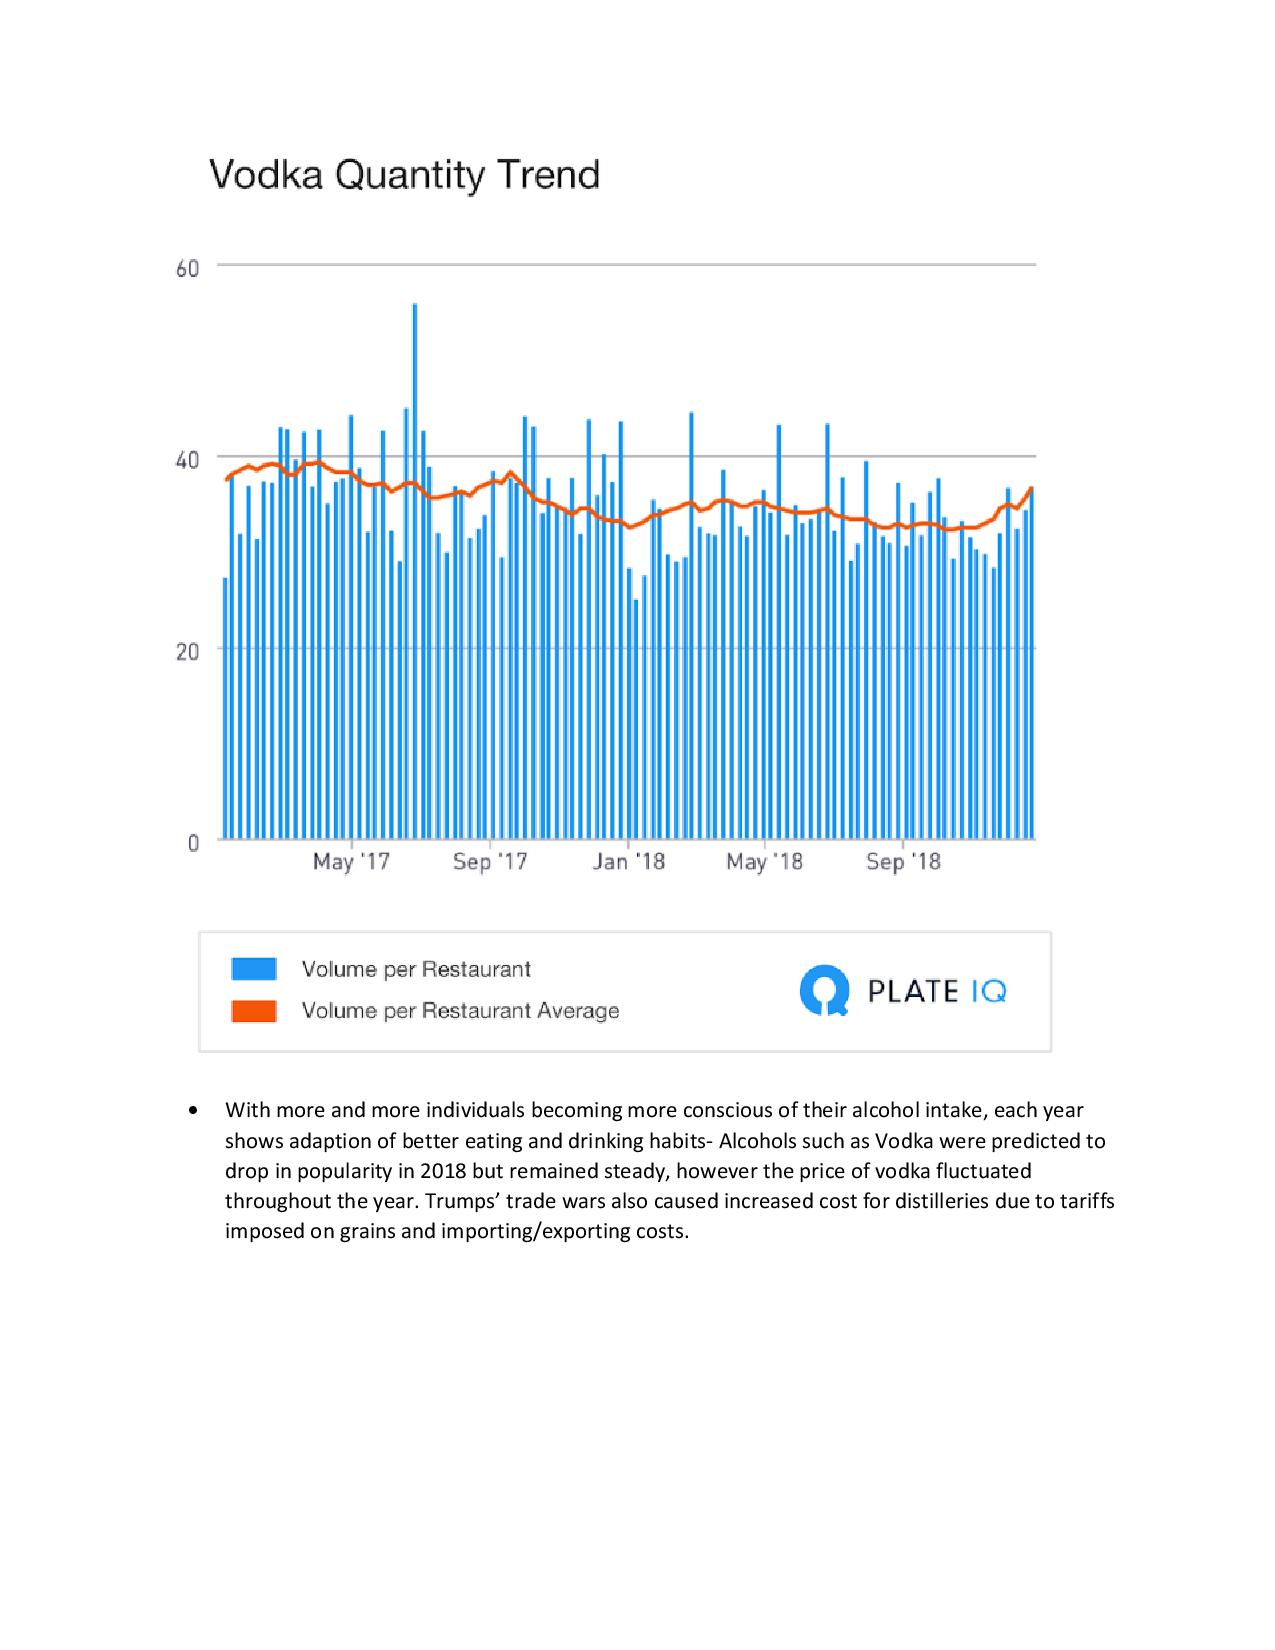
The data is sourced from Plate IQ, a tech/software company that automates invoices at restaurants and hospitality companies including Thomas Keller, Union Square Hospitality Group, NoHo Hospitality and more. Plate IQ examined the prices of the following items: Soy Beans, Cauliflower, Romaine Lettuce, Garbanzo Beans, Cold Brew, Vodka, and Kombucha.



Foodservice Trends for 2019
Mintel announced four trends set to impact the US restaurant industry in 2019. In the year ahead, the foodservice landscape will evolve, driven by increased awareness around social and environmental responsibility and innovation in technology-enabled customer service.
You Are Where You Eat
Where you choose to dine says more about you than just your food preferences; it’s a reflection of who you are. With more restaurants extending their reach beyond the dining table, diners are supporting restaurants with cultures and values that align with their own lifestyles.
Restaurants today are showcasing more of their personalities. American diners are literally wearing their favorite restaurants on their sleeves as operators offer branded merchandise from hoodies to sneakers. Branded collaborations featuring limited-time-only items and contests used to boost brand appeal are programs that establish customer relationships and relevancy and build brand ambassadors.
“In the year ahead, expect restaurants to take customer engagement a step further by creating a sense of community with their patrons. Knowing that diners want to align themselves with brands that fit their lifestyle, restaurants can meet diners halfway by taking a stance on social and political issues and supporting organizations that are important to them. The most successful brands will be those that are personable and form transparent relationships with diners,” said Amanda Topper, Associate Director, Foodservice Research, at Mintel.
Serving the Earth
While consumers are looking for guidance on ways to be more environmentally responsible, at the same time, operators are realizing their impact and the role they can play by stepping up to the plate to be partners and educators in environmental and social responsibilities.
As consumers aim to incorporate more environmentally responsible practices into their lives, they have begun to expect the same from the companies they buy from, including restaurants. From compostable straws to upcycled food scraps, diners depend on restaurants to draw on environmentally friendly business practices. Restaurants have an opportunity to become a guiding force that can enable consumers to feel good about the decisions they make, including where they get their lunch.
“With more restaurants adopting environmentally friendly practices, sustainability will become the new normal, and operators will need to take more innovative steps to stand out. Expect to see restaurants make changes to the way they operate in 2019, including partnerships that put the greater good above competition and circular economies that benefit the environment and the people involved in the food systems,” continued Topper.
Restaurants for Good
Rising labor costs and declining unemployment are creating challenges for restaurant operators to hire and retain top talent. Restaurants are not only focusing their attention on the well-being of their employees to reduce attrition, they are also focusing on their customers by giving back to the communities they serve.
Labor is a top concern, if not a crisis, for the foodservice industry. Technology and robots are playing an increasing role in reducing labor costs, but foodservice will undeniably rely on humans for the foreseeable future. In 2019, restaurants will find even more creative ways to attract and retain top talent, and in turn, build loyalty in their own communities by backing causes that matter most to their customers.
“Employee retention programs and community outreach initiatives will be crucial for brands in 2019. Although mental health care and sexual harassment protections seem like they should already be basic necessities, these issues are ongoing in the restaurant industry. With national awareness mounting for both, expect to see restaurants implement stricter procedures and protocols surrounding these issues in an effort to better protect and support their employees,” added Topper.
Tech in Balance
As technology continues to drive the changing face of foodservice, restaurants must strike the right balance between operational efficiency, a desire for human interaction, and excellent service to all customers.
The invention of the drive-thru window forever changed how customers define convenience. Today, restaurants are continuing to roll out technology innovations to enable time-strapped consumers to have quicker transactions, shorter wait times, and meals delivered straight to their door. Looking ahead, operators must ensure that new innovations benefit not only operational efficiency but first and foremost, customers.
“As restaurant technology continues to become more sophisticated, the way consumers order will dramatically change moving forward. Restaurants will utilize technology to heighten customer experiences and provide value through more personalized service. By implementing technology with tangible benefits for customers, such as greater customization and more intuitive recommendations, operators will be able to drive efficiency and better customer service,” concluded Topper.
NYC Hospitality Alliance Compensation Survey
The labor market, labor costs, and labor laws have been influencing significant changes in full and limited restaurant industry fundamentals, according to a compensation survey by the New York City Hospitality Alliance conducted with 486 city restaurants, which employ nearly 14,000 tipped workers. It found those servers earn a median hourly wage of $25.
Much of the financial and regulatory pressures on restaurants have occurred while Andrew Cuomo has been governor of New York State. The pressures heavily driven by recent labor mandates in New York City include: doubling the tip wage in a mere three years, six consecutive annual minimum wage increases, a $300 increase to the minimum weekly rate for salaried employees, paid sick leave, healthcare, workers’ compensation, taxes, compliance, and other related costs. This also includes the upward pressures these increases place on wages as an expense.
To gain insight into the labor market, between November 28th and December 27th, 2018, the New York City Hospitality Alliance conducted a survey to investigate how restaurants in the city of New York are addressing increasing labor costs.
The operators of 574 establishments responded to the survey, which represents 324 full service restaurants and 250 limited service restaurants.
The survey results presented in this report include powerful insights. 76.50 percent of full service restaurant respondents reduced employee hours, and 36.30 percent eliminated jobs in 2018, in response to mandated wage increases. 75 percent of limited service restaurant respondents report that they will reduce employee hours, and 53.10% will eliminate jobs in 2019 as a result of mandated wage increases that took effect on December 31, 2018.
There’s also a concerning trend found in restaurant employment data. When the tip wage increased 50 percent in 2015, and since doubled, annual employment growth dropped from 6.67 percent to less than 1 percent as of November 2018. The State Department of Labor's data for employment at limited service restaurants show a similar downtrend. Both decreases in growth, the results of this survey, and other industry trends signal that a once growing industry; responsible for hundreds of thousands of jobs, and billions of dollars in economic impact, has become stagnant.
To read the survey, click here.
Sensory Experiences Drive Nine Out of 10 Shoppers Back to Stores
Mood Media launched its new global study, “Elevating the Customer Experience: The Impact of Sensory Marketing,” which reveals consumer attitudes toward the in-store customer experience as well as in-store shopping behaviors. Specifically, the report found that 78 percent of shoppers globally say an enjoyable in-store atmosphere is a key factor in their decision to choose in-store over e-commerce. For the purposes of this report, an enjoyable store atmosphere is seen as the right combination of music, visuals and scent.
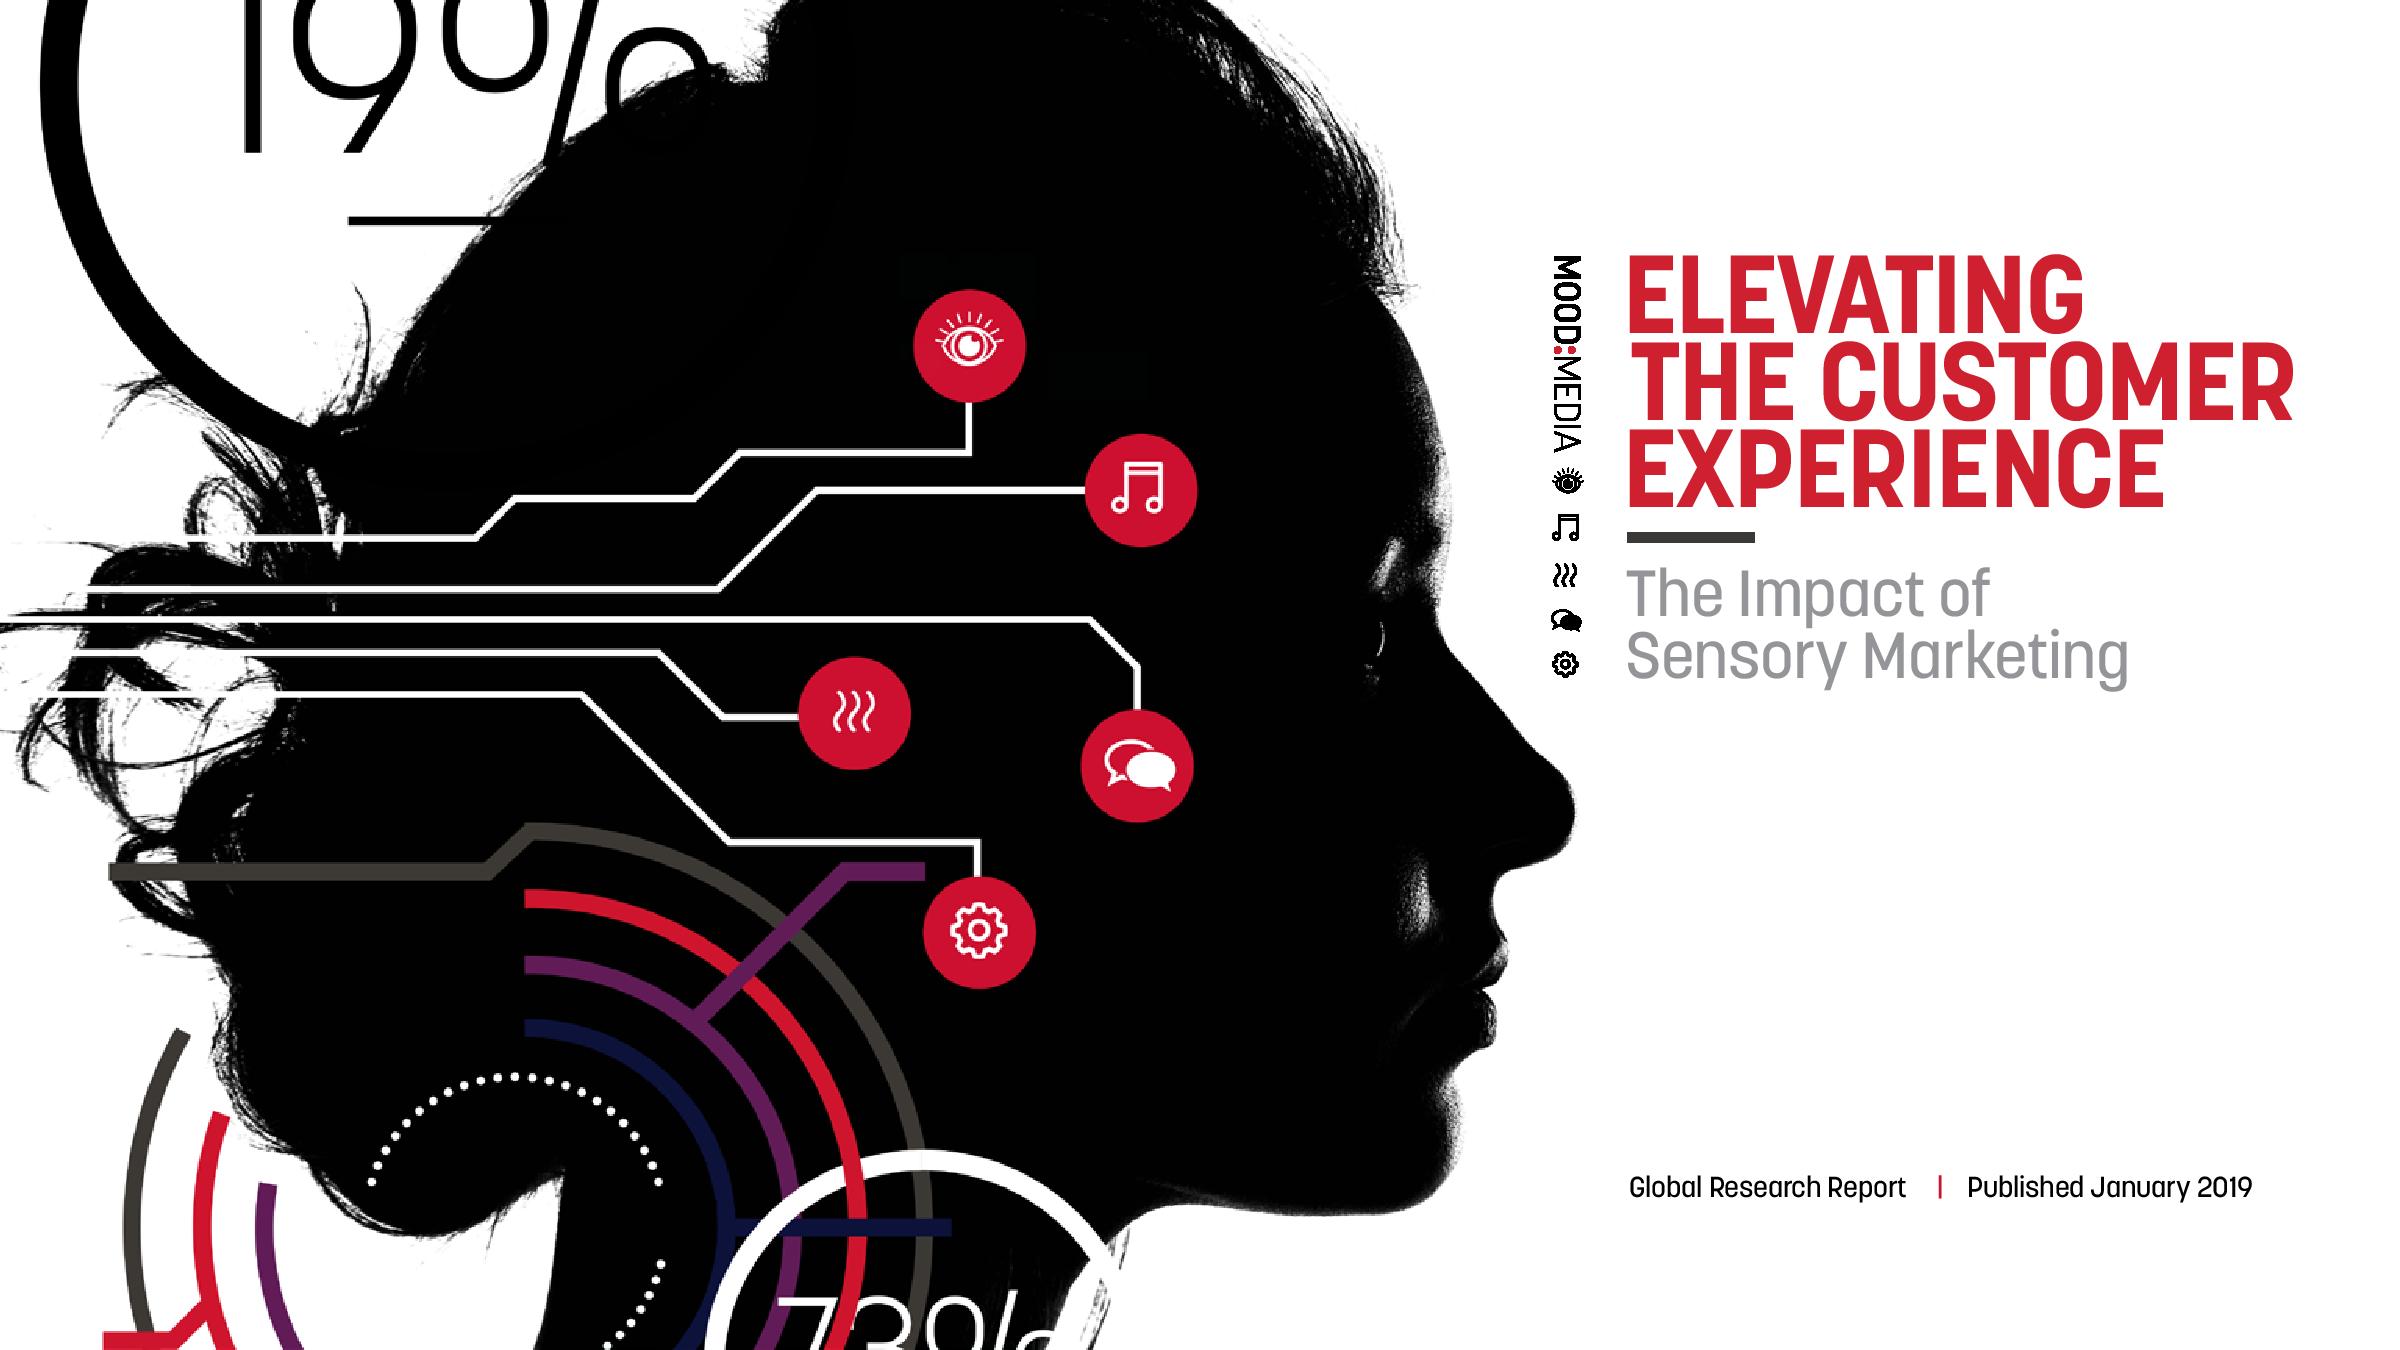
A follow-up to Mood Media’s 2017 State of Brick & Mortar report, the new study was undertaken by Walnut Unlimited, the global market research agency specializing in neuroscience and behavioral psychology and economics, and surveyed more than 10,000 consumers across 10 countries worldwide including Australia, Benelux (Belgium, the Netherlands, and Luxembourg), China, France, Germany, Spain, the United Kingdom and the United States. In addition to examining recent shifts in consumers’ impressions and expectations of in-store retail, the 2019 study explores the impact of a store’s atmosphere – including sensory elements – on the overall shopping experience, as well as what drives certain customer behaviors, such as revisiting a store or making a purchase. The study also explored customer insights across six different sectors: banks, beauty, fashion, grocery, pharmacy and quick service restaurants (QSR).
Some additional highlights of the study’s key global findings include:
Combatting the e-commerce effect: 78 percent of shoppers cite an enjoyable in-store atmosphere plays a key factor in opting to make purchases in-store over online (Spain is most influenced, with 89 percent of shoppers more likely to purchase in-store).
The influence of sound: Music is the number one factor to improve a shopper’s mood in-store, and has an overall positive impact on 85 percent of global shoppers. However, the quality of the music played really matters. More than half (57 percent) of shoppers will disengage if brands make poor music choices.
Encouraging behavior change: Combining music, visual and scent sensorial elements increases consumer dwell time, with 75 percent of consumers citing they’ve stayed longer in a store when such components were in place.
Building customer loyalty: nine out of 10 consumers have decided to return to a store because they enjoyed its music, visuals and scent combination.
Scent psychology: One in two global consumers say that a nicely scented business “lifts my mood.”
The power of visual content: Over half (58 percent) of consumers globally say that engaging video content has a positive impact on their shopping.
The importance of interaction & personalization: The ability to touch, feel and try different products or services is cited as the biggest driver in making consumers more likely to want to buy something while shopping in-store (at 56 percent). More than a third of global consumers (38 percent) say “feeling like the experience is personalized to me” makes them more likely to purchase something, which was the second biggest driving factor ranked.
The report also uncovers differences in the ways shoppers around the world respond to the in-store atmosphere, finding that consumers in China and Spain most positively react to an enjoyable in-store environment. While 90 percent of consumers across the globe are likely to revisit a store if it has an enjoyable atmosphere, those numbers are even higher in China and Spain (93 percent and 95 percent respectively). And while scent was found to have a strong impact on shoppers in all of the countries surveyed (65 percent globally), it was most memorable in Spain, with 85 percent of Spanish shoppers recalling they had noticed a store having a pleasant scent. Shoppers in China and the US had the strongest reactions to in-store music, with 65 percent of people in both countries saying they have recently enjoyed listening to music in-store.
Other select US-specific highlights from Mood’s new study include:
Tactile factors: 43 percent of US consumers said “the ability to touch, feel & try the product” is the thing they like most about shopping in-store, the number one factor cited by global respondents as well.
An enjoyable atmosphere with attention to detail matters: 84 percent of American shoppers say an enjoyable in-store atmosphere (with music, visuals and scent) is a key factor in deciding to make purchases in-store over online (compared to 78 percent of shoppers globally). Geographies coming in even higher include Spain at 89 percent, China at 88 percent and the United Kingdom at 86 percent.
Music impacts dwell times: Nearly half of US respondents (45 percent) have spent longer in a store than they otherwise would have because they’ve “enjoyed the music”, which lines up with the global result of 46 percent.
Visual Inspiration: 43 percent of all US shoppers say they have been influenced by digital screens in-store, in line with global findings. Younger generations of Americans cite an even stronger proclivity toward being inspired by in-store digital screens – 62 percent of 18-24 year olds, and 63 percent of 25-34 year olds.
Personalization drives sales and brand affinity: “Feeling like the experience is personalized to me” when shopping makes 41 percent of US respondents “more likely to want to buy something” and 45 percent feel like they “want to come back”, both slightly higher than the global results.
Social Media behavior: Nearly a third of all US shoppers (31 percent) have shared an in-store experience on social media recently, with 25-34 year-olds coming in at 57 percent, nearly double the overall US social media statistic. The US is second only to China, with Chinese consumers ranking most active in terms of in-store social media use, at 56 percent overall.
“Consistent with our 2017 State of Brick & Mortar study, we found that the physical store remains important to the majority of people around the world, with the experiential element playing a large role in consumers’ decision to choose brick & mortar over e-commerce,” said Scott Moore, global senior vice president of marketing and creative content for Mood Media. “It also further highlights that brick & mortar businesses have to give consumers a reason to get off the sofa and into the store, and part of that reason lies in providing them an elevated sensorial experience. Brands should look to this report to discover how they can create the kinds of store environments that will convert shoppers into buyers and loyal repeat customers.”
Internet Influence on Consumers
U.S. consumers are seeking their echo chambers of health or tribes through blogs and social media, much in the same way they use them for lifestyles and politics, reports The NPD Group. Health professionals, friends, and family were once go-to sources for information on health, but the rising number of bloggers and online communities enable consumers from anywhere on the planet to find like-minded individuals. And just like other echo chambers, oftentimes consumers will follow plans promoted by a blogger or online community as opposed to sound science.
An example of the internet’s influence on health is that nearly 60 percent of consumers who engage in clean eating, research their foods online. More than a quarter of adults rely on social media for information on GMOs and in which food they’re found. Consumers engaged in the lifestyles like paleo, Whole30, and plant-based often find their tribes online, according to NPD’s Eating Patterns in America.
Consumers making their own rules or following an online tribe that shares their beliefs plays out in dieting as well. For those who diet — and fewer U.S. consumers do — the most popular diet is one of their own making. It’s not that consumers create diets that are filled with indulgences; rather, they find lifestyles, or tribes that match their own interests or values.
“Clearly this is a challenging environment for food and beverage marketers who are trying to reach broad audiences,” says David Portalatin, NPD food industry advisor and author of Eating Patterns in America. “The key is to show flexibility and that their solutions can fit into a myriad of tribes, and understand that many Gen Zs and Millennials started with these tribes at a young age and will likely continue to follow their tribes as they age.”
One-Third of Successful Small Businesses Started with Less Than $5,000
New data released by Kabbage, Inc., shows that the majority of successful entrepreneurs began their businesses with little cash flow and short run rates. Polling 600 thriving U.S. small business owners, the Kabbage survey found 58 percent of small businesses started with less than $25,000 and one-third started with less than $5,000.
Of the respondents surveyed, 65 percent of entrepreneurs admit they were not fully confident they had enough money to start their business. In fact, the overwhelming majority of entrepreneurs (93 percent) calculated a run rate of shorter than 18 months, of which 25 percent calculated a run rate of less than six months, and 36 percent didn’t calculate this at all. Yet, 82 percent did not doubt they had the right qualifications and proper experience to run a company and all are successfully in operation today.
Start-Up Money Varies by Industry
According to the survey, the most expensive types of small businesses to launch are restaurants, medical offices, and manufacturing companies, with 38 percent, 23 percent and 19 percent, respectively, claiming it cost more than $100,000 to begin. Alternatively, the three small businesses that required the least amount of startup capital—$5,000 or less during the first six months—are accounting (45 percent), online retail (44 percent) and construction and landscaping (39 percent).
“We sought to understand the cash flow concerns successful business owners faced when starting their company,” said Kabbage Head of Lending, Rob Rosenblatt. “The data shows cash flow and run rate uncertainties are all too common among small business owners. While it may seem daunting, it’s their tenacity and self-confidence to succeed that champions their doubts and compels them to start the amazing journey of entrepreneurship.”
Mobile Based Training is Beneficial
Inkling Systems, Inc. announced the results of a survey that highlights the importance of providing digital learning tools for the modern workforce to improve on-the-job performance and stave off turnover in today’s ultra-competitive labor market. While the majority of those surveyed said that mobile devices, mobile apps and software are vital for training their employees, nearly half are still using paper-based training materials, even though they believe these tools are ineffective. Mobile resources provide today’s digitally savvy workforce with easy access to training and reference materials that enable them to learn at their own pace and stay up-to-date on continually changing company offerings.
“Today's workforce expects immediate access to information that is personalized for their needs and available with the same engaging visual experiences they’ve become accustomed to through the use of smartphones and tablets,” said Jeff Carr, CEO of Inkling. “Increasingly, employers are recognizing the need to invest in digital tools and mobile devices that enable employees to search for information at any time, and both learn and collaborate in the flow of their daily work. They know this is essential to set their workers up for success and ultimately increase retention.”
The survey – “Why Mobile is the Right Tool to Optimize Learner and Customer Experiences: A U.S. Study on How Organizations Benefit by Enabling their Customer-facing Employees with Mobile” – was conducted for Inkling in mid-2018 by Vanson Bourne to evaluate how U.S. retail and restaurant organizations are using mobile today, what challenges they face, which benefits they are experiencing or anticipating, and what they hope to accomplish in the next 12 to 18 months.
Key findings in the report include:
- Mobile-enabled employees improve customer experiences and impressions – Ninety percent of survey respondents said that their customer-facing staff are their best organizational asset for shaping the customer experience, but 69 percent admit their frontline employees currently find it difficult to meet customer expectations. Fortunately, nearly all of those surveyed have already implemented, or are beginning to introduce, mobile devices (99 percent) and mobile apps/software (97 percent) for training; 86 percent reported that their frontline staff is better able to meet customer expectations since they have become mobile-enabled.
- Customer-facing employees do not receive enough ongoing training and lack direct access to reference materials – On average, restaurants update their menus every seven weeks and launch promotions every five weeks, while retail organizations do floor resets every six weeks. Given the frequency of change in the workplace, it may be surprising to learn that frontline employees receive six hours of onboarding when they join an organization but only three hours per quarter of ongoing training.
- Communication with frontline staff is a challenge because they don’t sit in front of a computer all day – Both executives and workers agree that communication needs to improve in both directions. However, 86 percent of executives say headquarters could do a better job keeping customer-facing staff informed, and 61 percent of workers find it difficult to share information with management. In addition, workers say tools for communicating with their peers is the capability they would most like organizations to provide.
- Outdated training processes and tools must be replaced – Only 19 percent of respondents think paper-based training is extremely effective for the modern workforce, yet 44 percent of materials are still paper-based. Ninety percent said it would be beneficial to switch from paper-based training to online/mobile-based training, with almost all (99 percent) indicating that they believe mobile software training is effective. In the survey, 48 percent said that more mobile devices for customer-facing staff would be better, and 41 percent want more mobile apps and software.
To learn more about the impact of mobile training on the modern workforce; click here.

