
MRM Research Roundup: Mid-August 2019 Edition
15 Min Read By MRM Staff
This edition of Modern Restaurant Management (MRM) magazine's Research Roundup features memorable mascots, the impact of online reviews, the Retail Renaissance, and what menu choices might drive consumers to try a restaurant.
Restaurant Sales and Traffic Hit the Wall
Restaurant sales and traffic plummeted during July, posting the worst year-over-year results in almost two years. Same-store sales growth was -1.0 percent during the month, a drop of one percentage point from June’s results. It is the first time since September 2017 that the industry has seen sales growth numbers this low.
Same-store traffic growth was -4.0 percent during July. This represented a 0.8 percent decline from June’s year-over-year growth and the weakest traffic growth for the industry since August of 2017. This update comes from Black Box Intelligence™ data from TDn2K™, based on weekly sales from over 31,000 locations representing 170+ brands and nearly $72 billion in annual sales.
July has been consistently soft over the last few years for chain restaurant sales. July tends to have the poorest same-store sales growth results each year going back to 2017 after excluding winter months affected by bad weather. It’s easy to illustrate how bad July sales have been lately by taking a longer-term view. Chain restaurants lost 3.3 percent of their sales in July 2019 compared to their 2016 results. By comparison, since August of 2018, all other months have, on average, showing only a 1.1 percent loss in restaurant sales when compared with the same month three years ago.
“Without a doubt, we are experiencing a year-over-year slowdown in restaurant same-store sales coming, in part, from lapping over tougher sales comparisons dating back to Q2 2018,” said Victor Fernandez, vice president of insights and knowledge for TDn2K.
“But July’s unique challenges for chain restaurants likely play a significant part in the downfall we saw in the results. Once a significant portion of restaurant guests are taken off their usual routines, they tend to shift some of their spending toward other food-at-home or food-away-from-home options,” advised Fernandez.
To-Go Sales Stumbled in July
July’s to-go sales growth was not large enough to push the industry’s overall sales to positive growth territory; as it has in recent months. On one hand, year-over-year dine-in sales growth fell by 0.7 percentage points in July compared to June. Perhaps more telling about July’s consumer behavior dynamics, on the other hand, to-go year-over-year sales growth fell by 2.0 percentage points compared to June’s growth rate.
Although dine-in sales growth has been worse for the industry as recently as April and February, to-go same-store sales growth had not been this weak since July 2018. According to Fernandez, “some of those to-go meals driven by convenience as part of our busy lifestyles may be what is being erased by the slower pace of July.”
International Conflict Threatens Recession
The economy has kept growing despite the pressures created by the trade war with China. But the recent ratcheting up of tensions has raised the possibility of a recession significantly.
“With the U.S. threatening China with tariffs on just about all its exports to the U.S. and China retaliating by devaluing its currency and stopping agricultural purchases, the longest-running expansion in American history is at risk,” said Joel Naroff, president of Naroff Economic Advisors and TDn2K economist. That is true despite decent income and job gains that powered robust consumer spending in the spring. It also indicates that if both parties back down, the fundamentals are solid enough to keep the economy from faltering.
With political rather than economic factors driving the outlook, it is difficult to do more than speculate on how strong growth will be going forward. A continued full-on trade war, which we are nearing, would likely cause a recession to start within the next year. A stand-down would allow growth to continue but at a sluggish pace.
Restaurants Grow Staff Amid Tight Labor Market
The slowdown in sales growth may be a newer headache for restaurant operators but staffing challenges have been distressing them for years. Finding enough qualified employees and keeping them employed are frequently cited as the biggest obstacles they are facing today. The tightest labor market in the last 50 years certainly is a complicating factor. There is fierce competition for employees and pressures on wages have been increasing as companies try to attract talent. Expect for labor costs, particularly those related to hourly employees, to continue accelerating.
The origin for the incessant need to recruit new employees comes from both new jobs being created by restaurants and turnover remaining at historically high levels. According to TDn2K’s People Report™, restaurant operators continue to anticipate adding staff in the months ahead. Overall, 44 percent of companies reported they expect to increase their number of restaurant managers during the third quarter, with just four percent expecting a reduction in their management staff. For hourly employees, the percentage expecting a rise in their staffing numbers is 52 percent, with only 5 percent expecting a reduction.
Job growth has been particularly strong in the quick-service segment, with 70 percent of companies reporting an increase in their hourly employee headcount during the second quarter. This is the highest level of reporting in the last three years.
Looking Ahead
The expectations for the rest of 2019 are for a continued slowdown in same-store sales growth, with some weak months ahead as the industry laps over some stronger results in the second half of 2018. Declining guest counts in comparable stores remain the norm. A rebound in to-go sales from the July dip is expected, which should help improve overall sales growth.
Staffing difficulties will persist as companies continue increasing their headcounts and dealing with the rising turnover trend. The workforce challenges are not expected to ease unless there is a major slowdown in the economy that raises unemployment considerably.
In the midst of all these obstacles, TDn2K analysis continues to show that it is those restaurant brands winning the market share battle are those that have succeeded in offering a compelling employment value proposition and deliver on best people practices, growing their guest counts and getting the most positive sentiment from their guests. Look for successful brands to continue investing in their people as the ultimate differentiator in the marketplace.
Impact of Online Reviews
A new study from Womply explored the impact of online reviews on revenue at local restaurants. Womply’s data science team conducted an in-depth analysis of transaction data and online review data (from Yelp, Google Reviews, TripAdvisor, and more) for more than 43,000 local restaurants in every state to discover the impact online reviews have on the bottom line. Among the key findings:
- More reviews = more money
Restaurants with more than the average number of reviews (234) bring in 82 percent more in annual revenue than the average restaurant. Restaurants with 1,000+ reviews have annual revenues 100 percent+ higher than the average restaurant.
- Fresh reviews matter
Restaurants with more than 23 “fresh” reviews (posted in the past 90 days) earn 52 percent more revenue than the average restaurant. Restaurants with 50 or more fresh reviews earn 81 percent more in annual revenue than the average restaurant.
Restaurants who follow the simple practice of claiming their listing on Google, Yelp, Facebook, and TripAdvisor average a substantial $186,100 (or 48 percent) more each year than our baseline average. Restaurants that claim their:
- Yelp listing average 27.1 percent more yearly revenue than restaurants that leave them unclaimed.
- Google listing average 27.4 percent more yearly revenue than restaurants that leave them unclaimed.
- Facebook listing average 18.7 percent more yearly revenue than restaurants that leave them unclaimed.
- TripAdvisor listing average 16 percent more yearly revenue than restaurants that leave them unclaimed.
More than any other business category, it’s important for restaurants to claim at least one of their online listings: Restaurants who don’t claim at least one of their online review listings earn $60,000 less per year than restaurants who have claimed just one listing, a 15 percent swing in yearly revenue.
Why Diners Try Restaurants
In an effort to tap into what makes diners try new establishments, Vitamix recently conducted independent research (among a sample of 1,004 adults comprised of 502 men and 502 women) to find out what menu choices might drive consumers to try a restaurant or eatery for the first time. Here are some top findings:
- Overall, 60 percent of the total respondents said that a large, diverse food menu would be the top driver for trying a restaurant.
- Millennials and Gen X-ers stated they are motivated by an appealing dessert menu, unique alcoholic drinks and unique non-alcoholic drinks significantly more than Baby Boomers.
- 42 percent of Millennials, 37 percent of Gen X-ers, and 29 percent of Baby Boomers would try a new restaurant based on an appealing dessert menu.
- Millennials stated they would be motivated by creative non-alcoholic drinks more than both Gen X and Baby Boomers.
- 21 percent of respondents would be incentivized by unique alcoholic beverages, while 15 percent would try a restaurant for creative non-alcoholic drinks, like mocktails.
Retail Renaissance
More than five retail chains are opening stores for every retailer that is closing stores in 2019, according to new research from IHL Group. This is up from 3.7 in 2018. The company also reports that the number of chains adding stores in 2019 has increased 56 percent, while the number of closing stores has decreased by 66 percent in the last year.
Retail Renaissance – True Story of Store Openings/Closings reviewed 1,660 retail chains with 50 or more locations in the United States across nine industry segments. For each retailer, the company measured the total store counts at the end of 2016, 2017, 2018, and plans for 2019 year-end based on company filings and statements. The net total increase or decrease in their store count was noted and that data was tallied across companies.
IHL reports that fewer retailers make up the bulk of closures in 2019. In 2018, 20 chains represented 52 percent of all stores closed. In 2019, the 20 announcing the most closures represent 75 percent of all closures.
“U.S. retail has increased $565 billion in sales since January of 2017, fed not just by online sales growth but net store sales growth,” said Lee Holman, VP of Research for IHL Group. “Clearly there is significant pressure in apparel and department stores, however, in every single retail segment there are more chains that are expanding their number of stores than closing stores.”
Since 2017, apparel and department store chains have seen the net closure of 9,651 stores. During this same period, all other segments represented 18,226 net new openings.
Additional findings include the following:
- 64 percent of retailers are increasing the number of stores in 2019, 12 percent are decreasing and 24 percent report no change in store counts. This compares to 2018 with 41 percent increasing store counts, 37 percent decreasing and 22 percent with no change.
- For every chain closing stores, +5.2 chains are opening stores. Specifically, these ratios by segments include the following
- Food/Drug/Convenience/Mass Merchants: +9.
- Apparel, Hard Goods, Department Stores: +3.7
- Restaurants, Fast Food, Table Service: +6.3 chains opening vs closing stores
- 2018 was a peak year in the number of chains closing stores with 37 percent reducing their store counts. This number has dropped to 12 percent of total retailers in 2019.
According to the research, the two primary characteristics of chains closing the most stores has been too much debt and rapid over expansion driven by historically low interest rates for the last 10 years. Lack of innovation and short-sighted private equity has also played a significant role in many of the chains. Retailers without these characteristics have continued to thrive in this market, noting that when a retailer closes a lot of stores, it is more of an indictment on the individual retailer rather than an overall retail industry problem as has often been reported.
IHL notes in Retail Renaissance – True Store of Store Openings/Closings that it is normal and healthy for chains to be both opening new stores and closing non-performing stores. It is the net change overall (along with other measures) that reveals the health of the company and the industry. Seven of the nine segments have a net increase in stores for 2019. Only two industries, apparel and department stores, show a net decline in stores among all the retailers in the segment.
America’s Most Memorable Mascots
There’s something curiously nostalgic, reassuring, and even heartwarming about brand mascots. Some of the most successful characters in American marketing have smiled at us from product labels for more than a century — like Mr. Peanut, who was introduced in 1916, the Sun-Maid girl in 1915, or the Quaker Oats man in 1877. Others are newer creations, like the Travelocity “Roaming Gnome” who debuted in 2004 and quickly became a social media star.
There’s a reason for product mascots’ staying power: They work.
Mascots give brands warmth and personality. They become touchstones that we recognize, like, and trust. We may associate them with fond childhood memories, like Tony the Tiger saying “They’re gr-rr-reat!” during Saturday morning cartoons. Or they may cheerlead us through tiresome tasks; mopping and scrubbing seem less tedious with Mr. Clean by your side. Switching insurance companies isn’t nearly as daunting when a cute lizard with a British accent assures you it will only take 15 minutes.
Of course, not all mascots stand the test of time. Some evolve and endure, while others either never connect with the public at all or quickly fade into obscurity. To find out which mascots are most memorable (and why), Crestline Promotional Products commissioned a survey of 1,630 U.S. residents. The results yielded fascinating insights into marketing successes and failures, the characters that matter most to different generations, and mascots that are most often mistakenly linked with rival brands.
Mascots that hit the mark
To learn which mascots are most memorable, researchers showed people images of characters (stripped of any text) and asked them to identify the brand. There were no hints or multiple-choice options — just a blank line. With 82 mascots and 1,630 participants, it took a while to sift through all those answers, but here is what they discovered.
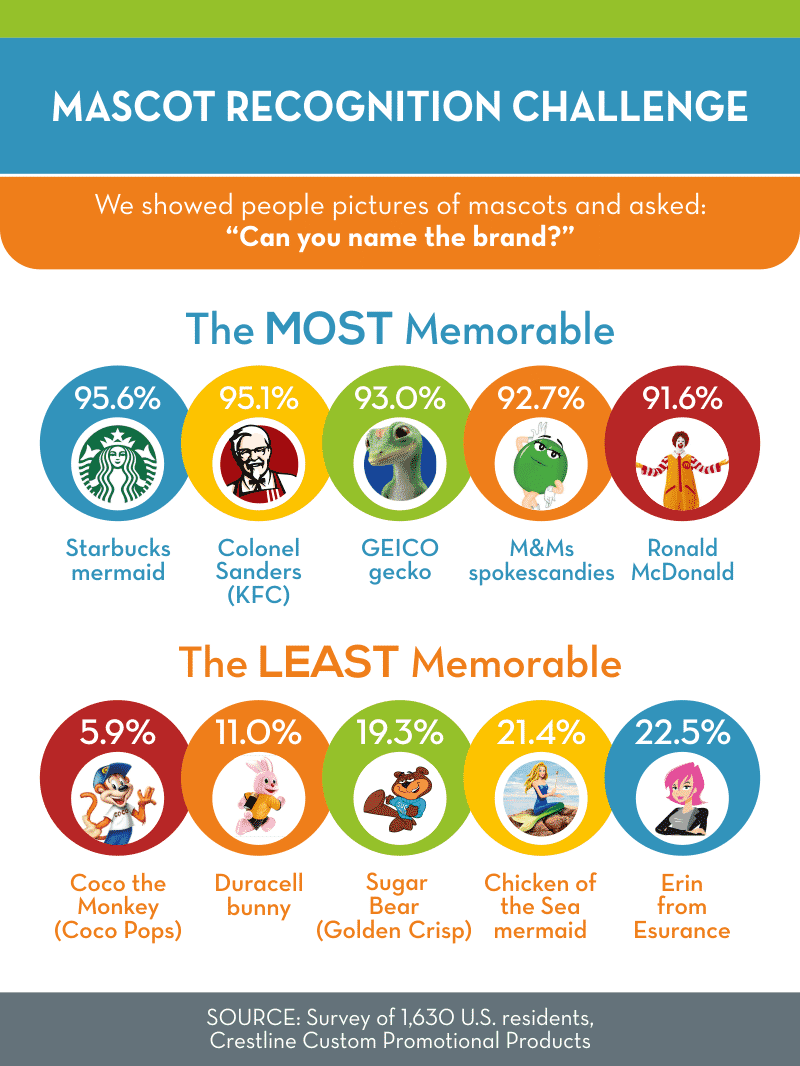
For coffee drinkers jonesing for a cup o’ joe, few sights are more welcome than the ubiquitous Starbucks siren with her flowing hair and twin tails. Of all the mascots we tested, she came out on top; 95.6 percent of the study participants were able to correctly identify the green mermaid with Starbucks.
In second place, Colonel Sanders was identified by 95.1 percent of respondents as the mascot for KFC. The logo, introduced in 1952, was based on the real-life founder of Kentucky Fried Chicken. It has gone through a few changes over the years. The colonel’s serious expression has become more jovial and his white linen suit jacket has been covered by a red cook’s apron. But the white hair, goatee, glasses, and Southern-style string bow tie have remained.
At the other end of the scale, only 5.9 percent of participants recognized Coco the Monkey from Coco Pops. And although the Duracell bunny first appeared in 1973 — 15 years before Energizer introduced its own nonstop rabbit as a parody — only 11 percent recognized the Duracell bunny compared with 83.6 percent recognition for Energizer’s rival version.
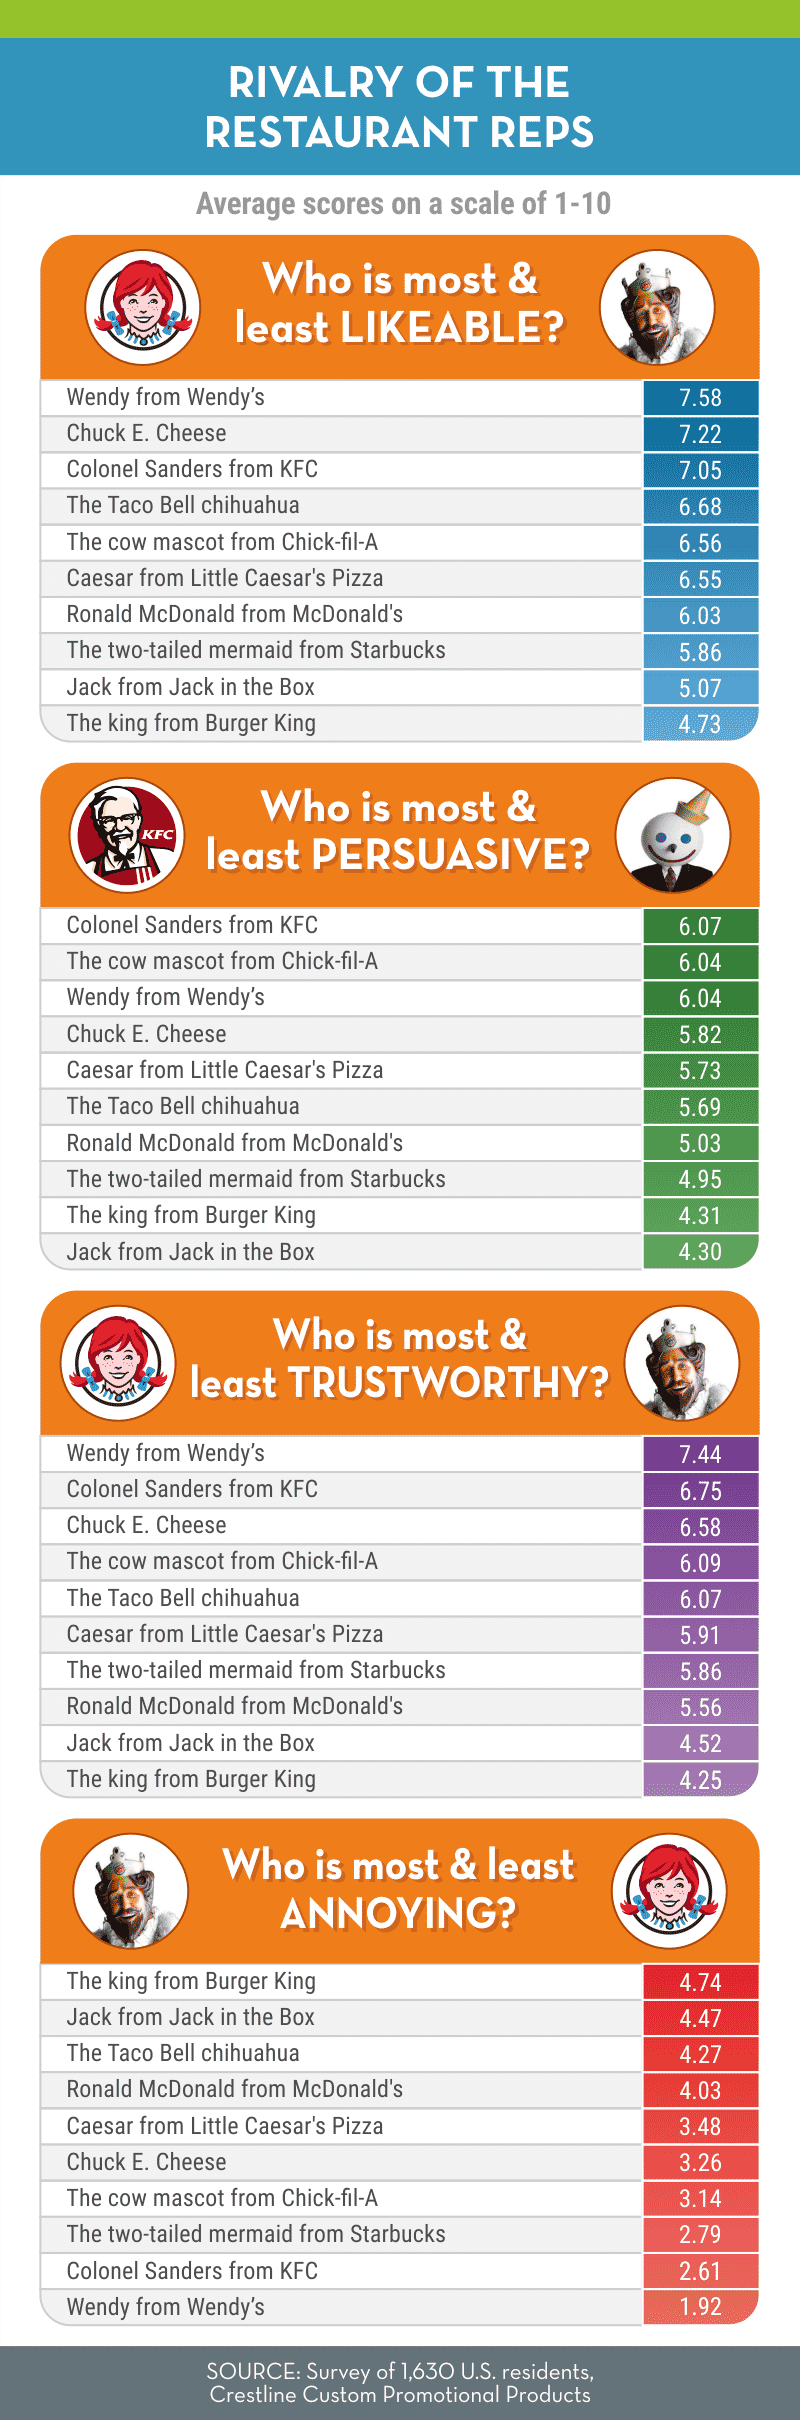
Restaurant Mascots
America’s restaurant and fast-food mascots are an unlikely — and even baffling — group. According to one study, 42 percent of Americans are afraid of clowns. Harboring heebie-jeebies for characters in greasepaint is so common there’s even a clinical term for it: coulrophobia. Yet McDonald’s and Jack in the Box remain loyal to their respective clown brand mascots that were introduced in the 1950s. In the early 2000s, Burger King resurrected a plastic-faced king character that is similarly disconcerting and was rated most annoying by study participants.
Among animal mascots, it’s probably best not to think too hard about why a rodent is the ambassador for kids’ pizza chain Chuck E. Cheese. The character started as a rat in 1977 and was redesigned as a mouse in 1995. The rat costume worn by real-life mascots at the restaurants used to have a tail, but it was phased out due to kids constantly yanking and pulling it. Chuck E. Cheese has gotten younger and hipper over the years, and he was rated the second-most likeable character by study participants. But the fact remains: He’s still a rodent.
Local health departments also might take issue with a small dog running around a taco restaurant, but that didn’t stop the Taco Bell chihuahua from nabbing 4th place for likeability and 5th for trustworthiness.
For likeability, persuasiveness, and trustworthiness, Americans lean toward the human-inspired characters of Wendy and Colonel Sanders. The counterintuitive cow mascot from chicken chain Chick-fil-A also performed well in the study. The diminutive toga-wearing mascot for Little Caesar’s Pizza fell in the middle of all of the rankings.
Women and Elders are Drinking More Frequently
Women and elders—according to TrendSource’s recently-released 2019 Alcohol Industry Report—are among the most frequent drinkers in the country, with women outpacing men in nearly every drinking category and the silent generation lapping younger cohorts in terms of drinking frequency.
The study, which examines consumers’ brand preferences, drinking patterns, and priorities, contains several surprises, most notably related to gender and generation. First, women, according to the data, are out-drinking men. Across the board, in fact, women outpaced men in terms of drinking frequency and volume: they drink more often than men, and when they do, they drink more.
Obviously these findings contradict many of our cultural notions of gender and drinking, and, while it may be tempting to ascribe these numbers to things like wine night and book club, the data further indicates women are likelier to drink in nearly every imaginable social situation.
Like women, the silent generation’s drinking habits are a bit surprising. They are, by roughly a 17 percent gap, the likeliest age demographic to drink every day. It seems cocktail hour is alive and well among our oldest respondents, but the vast majority of them only drink 1-2 drinks per sitting. This means that, while members of the silent generation are likelier to drink more often, when they do drink they drink relatively less than every other generation.
Income also bears on drinking frequency and quantity, with wealthier respondents proving likelier to drink in nearly every social situation and to consume more in each. Whether this has to do with affordability, cultural norms, or access, the fact remains that individuals in households earning more than $100,000/year outdrink their lower-income counterparts.
Beyond segmented drinking patterns, the study offers a bounty of useful information for manufacturers and retailers. For example, nearly 30 percent of respondents are interested in the idea of on-demand beer delivery—they want to get their beers the same way they get their food and batteries, on-demand on their doorstep.
Which shelf do consumers look to when purchasing a particular alcohol type; what would people choose if they could only drink beer, wine, or spirits for the rest of their lives; and speaking of beer, what is going on with beer consumption these days? Find out the answers to this and much more by downloading the complete study.
Consumers Want Superfoods
While it is commonly understood that good nutrition promotes general health, consumers are becoming increasingly aware of how their food and beverage choices can help them manage and, in some cases, reverse certain medical conditions, according to health and wellness research by The NPD Group. NPD finds that about a quarter of U.S. adults are trying to manage a health or medical condition by making healthy food and beverage choices.
Younger adults, ages 18-24, are particularly interested in using foods to improve their health. Last year young adults chose foods and beverages with healthy profiles for 19 percent of their meals and in-between snacks. For example, nine percent of adults say a top nutrition goal is protecting brain health and when asked about foods that promote brain health, young adults were 45 percent more likely to express an interest in these products compared to 35-44 year-olds, finds NPD’s Health Aspirations & Behavioral Tracking Service.
Growing interest in food as medicine is evidenced by the types of emerging superfoods*. Among the emerging superfoods NPD is tracking, consumers expressed the most interest in trying the following: elderberry, which contains antioxidants, and is believed to relieve colds, fight the flu, and boost the immune system; cannabidiol (CBD), which is an active ingredient in cannabis and may help treat conditions like pain, insomnia, and anxiety; and Mānuka honey, which is honey from the Mānuka flower and its perceived benefits are wound healing, soothing a sore throat, improving digestion, and more. Also up and coming as superfoods are reishi mushrooms, an Asian mushroom that is thought to boost immune systems among other health benefits; ashwagandha herb, sometimes referred to as “Indian ginseng” is believed to act as a sedative; and microgreens, young vegetables that have an intense aromatic flavor and concentrated nutrient content.
“There are a variety of superfoods, like kale, quinoa, and acai berry, that have mainstreamed and found their way into a myriad of foods,” says Darren Seifer, NPD’s food and beverage industry analyst. “Rather than being one of many offering a superfood, understanding the trajectory of emerging superfoods helps food marketers be ahead of the curve in making calculated decisions about new product investments.”
*Superfoods are foods that are believed to be nutritionally dense and thus good for one's health.
Workers Want Flexible Options
According to FlexJobs’ 2019 annual survey of more than 7,300 respondents, 30 percent of workers have left a job because it did not offer flexible work options, and 16 percent are currently looking for a new job specifically because of work flexibility issues.
Other key findings, conducted in July 2019:
- 80 percent would be more loyal to their employers if they had work flexibility
- 65 percent think they would be more productive working from home than working in a traditional office environment
- Wanting to travel is the primary reason for working, after paying for basic necessities and saving for retirement
- 71 percent have telecommuted in a job before
- Since 2013, work-life balance, family, time savings, and commute stress have been the top four reasons people seek flexible work
- Flexible job seekers are educated, with 69 percent having at least a bachelor’s degree and 28 percent having a graduate degree
“In a tight labor market, companies cannot afford to ignore the value employees place on having flexible work options, but leaders also can’t dismiss the very real bottom-line impact offering flexibility has on their employees’ productivity and retention rates,” said Sara Sutton, founder and CEO of FlexJobs. “The flexible job market is currently very robust, so flexible job seekers are also feeling empowered to seek jobs that are more compatible with their life. In fact, 80 percent of job seekers say they are confident in their flexible job prospects,” Sutton concluded.
Americans Look for Convenience
The most common type of convenience service Americans find themselves spending money on is ride sharing, with 50 percent of Americans using services such as Uber, Lyft and Via. Home services, such as cleaning and lawn maintenance, were deemed popular with 45 percent of Americans spending an average of $107 per month and a total of $1,283 per year to keep their home in tip top shape.
Coming in a close third is food delivery with 44 percent of Americans relying on services such as Uber Eats, Grubhub, and Doordash to deliver their food to them safe and soundly. Americans that use these delivery services spend an average of $77 per month totaling to $929 per year.
The full report can be found here.
Although the most common reason for using convenience services among Americans is to save time and money, one in five claim they simply don’t have a desire to do these jobs themselves. Others say these services increase their own productivity (17 percent), and over one in 10 (11 percent) use them to support the local economy.
The study showed men (75 percent) use convenience services slightly more than women. (73 percent)
While generally on the lowest salaries than other generations, more Millennials use convenience services than their older counterparts (86 percent), compared to 75 percent of Generation X and 53 percent of Baby Boomers
Those in the southern region use convenience services more than others (76 percent), followed closely by the west (75 percent), and the northeast and midwest. (both 70 percent)
I’ve also included commentary from finder’s CEO, Jon Brodsky, should it be of interest:
“Time is valuable, and American adults are doing everything they can to make sure they don’t waste a minute of it. As more and more convenience services are on the rise, Americans aren’t hesitating to use them in order to save themselves a little bit of time.”
“The amount of money we collectively spend on convenience is astonishing — it’s more than the GDP of Saudi Arabia or Switzerland! It is important to consider how much you truly need each of these services. Cutting back on even one of the common convenience services could help you save a substantial amount of money every single month. Using these services half as often could save the average American about two thousand dollars per year, which is money that can be invested for a more fruitful future instead of a more convenient right now.”