
MRM Research Roundup: Ides-of-March 2019 Edition
26 Min Read By MRM Staff
This edition of Modern Restaurant Management (MRM) magazine's Research Roundup features the most allergy-friendly restaurant chains, the winter effect on sales and traffic, the restaurant-going habits of Generation Z, the state of delivery and what people report as life's little pleasures.
Most Allergy-Friendly Restaurant Chains
AllergyEats announced its 2019 list of the Top 10 Most Allergy-Friendly Restaurant Chains in America. Derived from the restaurant reviews of food-allergic diners across the U.S. on the AllergyEats app and website, the list recognizes both small and large restaurant chains that have been ranked highest by food-allergic diners.
The Five Most Allergy-Friendly Large Chains (at least 50 locations)
Maggiano’s Little Italy (4.68)
Chipotle Mexican Grill (4.42)
Longhorn Steakhouse (4.42)
In-N-Out Burger (4.39)
Bertucci’s Italian Restaurant (4.37)
The Five Most Allergy-Friendly Small Chains (fewer than 50 locations)
Burtons Grill (4.85)
Flatbread Company (4.83)
Clyde’s Restaurant Group (4.78)
110 Grill (4.74)
Weber Grill (4.71)
“AllergyEats congratulates the restaurant chains on this list for having earned the highest allergy-friendliness ratings based on feedback directly from the food allergy community,” Paul Antico, Founder and CEO of AllergyEats said. “We appreciate these chains recognizing the importance of accommodating food-allergic diners and for their dedication to supporting the food allergy community. We hope all restaurants will strive to emulate the excellent work of the chains on this list with respect to providing appropriate food-allergic diner accommodations.”
These rankings are based on the compilation and averaging of all individual restaurant reviews by AllergyEats users into chain-specific allergy-friendliness dining out scores. The scoring is based on a 5-point scale, with Burtons Grill garnering the overall best ranking for the third year in a row. This year’s list marks the seventh consecutive year AllergyEats has released its list with Chipotle Mexican Grill, Burtons Grill, and Maggiano’s Little Italy earning and retaining a spot each year since the list’s inception. These perennial winners, each offering a different cuisine type, are positive examples of the increased and diverse options available for food-allergic diners. In-N-Out Burger returns to the list this year and is the only fast food restaurant to ever make an AllergyEats Top 10 Chains list.
Sales and Staffing Woes
Optimism for the restaurant industry came to a sudden stop in February, as winter weather halted sales and traffic. Same-store sales growth was -0.6 percent during the month. Restaurants have not experienced negative year-over-year sales growth since May. It was the worst month for the industry since February of 2018, which may be signaling a new troubling trend for chain restaurants. This comes from TDn2K’s Black Box Intelligence™ data, based on weekly sales from over 31,000 locations representing 170+ brands and nearly $72 billion in annual sales.
“February was the month with the worst same-store sales growth rates for both 2017 and 2018, and it was a disappointing month again this year,” said Victor Fernandez, vice president of insights and knowledge for TDn2K. “Sales growth has been negative for the month since 2017, and the cumulative effect was a concerning 5.2 percent drop in sales for February over the last three years. Bad weather seems to be the catalyst that amplifies the effects of the challenges faced by chain restaurants. There are too many restaurant locations and too many players competing in the food-away-from-home category. Any disruption in the usual routine of consumers seems to be enough to cause a downturn.”
Traffic Plummeted In February
Same-store traffic growth was -3.7 percent during the month, which represented a drop of 3.0 percentage points compared with January’s results. “Chain restaurants clearly have a same-store traffic problem. Growth rates for this important metric have been negative each year since the recession. But with traffic results improving each month since October, the industry was trending in the right direction. That obviously ended in February,” stated Fernandez. “The last time the industry experienced worse traffic growth results occurred when some of the biggest states in the country where suffering through enormous back-to-back hurricanes in August and September of 2017.
Regional Results Highlight the Weather Effect
Only three regions saw positive same-store sales growth during February: California, the Southeast and Southwest. The region with the worst sales growth results, the Midwest, seems to have been hit the hardest this winter.
Closer inspection adds some additional context into February. Same-store sales growth was slightly positive on average during the first three weeks of the month. It was an abysmal fourth week that dragged the month into negative sales growth. The worst performing regions based on same-store sales growth during that final week were the Mid-Atlantic, New York-New Jersey, the Midwest and New England.
Strong Valentine’s Day Boosts Fine Dining to Best Performing Segment
Fine dining was the best performing industry segment during February for same-store sales growth. This segment has been consistently achieving strong sales over the last three years. But in the case of February of 2019, the segment’s performance was boosted by strong sales during the week of Valentine’s Day. The latest data shows that consumers who can afford it are increasingly spending more on fine dining experiences to celebrate the holiday. Same-store sales growth for Valentine’s Day week is in double digits compared with February of 2017. By comparison, sales growth for the restaurant industry overall is essentially flat over a two-year period for that same week.
Economic Growth Slows, Growing Family Incomes Support Optimism
“The 2.6 percent increase in GDP during the fourth quarter marked the second consecutive easing in growth”, explained Joel Naroff, president of Naroff Economic Advisors and TDn2K economist. “However, that rate was still above trend, indicating that the expansion is moderating, not faltering.”
The government shutdown likely slowed the expansion further in the current quarter, but most of the loss should be made up by the summer. Thus, a weak first quarter growth number followed by a more solid second quarter is expected.
There are no major reasons to think the economy will either accelerate or decelerate sharply. The expectation is for growth to be similar to what we saw in the first half of the decade. However, unlike that period, consumer income and spending should rise at a solid pace. With labor markets tight, even with more moderate growth in the economy, wages will remain under pressure with labor shortages and faster income gains spreading across the entire economy. The good news is that the growing family incomes would support continued moderate spending gains, not the tepid ones we saw from 2012 to 2016.
Understaffed Locations Continue To Hurt Restaurants
Staffing woes continued for restaurants according to TDn2K’s People Report. The latest metrics show annual turnover rates increased again for hourly employees and all levels of restaurant management during January. With restaurant turnover at historically high levels and rising, it is not surprising that the average restaurant company said 34 percent of their locations are not fully staffed at any given time based on responses to People Report’s 2019 Recruiting and Turnover Survey. A driver of superior sales and traffic performance is delivering on exceptional service, which is close to impossible for restaurants to deliver when frequently understaffed.
Staffing challenges are compounded by the fact that the industry continues to expand its number of locations and add jobs. Chain restaurant year-over-year employment growth was 2.1 percent during January. The industry has been adding jobs at a pace greater than 2.0 percent for the last three months, adding to the staffing needs in an already extremely tight labor market. An acceleration of wages and salaries is an expected consequence of these
Americans and Global Cuisine
We like to think of America as a melting pot, but that also American cuisine is a result of a melting pot of different cultures. However, a YouGov study of more than 25,000 people in 24 markets finds that American food ranks 7th out of the 34 cuisines. YouGov asked people which of 34 national cuisines they had tried and whether they liked or disliked them. For U.S. residents, these were their top five favorites out of 34 cuisines:
1. American: 91 percent
2. Italian: 88 percent
3. Mexican: 86 percent
4. Chinese: 84 percent
5. Spanish: 79 percent
Americans were least likely to enjoy:
Emirati (23 percent)
Saudi Arabian (24 percent)
Finnish (27 percent)
American food ranks seventh globally and is favored by 68 percent of the people surveyed—with only people in the Philippines (93 percent) ranking the cuisine higher than most Americans do. Residents of Singapore (83 percent), Taiwan (76 percent), and the UAE (75 percent) also rated American food very favorably. On the opposite end of the spectrum, American food is the least popular in Spain (49 percent), China (51 percent), and Germany (53 percent).
Gen Z Effect on Restaurants
The oldest of Generation Z will be 22 years old this year and they are just beginning to make their mark on dining out and eating trends, finds The NPD Group, which tracks on a daily basis all aspects of how consumers eat. Gen Zs made 14.6 billion restaurant visits in 2018 and now represent 10 percent of total foodservice traffic. A large percentage of this generational group have been raised to put a greater emphasis on the quality of food, whether it’s clean, fresh, or nutritionally beneficial, as well as its flavor and function. Their attitudes and behaviors about the foods they consume are now being reflected across grocery shelves and cases.
Growing up with a focus on the flavor and function of food rather than brand will make Gen Zs more challenging for food marketers to reach. For example, regardless of the brand, for Generation Z, if they can’t take a snack with them, it’s not really a snack. Portability is the benefit they value the most when choosing a snack, according to NPD’s recently released The Future of Snacking report. They expect functionality as well with added nutrients and health benefits that will replenish their bodies throughout the day.
When it comes to using restaurants, like Millennials, Gen Zs are frequent visitors of fast casual restaurants and traditional quick service restaurants. Being the first generation never knowing a world without the internet or technology, they are regular users of restaurant apps and delivery, finds NPD’s Delivering Digital Convenience report. In the year ending December 2018, foodservice delivery orders by Gen Zs amounted to 552 million, just a million shy of Millennials’ delivery orders and only a portion of Gen Zs are old enough to order their own delivery. They are also heavy users of restaurant tablets and order kiosks.
“Gen Zs can FaceTime their friends, text their moms, and order a pizza all at the same time,” says David Portalatin, NPD food industry advisor. “Although we’re just getting a peek at what Gen Zs will bring to our culture, economy, and society, this generation will be a seismic force as they emerge into adulthood under more prosperous economic circumstances, yet with their own differentiating set of values.”
Tillster's Delivery Index
Tillster released its third annual Delivery Index, revealing how Quick Service (QSR) and Fast Casual restaurants can use delivery to drive orders and build customer loyalty. The Delivery Index shows that for QSR and Fast Casual restaurants looking to compete in today’s market, having a delivery option is a must. Delivery offers customers a convenience they have now come to expect and gives restaurants a way to bring in orders and grow sales through a new channel. Some delivery programs even allow brands to keep customer data, enabling retention marketing and building loyalty long after their initial order.
But what specific aspects of delivery do customers most care about, and how can brands use it to grow sales? For the third year in a row, Tillster partnered with research firm SSI to survey 2,000 QSR and Fast Casual customers on their delivery preferences and past experiences. The Tillster Delivery Index reveals these findings to help restaurants craft their delivery strategy:
Delivery Drives Sales
Customers would order from their favorite QSR and Fast Casual restaurants more if delivery was offered. In fact, delivery is one of the top five features that customers would like to see from restaurant apps.
Customers Want to Interact Directly with Restaurants
Customers expect to interact directly with their favorite brands, as there is an ease of use and familiarity factor. More than 50 percent of customers want to order directly from a restaurant website or app. Menus are configured and custom to the brand, and customers’ past orders are saved. This goes back to the convenience that customers want, ultimately resulting in a better ordering experience.
Customers Will Pay for Faster Delivery, But There is a Limit
When it comes to delivery fees, customers are willing to pay more to get their orders faster – however, there is an exact dollar amount that the majority of QSR and Fast Casual customers will not pay above.
“The demand for delivery continues to grow, while customer habits and preferences continue to change,” says Perse Faily, CEO of Tillster. “Our 2019 Delivery Index reveals important trends in the QSR and Fast Casual industries; trends that will continue to evolve in an environment ready for delivery-centered disruption. Increasingly, restaurants need a flexible delivery option that will scale with their business and meet customer needs.”
For the full data and information contained within Tillster’s 2019 Delivery Index, visit Tillster.com/Delivery-Index-2019-Q1.
The Delivery Boom
Restaurants’ delivery sales are projected to grow at more than three times the rate of on-premises revenue through 2023. And the majority of the growth will be in digital orders, according to a new report from L.E.K. Consulting.
“As consumers find themselves more and more pressed for time, online ordering from restaurants has captivated a diner demographic increasingly shaped by the sophisticated world of consumer ecommerce,” says Manny Picciola, Managing Director at L.E.K. Consulting and coauthor of Meals on Wheels: The Digital Ordering and Delivery Restaurant Revolution. “And millennials are a driving force behind the growth of digital ordering and delivery. We expect them to account for a full 70 percent of the at-home delivery business by 2020.”
Overall, digital delivery sales are expected to grow at a compound annual rate of over 22 percent through 2023, according to the L.E.K. research. In fact, more than half of delivery consumers now order food directly from the restaurant’s app or website. To keep pace, 37 percent of restaurants are offering online ordering and 32 percent accept mobile payments, according to industry statistics. Much of the rest of digital delivery orders are through third-party platforms like Grubhub, which reported 16.4 million active diners in the U.S.
Restaurants have three main platform options to handle digital ordering and delivery:
- an independent platform, branded and run by the establishment itself;
- a third-party platform, often an aggregator service (such as Grubhub) that handles order-taking and payment but leaves delivery to the restaurant;
- or a hybrid platform, which is some combination of both.
The L.E.K. report points to the following challenges that restaurants must meet in order to stay successful in delivery:
Consumer experience: A positive consumer experience – from order origination to tracking, delivery and service follow-up – is job one. Inconsistency is a key concern here.]
Technology: While online and mobile ordering makes things easier for the consumer, it requires significant back-end integration to ensure the system works with point-of-sale checkout, apps, promotional data and more.
In-store operations: Careful management – like a dedicated floor plan for pickup – can help avoid disruption for in-store consumers caused by delivery and pickup orders.
Supply chain: Efficient execution requires the right equipment and delivery infrastructure. An example is investing in insulated bags to keep meal delivers hot or cold.
Staff: If delivery is secondary to other restaurant operations, a third-party platform might be the way to go. Otherwise, hiring dedicated delivery personnel and training them to fit the restaurant’s specific delivery goals are key.
“Digital ordering and delivery isn’t just pie in the sky for restaurants anymore, and market trends definitely seem to be bearing this out,” says Maria Steingoltz, Managing Director at L.E.K. and report coauthor. “While the right approach for a delivery system depends on the specific needs of the restaurant, it still all comes back to restaurant fundamentals. A deep understanding of logistics, food quality and consumer communications is what it really takes for restaurants to win in the digital age.”
Training?
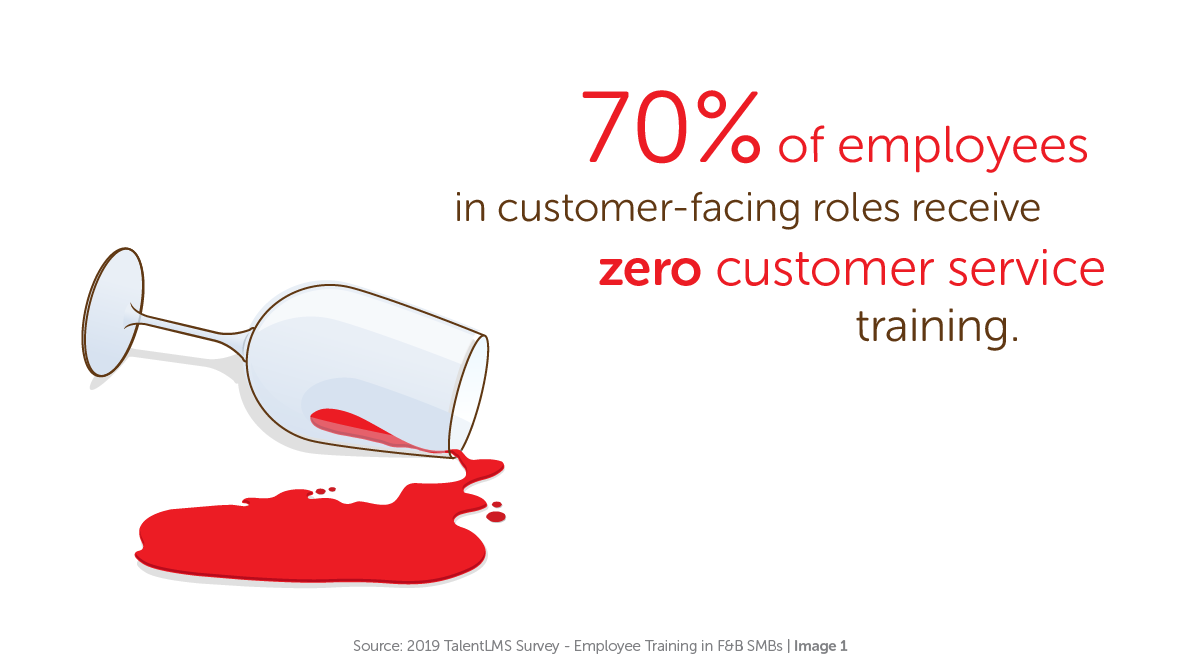
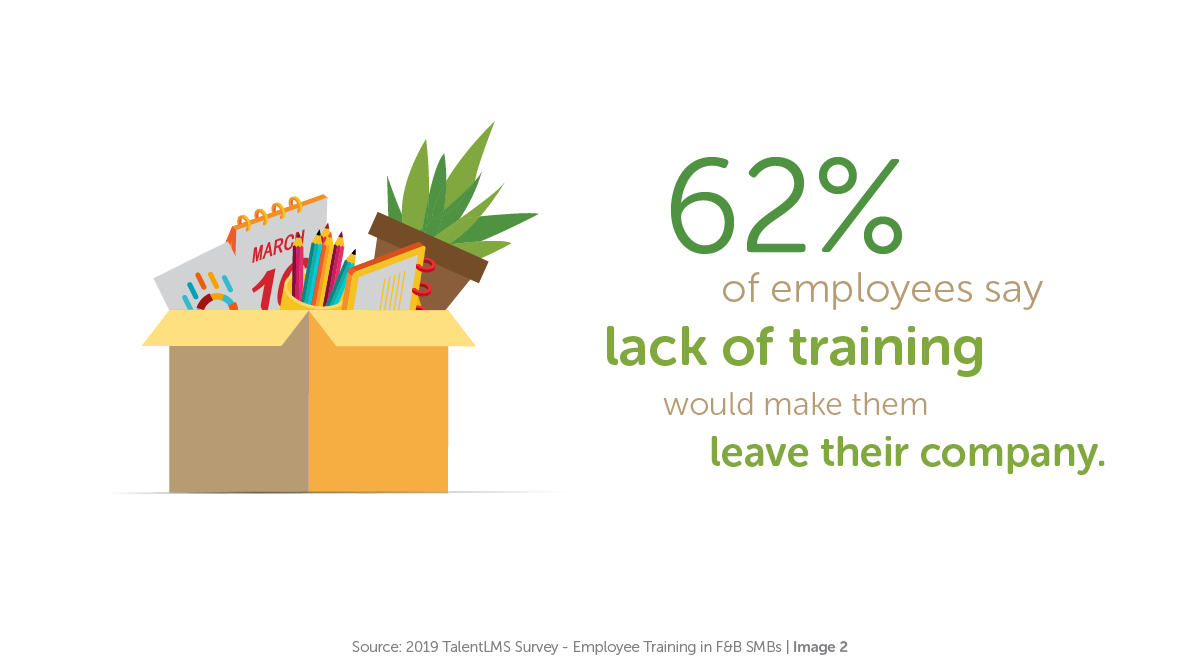
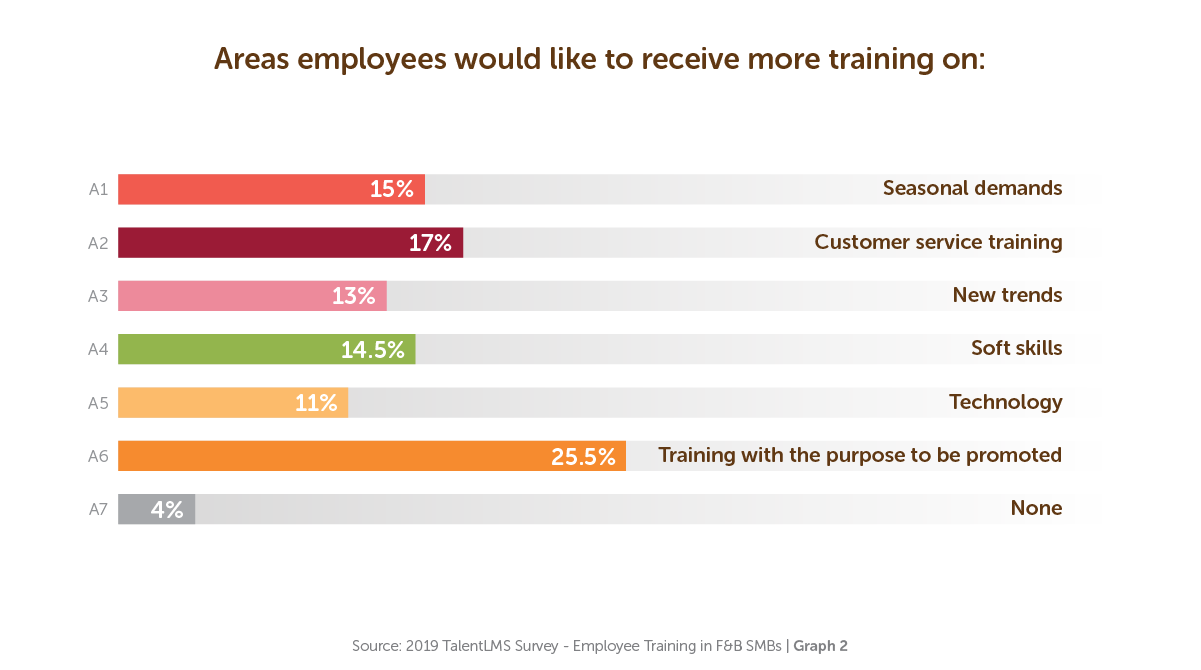
According to a TalentLMS survey on employee training in the F&B industry, training in this industry is, well, stuck in the Dark Ages.
Among the key takeaways:
- 70 percent of customer-facing employees don’t receive customer service training (yes, you read that right)
- Five out of 10 employees only got training once – when they first started working
- 62 percent say that lack of training influences their decision to leave a company
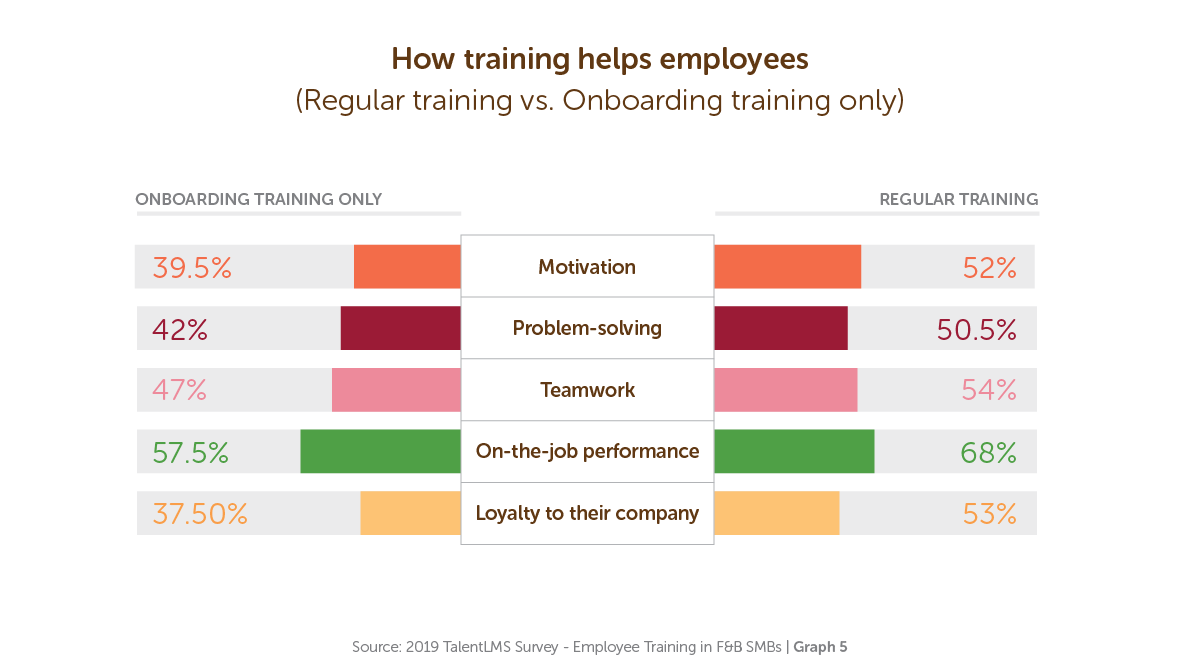
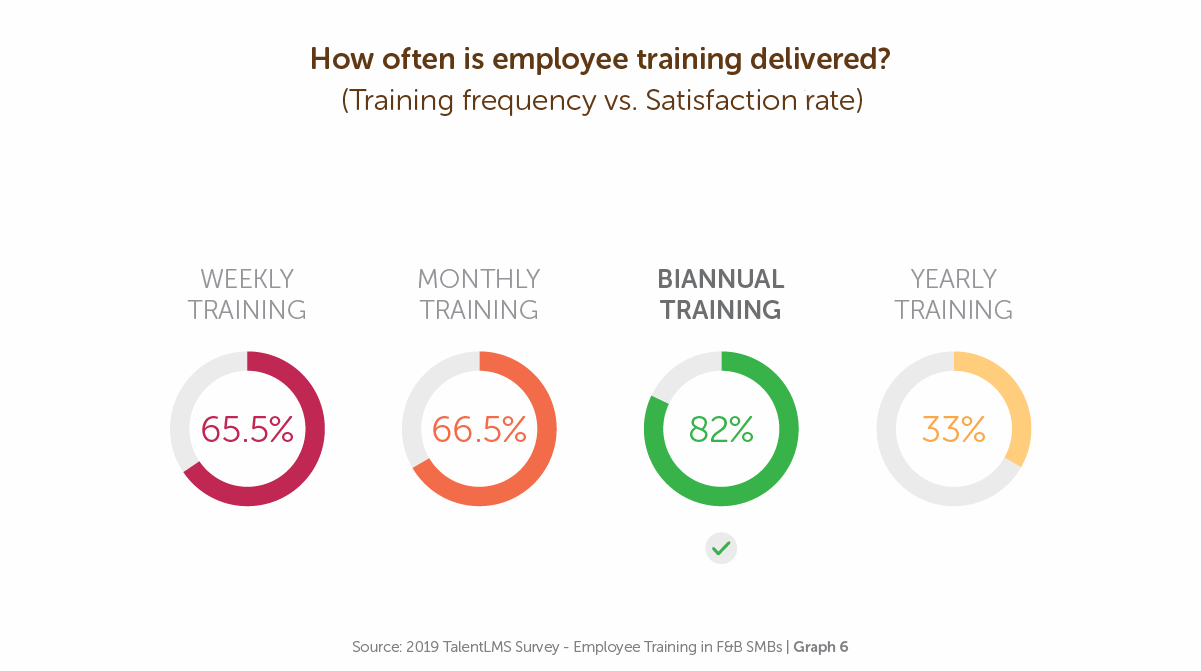
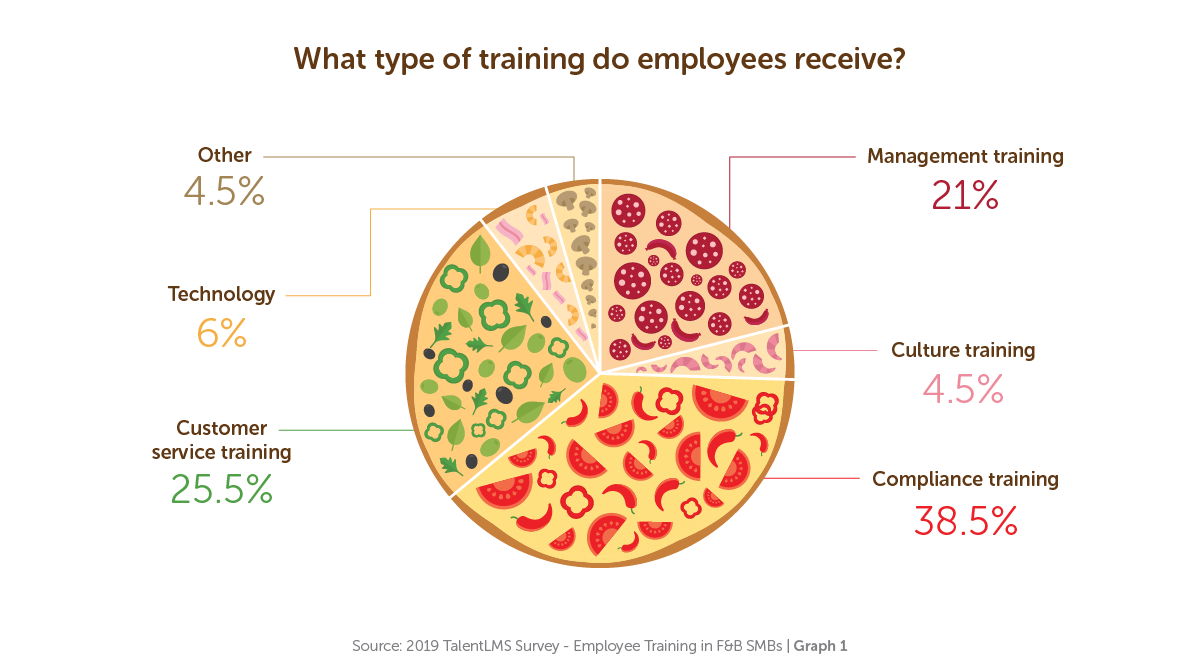
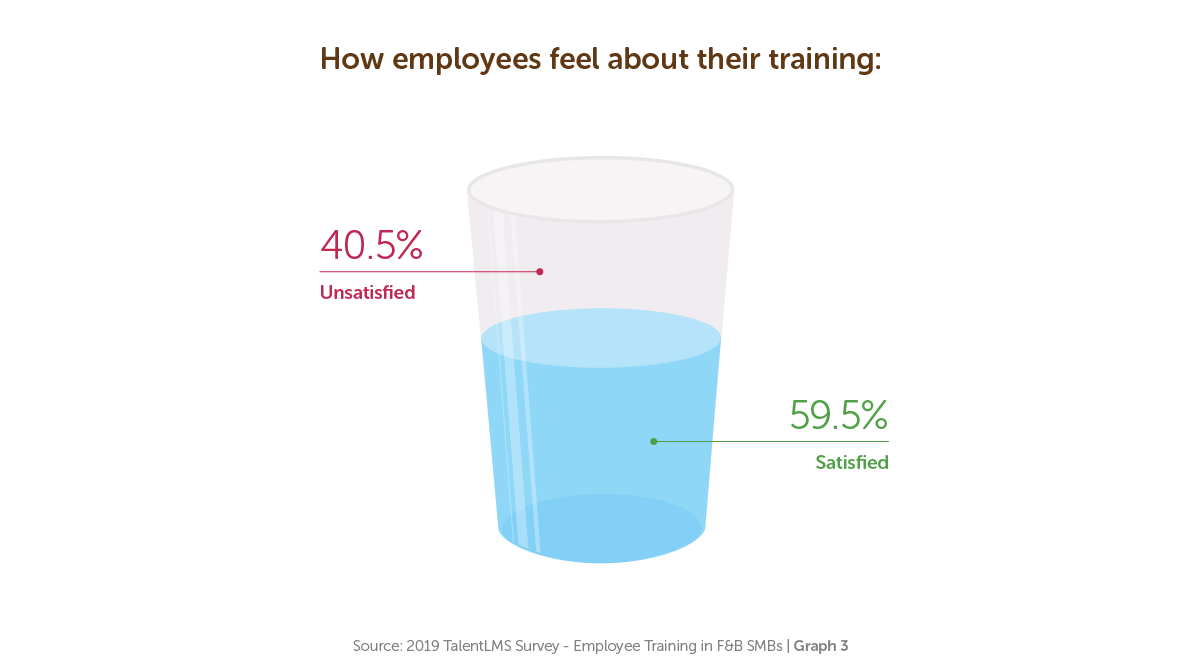
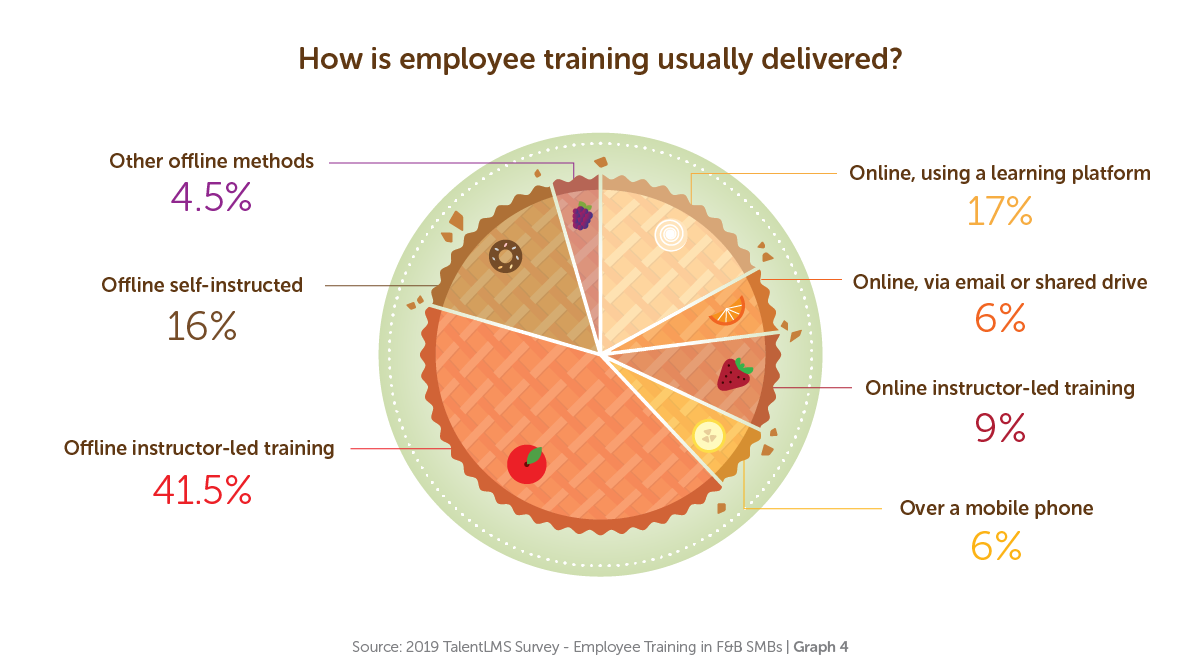
To crosscheck, the TalentLMS team also spoke to the Training Director at Chick-fil-A, who gave his take on customer service training. For his point of view, along with the complete report, click here.
Food Fraud on the Rise
A new report from e-commerce fraud prevention company Forter reveals that online food and beverage fraud spiked 79 percent in 2018 – higher than fraud attack rates in any other industry.
The online food and beverage industry – which includes restaurants, grocers and delivery services – is a particularly popular target for fraudsters because it’s easy to turn a profit reselling valuable items like high-end alcohol. In addition, criminals use this industry as a testing ground to check if cards or digital wallets are valid. Once successful, they know it’s worth using the payment method to steal higher-ticket items elsewhere.
Interestingly, despite seeing a spike in online fraud attacks across numerous industries including food and beverage – it appears the scale of attacks hasn’t grown enough to match the flood of stolen data exposed in 2018 breaches like those at Panera and Chili’s. This raises the possibility that compromised data is being stockpiled to use in future attacks. FORTER Q1 2019 FRAUD ATTACK INDEX FINDINGS
Fraud Attack Index
Spike in Cross-Industry Fraud: Numerous e-commerce industries experienced an increase in fraud attacks, including:
- Electronics (+73 percent), between Q1 2017 and Q1 2018
- Apparel & Accessories (+47 percent), between Q4 2017 and Q4 2018
- Jewelry & Luxury (+19 percent), between Q4 2017 and Q4 2018
- Land Travel & Hospitality (+19 percent), between Q4 2017 and Q4 2018
Sophisticated Fraud Attack Methods Abound:
Fraud rings, when bad actors band together to commit fraud, have grown 26 percent this year.
Fraudsters increasingly use bots to run automated scams, like mass logins, performing upwards of 100 attacks per second.
Policy abuse, when individuals cheat merchants through the use of coupons and discount codes, has increased 170 percent since Q4 2017.
Account takeover, when a fraudster gains unlawful access to an account in order to exploit it, increased 45 percent between Q1 2017 and Q4 2018.
Returns abuse, when criminals abuse retailers’ return policies, has decreased by 90 percent compared to Q4 2017, likely because several large merchants amended their policies to restrict the number of returns per customers.
Instrument manipulation – or the use of burner phones, virtual machines, bots, etc. to pose as a legitimate shopper – increased 13 percent in 2018.
The State of Foodservice Packaging
The Foodservice Packaging Institute’s 2019 State of the Industry Survey shows steady industry volume and profit growth will continue this year. The survey includes input from raw material and machinery suppliers, converters, and foodservice distributors and operators. The survey looks at industry issues, such as changes to volume and profits; expansion and purchasing plans; and opportunities and challenges facing the industry.
“Every year we ask folks in the industry, both members and non-members, to share their thoughts and insights on issues that matter most to the foodservice packaging industry,” said Lynn Dyer, president of the Foodservice Packaging Institute. “Based on the feedback of nearly 90 organizations, the 2019 State of the Industry Survey predicts another positive year for the foodservice packaging industry, despite increasing environmental concerns.”
One of the most notable results is the optimistic outlook for industry growth. Compared with 2018, over 75 percent of foodservice packaging manufacturers and suppliers expect volume expansion and more than 65 percent expect profit growth in 2019.
On the topic of market expansions, respondents overwhelmingly view the fast casual sector as the greatest area for opportunity. This is due to the increased number of fast casual options, quality food offerings and value to their customers. Areas such as supermarket / grocery stores and delivery services are also noted as opportunities for market expansion because of the popularity of being able to grab products on-the-go or have them delivered. New this year, respondents also view convenience stores as an area of expansion as they try to compete with quick serve restaurants and become an eating destination.
The positive indicators for growth in 2019 include over 60 percent of the North American manufacturers planning corporate expansion through construction of new facilities, expansion of current facilities, and mergers and acquisitions, and more than 75 percent of North American converters who plan to purchase machinery in 2019.
The survey results also identified five common challenges facing the industry based on the responses from North American converters and suppliers:
1. Public perception of packaging or foodservice packaging as “waste.”
2. Lack of qualified labor.
3. Recovery / end-of-life options for foodservice packaging.
4. Increasing government legislation / regulation.
5. Environmental activism.
“We are excited by the growth and positive outlook within our industry, despite some of the challenges we face. It’s encouraging to see the optimism within our industry,” said Dyer.
FPI members and contributing participants received complete survey results. A complimentary executive summary of the report is available on FPI's website.
POS Market Forecast
The North American Point-of-Sale (POS) Market is poised to grow by 6 percent in 2019 according to new research from IHL Group. Driven by upgrades due to the impending end-of-life of Windows 7 support, EMV updates at the fuel pumps, and continued investments as retailers adjust to unified commerce, IHL's 2019 North American POS Terminal Study forecasts one of the strongest years of POS growth in the last decade.
According to the research, grocers, convenience stores, and restaurant chains will see the greatest shipment growth, with only department stores showing a decline in 2019 shipments. Restaurants in particular are investigating new POS offerings as they struggle to keep up with the integration of third party delivery services such as Uber Eats, Grubhub and Doordash.
"As consumers continue to demand shopping options via multiple channels and particularly their mobile devices, we see this driving the need for new POS technologies to take advantage of these orders," said Greg Buzek, President of IHL Group. "Once retailers get to a single view of their customer information and inventory across all their channels, the next step for most retailers is the updating of their POS technologies so that they can fully leverage the information to meet customer needs at the store level."
The research also highlights how Android and a mobile-first mindset is now influencing the market. As well, the end of life for Windows 7 support means that there are over 1.7 million POS terminals running on the legacy operating platforms that are now up for replacement. This has many retailers considering other platforms from the traditional fixed position Windows-based POS.
The North American POS Terminal Study reviews the trends, shipment, forecasts and barriers to entry of the POS market. It includes detailed market reviews by retail segment and forecasts through 2023. The report is designed for use by POS solution and maintenance providers, printer manufacturers, payment companies, banks and private equity investors who might have a vested interest in the North American POS Market.
The study is available here.
The Pleasures of Life
It’s official – a home-cooked meal, a good book, and a glass of wine have been named among the top 20 best things in life for Americans, according to a new study. The study of 2,000 Americans asked people to name their simplest little pleasures in life and ranked the top 20 most-selected responses.
Results showed that the things that make us happy are often refreshingly simple. Going on a shopping trip for yourself, having a date night with a partner, the feel of fresh bed sheets and a happy hour with friends were some of life’s greatest pleasures.
Also among the top 20 moments Americans look forward to most were talking on the phone with a best friend, reading a magazine, and spraying on some perfume. A study conducted by OnePoll in conjunction with JaM Cellars, the makers of Butter Chardonnay examined the wine drinking habits and behaviors of 2,000 Americans and found that when it comes to life’s little moments, drinking wine actually tops the list at number one.
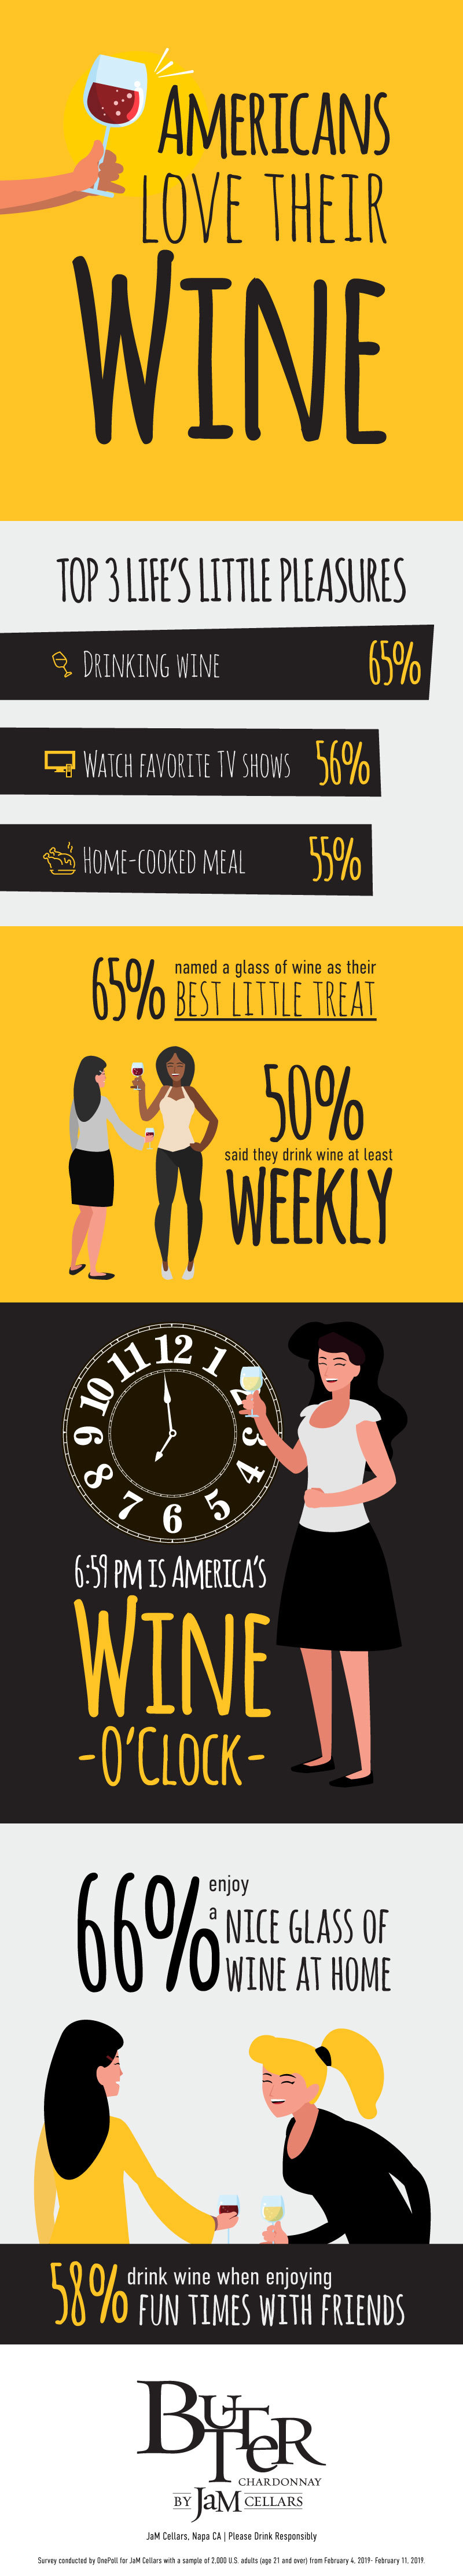
America named a glass of wine as their best little treat, with 65 percent voting it to the top of Americans’ top 20 little luxuries. In fact, half of respondents said they drink wine at least weekly, with half of those drinking wine several times per week. Wine came out on top over moments such as getting a massage, indulging in dark chocolate, and even putting fresh sheets on the bed.
But when is the optimal time for savoring wine? According to the study, 6:59 pm is America’s ideal time to enjoy a glass of wine- voted ‘Wine O’Clock’ by respondents. And Saturday evening is the preferred day of the week for 55 percent of those surveyed who are likely to be sipping some wine at the end of the week. Interestingly enough, wine is also enjoyed consistently throughout the week.
Wine is an everyday treat for Americans because it is relaxing (62 percent), people enjoy the taste (57 percent), and it’s a great way to have fun with family and friends (37 percent). And 66 percent of the people surveyed revealed they enjoy a nice glass of wine at home. America’s favorite place to enjoy wine is no longer a traditional food setting, it turns out, the couch is the go-to spot for wine.
“Wine can be great with food, but we’ve always felt it doesn’t have to be fancy, formal, or confined to the dinner table—and it looks like America agrees” said Michele Truchard, Co-Founder of JaM Cellars, makers of Butter Chardonnay. “This is the vision we had when we started JaM Cellars 10 years ago. Wine can be intimidating and expensive, so we make great-quality wines that are simply easy-to-love anytime. Finding your favorite wine and having a few bottles on hand to share with friends is all part of the enjoyment of life.”
But, the reason people enjoy their wine so much is because for 67 percent of Americans, it’s a great way to relax, unwind, and enjoy some me-time. But not everyone sips wine by themselves. It turns out, 49 percent of those studied actually enjoy the company of their spouse or partner when enjoying wine, while another 58 percent revealed that enjoying fun times with friends was a leading scenario that would call for Wine O’Clock.
“It’s so exciting to see Americans enjoying wine more often and whenever they choose. Whether it’s a little me-time, or hanging out with girlfriends, wine really is a great everyday treat. First and foremost wine should be delicious, fun and easy to love. 6:59 pm is a fantastic Wine O’Clock to put on the calendar, but the perfect time for wine is whenever and wherever you choose” added Michele Truchard, Co-Founder, JaM Cellars makers of Butter Chardonnay.
Changing Alcohol Marketing
As U.S. alcohol consumption continues to decline, the alcohol industry is shifting their marketing strategies to reach a younger generation that prefers to sip on high quality instead of high quantity. As social media becomes one of the primary channels for reaching consumers, alcohol and spirits brands are eager to establish powerful, effective and compliant influencer programs that speak to target audiences, according to a new report released today by Traackr, the influencer relationship management platform.
The State of Influence: Spirits, Beer and Wine report provides insights into the online conversations around alcohol brands as told by more than 9,000 top food and beverage influencers. In this report, Traackr looked at some of the spirits trends in influencer content from January 1, 2018 to December 31, 2018 on Instagram, YouTube, Facebook, Twitter and additional social networks.
Looking solely at share of voice in the beer category, craft breweries like Russian River Brewing Company may have far fewer activated influencers than mass market beer brands like Michelob ULTRA and Guinness (112, 384 and 2,248 influencers, respectively), their influencer posts result in approximately double the overall engagement rate (1.84 percent engagement rate for Russian River, versus .93 percent and .65 percent for Michelob ULTRA and Guinness, respectively). Higher engagement rates typically signify that brands are collaborating with influencers whose content resonates well with their audiences.
“Across the board, mass market beer brands perform poorly among influencer generated content, signaling a trend we’ve seen across consumer segments – people will pay a premium to associate themselves with brands whose purpose transcends their product,” said Pierre-Loic Assayag, CEO and co-founder of Traackr. “Alcoholic beverage brands that connect through authentic conversations from trusted sources will stay relevant and continue to grow in the current downturn, while others will be further commoditized and will struggle with sales and margins.”
In addition to mass market beer, the report summarizes findings from the following alcohol categories: cocktail trends, gin/whiskey/vodka brands, hard cider brands, wine varietals and brands and more. Traackr analyzed the share of influence in activated influencers, mentions and engagements for each brand.
Additional key insights from segments in the report include:
- Cocktail trends – Classic drinks such as martinis and manhattans lead the cocktail conversations among influencers, but content about margaritas gets the most engagements. Gin and whiskey are the top types of spirits garnering mentions and engagements.
- Wine – Chardonnay is the leader in wine when it comes to influencer mentions, but Pinot Noir and Cabernet Sauvignon overtake it in engagement rate (2.24 percent and 2.05 percent, respectively). Chardonnay drops to fourth in engagement rate (1.92 percent). Barefoot Wine is the leader in brand mentions with 27 percent share of voice, but their influencer content shows low engagement rates (.74 percent), as Gallo only has 2 percent of brand mentions with an engagement rate of 2.73 percent.
- Beer – Guinness has the highest number of activated influencers across all categories, but only has the fourth highest engagement rate among mass market beer brands.
“We’ve observed customers like artisanal gin distillery Sipsmith overtake larger gin brands like Tanqueray, Seagram’s and Beefeater in social share of voice and engagement by collaborating with influencers who love their products and have earned trust from their community,” said Assayag.
Whiskey on Fire
Step aside, green beer. This St. Patrick’s Day, Americans will be celebrating with a dram of super premium Irish Whiskey, according to the Distilled Spirits Council. The Council reports that while the entire category is growing fast, the higher priced categories are “on fire.” Since 2002, high-end premium and super premium Irish Whiskeys grew a staggering 1,106 percent and 3,385 percent, respectively. In 2018, nearly 4.7 million 9-liter cases (+10 percent compared to 2017) of Irish Whiskey were sold in the United States, generating an astounding $1 billion (+12 percent compared to 2017) in revenue for distillers.
“This is an exciting time for whiskey hailing from the Emerald Isle. The category is on fire,” said Distilled Spirits Council Public Relations Director Maggie Quinn. “We are experiencing a global whiskey renaissance, and Irish Whiskey, with its triple-distilled soft, sweet and smooth flavor profile is captivating U.S. consumers. Further, it has a long and storied heritage as one of the first whiskeys, and that is attractive to millennials who are always seeking a backstory in their glass.”
Irish Whiskey’s smooth profile makes it particularly appealing to adult consumers who are new to the whiskey category. Alongside approachability, the unique and versatile flavor of Irish Whiskey allows it to be enjoyed neat or in a cocktail. Leading mixologists across the country have showcased the spirit in their innovative and artisan cocktail menus.
The Council, along with the Irish Whiskey Association and Irish Consul General Ciaran Madden, hosted a tasting event for top media and influencers at the Consulate tonight. It featured the following member company brands: Teeling (Bacardi); Kilbeggan (Beam Suntory); Slane (Brown-Forman); Baileys (Diageo); Ballyhoo, Spade & Bushel (Millstone Group); Jameson (Pernod Ricard).
Top Donut Cities
When BestPlaces.net Founder and President Bert Sperling visited Austin, Texas on business last year, he thought to himself “There seem to be a lot of donut shops here.” Austin is known for its music scene, cultivated “weirdness,” and legendary barbecue, and while the Texas capital delivered in these expected areas he couldn’t shake the feeling that Austin might also be a donut town.
With that running around his head, “The Guru of Lists” found his next project – a list of the “Top Donut Cities” in the United States. But since BestPlaces is founded on hard data, it was a bit early to name Austin “Donut City, USA” simply because he walked past a handful of pastry purveyors on Rainey and 6th Street.
A methodology for the study soon became clear. The study would be limited to the Top 100 Metro Areas in terms of population, since roughly two-thirds of the nation’s population live in those cities. Then, these metropoli would be ranked in order of number of donut shops per capita. The per capita calculation is important in lists of this type, because if it were simply the TOTAL number donut shops, the largest cities would top the rankings, with no deference to density or frequency.
Number were crunched and results crystallized like the sugary coating on a Raised Glazed. While Austin had more donut shops per capita than Sperling’s home base of Portland, he was surprised when it failed to crack the top ten. But it was clear that one region in the United States reigned supreme in their affinity for donuts.
Here are the “Top Ten Donut Cities” in the United States. Oh, and we were sure to include both “donut” and “doughnut” shops.
- Providence-Warwick, RI
- Worcester, MA
- Boston-Cambridge-Newton, MA
- Hartford-West Hartford-East Hartford, CT
- New Haven-Milford, CT
- Bridgeport-Stamford-Norwalk, CT
- Springfield, MA
- Scranton–Wilkes-Barre–Hazleton, PA
- Dallas-Fort Worth-Arlington, TX
- Albany-Schenectady-Troy, NY
For complete results, click here.
The Evolving Meal Kit Market
The meal kit market is quickly evolving from nearly exclusively online and subscription-based, home delivery services to on-demand availability in-store and online. Consumers are trying out the different ways to purchase meal kits, with over a quarter of recent users purchasing kits both in-store and online, finds The NPD Group. While meal kit marketers and meal kit users are experimenting to find the right fit, there is a large group of consumers, 93 million, who have never tried a meal kit but are interested in giving them a try, which points to a market opportunity, according to NPD’s What’s Next for Meal Kits report.
“There is an untapped market for meal kits and it’s up to meal kit providers and retailers to find out what it will take to get a potential meal kit user to become one,” says Darren Seifer, NPD food industry analyst. “The subscription model is likely to remain relevant, but it’s important to remember consumers are looking for meal solutions both online and in stores.”
A good start to reaching those interested in trying meal kits is knowing who typically uses meal kits. Meal kit users are more likely to be Millennials, have households with kids, and higher incomes. Online and in-store meal kits appeal to similar demographic groups although in-store kits skew to households with children less than 13 years old and higher income levels.
“Meal kits are here for the long-term because they’re meeting the needs of consumers by providing a level of convenience and shortcuts to meal prep while also providing fresh foods,” says Seifer. “Meal kits marketers looking to capitalize on providing meal solutions should follow consumers to all their points of purchase.”
Eco-Conscious Consumers Want Recyclable Packaging
Eco-conscious consumers are increasingly shunning food and drink businesses who don’t offer recyclable packaging, new research has revealed. Catering equipment retailer Nisbets commissioned a survey of 1,000 members of the British public to uncover their opinions on food and drink vendors who do and do not use recyclable packaging.
The research found that almost 50 percent (49 percent) of Brits would be willing to pay more for their takeaway if the packaging was recyclable. Additionally, a third of Brits (31 percent) would actively avoid a vendor who didn’t use recyclable food and drink packaging.
When it comes to attitudes across the different age groups, 18-24 year olds are the most eco-friendly, with almost 60 percent willing to pay more for recyclable packaging, compared to only 35 percent of 35-65 year olds. Looking at city splits, Glaswegians would be least willing to pay more for recyclable food and drink packaging (27 percent), compared to 61 percent of those in Sheffield.
In contrast, three quarters (73 percent) of people believe food and drink vendors should absorb additional costs related to recyclable packaging, with many believing that it is the responsibility of the business not the customer. The large majority (85 percent) of over 65s shared this opinion.
The most eco-conscious* cities were found to be:
1. Edinburgh – 47 percent
2. Nottingham – 40 percent
3. London – 38 percent
4. Southampton – 33 percent
5. Manchester – 32 percent
*Those who would actively avoid food and drink vendors who don’t use recyclable food and drink packaging
Kirsty-Lee Griffiths is the founder of Macro Food, a healthy, macro-friendly fast food business. She uses bagasse (a dry fibrous residue made from sugarcane) and PLA (Polylactic Acid, made of renewable resources such as corn starch or sugarcane). Talking about recyclable packaging, she said:
“Personally, I recycle everything I can at home so morally it wouldn’t be right for me to start a business and not use recyclable packaging. There’s a lot of single use plastic/non-recyclable materials being used in the takeaway industry because it is so cheap, but I think a lot of businesses are starting to move away from that as much as possible. Also, as we are a health food provider, it wouldn’t be right for us not to care about the health of the planet as well. Businesses need to represent the same values as their customers and with the wealth of information that was in the press about single use plastic last year, the public wants to move away from this plus other non-recyclable materials and unnecessary packaging as much as possible.”
Rhiannon Fender, Environment & Sustainability Manager at Nisbets, commented on the findings: “Consumers are savvier than ever about recycling and being environmentally friendly. It’s great to see that so many are taking the time to research and make purchasing decisions based on the environmental attitudes of the companies they interact with. It’s more important now than ever before for businesses to think about their environmental impact and to look for ways to reduce their carbon footprint.”
For a link to the entire report, click here.
Flushing Money Away
More than one third of Americans are literally flushing profits down the toilet for businesses. According to a new survey commissioned by Sofidel, 35 percent of Americans say they typically use more toilet paper than needed when using a public restroom. The survey was conducted online by The Harris Poll from Feb. 1-5, 2019 among 2,049 U.S. adults ages 18 and older and also revealed Americans’ preferences toward business’ sustainability efforts in public restrooms.
“When restroom guests use too much toilet paper, it’s not only wasteful and costly to reorder product more frequently, but can lead to expensive and unpleasant toilet clogs,” said Giorgia Giove, Marketing Manager – Away from Home, Sofidel America. “It’s important for businesses to invest in toilet paper that actively works to limit the risk of clogs, as well as dispensers that discourage excessive paper consumption. Doing so will not only have a positive impact on the bottom line, but also the environment.”
The survey found that nearly half (45 percent) of millennial women (age 18-34) admit to typically using more toilet paper than needed when using a public restroom. Because toilet clogs create odors, gross out guests and require time and money to solve, Sofidel’s Papernet brand offers Bio Tech toilet paper. Once the paper contacts water, it produces safe enzymes that feed on the buildup in pipes to reduce the risk of clogs as quickly as after one month of use. Exclusive use of Bio Tech can provide total savings of up to 40 percent compared to the combined cost of standard toilet paper and plumbing emergencies.
The survey also revealed that a strong majority of Americans (87 percent) feel it is important that businesses use sustainable products in their public restrooms. Nearly half (45 percent) say it is very important for businesses to provide green restroom products. These products may include water-saving faucets and toilets, dispensers that reduce paper consumption, toilet paper that sanitizes pipes and cleaning solutions made with fewer chemicals.
Papernet also sells restroom dispensers that help minimize paper consumption. The Touchless Roll Towel dispenser features a unique and customizable paper-saving mode. Through no-touch operation, it dispenses one paper towel sheet and then offers a shorter towel if a customer requires it. Facilities can select the desired savings percentage, set different time delays and choose the length of the second sheet of paper. Meanwhile, the HyTech Auto-Cut Jumbo Roll Tissue (JRT) dispenser uses single, flat-sheet dispensing to prevent customers from pulling an excessive amount from the roll. This dispenser offers 15 percent savings compared to traditional dispensers.
For more information, click here.
Robot Takeover
Robots shipped to North American companies in record numbers last year, with more non-automotive companies installing robots than ever before. Statistics from the Robotic Industries Association (RIA), part of the Association for Advancing Automation (A3), show 35,880 units were shipped in 2018, a 7 percent increase over 2017, with 16,702 shipments to non-automotive companies, up 41 percent. Notable growth came in areas like food and consumer goods (48 percent), plastics and rubber (37 percent), life sciences (31 percent), and electronics (22 percent).
Meanwhile, shipments to the automotive industry slowed, with only 19,178 units shipped to North American automotive OEM and tier supplier customers in 2018. This was 12 percent lower than the 21,732 units shipped in 2017. Overall, the automotive industry accounted for only 53 percent of total robot shipments in North America in 2018, its lowest percentage share since 2010.
“While the automotive industry has always led the way in implementing robotics here in North America, we are quite pleased to see other industries continuing to realize the benefits of automation,” Burnstein said. “And as we’ve heard from our members and at shows such as Automate, these sales and shipments aren’t just to large, multinational companies anymore. Small and medium-sized companies are using robots to solve real-world challenges, which is helping them be more competitive on a global scale.”