MRM Research Roundup: End-of-September 2020 Edition
1 Min Watch By MRM Staff
This edition of MRM Research Roundup features diner expecations over the next few months, robots for QSRs, and the best cities for coffee lovers, vegans and vegetarians.
How Comfortable are Diners?
Rewards Network, together with American Airlines AAdvantage Dining and United Airlines MileagePlus Dining, surveyed their members to learn more about what they anticipate their dining habits will look like over the next few months. The survey results reveal that 35 percent of respondents feel the same level of comfort dining out now as they did at the beginning of the pandemic.
Some highlights inlcude:
Consumers' projected dining out frequency
- 75 percent of respondents said they plan on dining out at least biweekly, with 30 percent saying they plan to do so five or more times per month
- Only about seven percent of respondents said they anticipate rarely or never eating out
Primary reasons for dining out less
- Overwhelming top response was fear of catching/spreading COVID-19, followed by a corresponding reduction in travel
- 18 percent said it will be to save money
- 13 percent said it was because they now prefer takeout/delivery
The importance of making guests feel comfortable
- 32 percent of respondents say they feel less comfortable dining out now compared to the beginning of the pandemic while 33 percent responded that they feel more comfortable now
- 24 percent of respondents said they were very comfortable dining indoors, while 19 percent selected very uncomfortable
- 32 percent of survey takers chose outdoor seating availability as a factor in their dining-out comfort level
Most Important safety initiatives
- 73 percent said social distanced tables
- 60 percent respondent frequent sanitizing of surfaces
- 55 percent choose staff wearing gloves and face masks
Takeout and delivery: a fast-growing and critical component for restaurant success
- More than half of survey respondents said they will order more than usual, with only one in 10 saying less than usual
Most important factors when it comes to the takeout and delivery
- The top choice by far was having a culinary experience similar to eating at the restaurant
- Followed (not surprisingly) by restaurants and delivery drivers following proper safety protocols, price, and ease of ordering from the restaurant.
- Only 13 percent of respondents said that ordering from their favorite delivery app was important, but 38 percent said that the ability to easily order from the restaurant website mattered to them
Incentivize guests to choose your restaurant
- Nearly half of respondents said that it's even more important now compared to before to receive reward incentives when dining out
Barring a dramatic decrease in coronavirus infections, U.S. restaurants are very likely to have fewer dine-in customers this fall/winter than usual. With decreased demand, it will be imperative for restaurants to deliver impeccable experiences to keep guests coming back, and to encourage positive reviews (especially important during a time when prolonged isolation is causing many people to be more active online). Restaurant operators should also focus on remarketing to guests through email or other means, as well as offering return visit incentives to keep customers coming back.
While nothing can replace the experience of dining out, restaurants should continue to invest in providing superior takeout and delivery services, as this will likely be the only way many consumers will feel comfortable consuming restaurant meals for some time. Another potential revenue generator is offering meal kits that customers can cook at home themselves. The rise in popularity of meal kit services such as Blue Apron, Freshly, and Purple Carrot has already proven the potential of this model, and many restaurants are already reporting success engaging with their customers in this way.
A final piece of advice for restaurants is to invest in a user-friendly reservation system. Whether partnering with a third party or launching your own, it's important to make it as easy as possible for customers to book a table at your restaurant.
While most restaurants are going above and beyond to ensure that customers feel safe in their establishment, we wanted to find out what consumers' comfort level is when it comes to dining out now compared to in the first few months of the pandemic.
The results were pretty evenly split, with 32 percent of respondents saying they feel less comfortable dining out now. This could be signaling continued uneasiness among some member of the public due to spikes in coronavirus cases across the country. However, 35 percent said they feel the same level of comfort and 33 percent responded that they feel more comfortable than in the earlier stages of the pandemic. Possible contributing factors for the increased comfort level could be enhanced dining room safety precautions as well as rising risk tolerance as most consumers have gotten a few positive dining out experiences under their belt.
They then looked a little deeper at consumer sentiment on indoor dining by asking survey takers how comfortable they are dining indoors at a restaurant that takes the proper safety precautions. There were a significant number of respondents on both ends of the spectrum, with 24 percent of respondents choosing very comfortable, and 19 percent selecting very uncomfortable. However, most people tended to land somewhere in the middle, with about 57 percent saying they were somewhat comfortable or somewhat uncomfortable dining indoors.
The majority of people fall somewhere in the middle, feeling either cautiously optimistic or somewhat skeptical about dining out. This group can likely be persuaded to dine out, but will need restaurants to demonstrate that basic safety standards are being followed in order to feel comfortable. They may also need to have an exceptional experience to feel that it's worthwhile to return. This further highlights the need for restaurants to pay close attention to details in the end-to-end dining experience: from the reservation, to the meal, to the service.
When it comes to to-go orders, consumers are increasingly expecting to receive a meal at a reasonable price that travelled well (perhaps with reheating instructions), and was delivered in a safe manner. It's important for restaurants to not waver in meeting these to-go expectations, as one sub-optimal meal could cost them a customer (or more, if that customer goes on to share their negative experience with others).
Since takeout and delivery will likely continue to play a major role for the foreseeable future, restaurant owners need to closely evaluate their per-order costs, and consider dropping third-party providers that cause too big a hit to their bottom line. Owners should also examine the economic feasibility of launching their own delivery service, which could be much more profitable in the long run. And, as mentioned previously, they need to ensure that the ordering experience is as easy and intuitive as possible for customers.
Finally, restaurants should develop a cohesive remarketing strategy. Although nearly half of respondents indicated that they try new restaurants somewhat often or very often, nearly half said they rarely do. This is why remarketing to existing customers should be a critical component of any restaurant's marketing strategy.
Earning rewards for dining out or ordering takeout/delivery is becoming even more important to consumers. Restaurants that aren't already offering some kind of loyalty program should consider creating one, especially as consumers' grip on their wallets have tightened. Restaurants with a loyalty program should also highlight the benefits while remarketing to guests.
Small Business Recovery
The Verizon Business “Small Business Recovery Survey”, is a follow up from findings released this spring addressing the effects and concerns of small businesses in the wake of Covid-19.
Restaurant and bar related concerns
- 57 percent of restaurants and bars believe they can stay open for more than six months if conditions continue
- 49 percent of restaurants and bars have starting delivering products and services differently amid the pandemic
- 50 percent of restaurants and bars have started offering new products and services to adapt to changing customer needs
- 77 percent of restaurants and bars indicated that ensuring the health and safety of employees was their top concern
Broader SMB concerns
55 percent of small businesses surveyed have concerns about staying afloat financially with social distancing regulations that limit business capacity
67 percent of small businesses reported declining sales, representing moderate improvement, versus 78 percent in April
Regardless of their party affiliation, small business decision makers view the outcome of the 2020 election as consequential: 81 percent say it will impact small businesses in the U.S., while 57 percent say it will impact their own business' financial security
The Buzz on Beverages
Rabobank’s newest Beverage Market Buzz report, which details how companies have responded to the COVID-19 crisis and 5 types of strategic responses that have shown some success.
Connecting with consumers’ Covid-19 fatigue
- History shows that investing in brands during downturns pays long-term results
- Beverage companies are using advertising and other channels to connect with consumers by laughing at shared absurdities and unifying around shared sacrifices
Recreating the on-premise at home
- Bringing the experience home through novel product combinations, new product innovations, and digital experiences like live-stream events
Expanding e-commerce investments
- Rabobank estimates the pandemic has accelerated online food and beverage purchasing penetration by 18 months
Retooling the on-premise
Reformatting stores, expanding mobile order and pay platforms, self-pouring solutions, etc.
Providing support for on-premise partners
Build a Better QSR Robot
Your favorite bartender or waitress could soon be replaced by a mechanical counterpart on a future visit to the local pub or restaurant, says a new study from Ball State University.
In her study, “How to Build a Better Robot for Quick Service Restaurants,” recently published in the Journal of Hospitality and Tourism Research, Dina Marie Zemke, an associate professor of residential property management in the Miller College of Business, found that the overwhelming majority of respondents believe that there is no stopping the robotic transformation of the food service industry, including quick service restaurants (QSRs).
“There was a high level of resignation about the inevitability of QSRs incorporating robots during our group interviews,” said Zemke, who collaborated on the study with several faculty from the University of Nevada, Las Vegas. “This finding is similar to the acceptability of routine societal change. Participants felt that the incorporation of robotic technology is a question of when, rather than a question of if.”
“And, imagine telling your problems to a robot instead of a human,” she said. “It changes the dynamic of bartending dramatically when you add in mechanism with artificial intelligence and not common sense.”
Zemke points out that robotic technology designed to perform specific physical tasks has recently emerged as an option for hospitality businesses due to decreasing robotic equipment costs.
The price to purchase a hamburger cooking robot is about $60,000. However, many industrial service robots, such as robotic vacuums and robotic assembly arms, are leased. A commercial robotic vacuum will cost between $7,000 and $15,000 to purchase, but they are often leased at $4 to $6 per hour of operating time, less than the minimum wage of $7.25. The manufacturer or distributor is responsible for all maintenance on the device.
Zemke noted that the majority of robots used in the hospitality industry are technologies initially developed for other industries, such as automobile and food manufacturing, which have been modified from their original functions to perform their tasks in a hospitality setting.
Examples include the work performed by robotic vacuums, information displays, and robotic manufacturing assembly arms, which put together pizzas and cocktails.
But, the study also found that robots are still a novelty for most people.
“At this point, a lot of people have a positive impression of robotic technology that entices guests to visit the location at least once, although they were unsure whether the robotics would sufficiently overcome average food or service to entice them to return to the restaurant a second time,” Zemke said. “This is consistent with past examples of restaurant concepts that provided a highly unique experience but suffered from the reputation that the guest would visit once because of the ‘experience’ but would not return because the food was too expensive and/or the food quality or service provided a poor value overall.”
Despite the impending changes, the study found that respondents have major concerns regarding the societal impact of robotics entering the realm of QSR operations, including the cleanliness and food safety of robot technology, and communication quality, especially voice recognition, from both native and nonnative English speakers.
In the end, Zemke believes that rising labor costs will force restaurant owners to turn to robotics.
“The genesis of this study was the ‘Fight for $15’ movement, which focused heavily on hourly service jobs, such as those in franchised quick service restaurants,” she said. “Many restaurant operators cautiously suggested that they may explore robotics as an alternative to absorbing these increased labor costs.”
Pandemic Habits Are Here to Stay
A new global study, commissioned by Sinch finds COVID-19-induced behaviors such as avoiding crowds, flying, and dining out are here to stay, even in a post-pandemic world.
According to the study, even when the pandemic is over, 58 percent of people will continue to avoid crowds, 52 percent will avoid unnecessary travel, 46 percent will spend less time inside stores and 45 percent will dine out less often.
The study also found that, despite a decade of digital transformation, brands have yet to deliver the most useful digital and mobile experiences people say they want in a post-pandemic world, like making and confirming appointments by text, receiving personalized videos, or being able to message with banks, doctors and other service providers. The research report explores the opportunities available for brands nimble enough to transform the value they bring to customers.
Communicating with businesses, friends, and family via messaging, video, and other mobile/online services — instead of in-person — are also behaviors that will endure. As digital communication overtakes physical interactions, organizations are playing catch-up at record speeds, creating demand for new levels of digital and mobile services that businesses have yet to fulfill. But many organizations don’t know which channels their customers prefer and have siloed internal systems and data making it harder to deliver the most valuable content in the most valued channel at the right time.
What makes this moment particularly powerful is that just as customers are turning away from physical interactions and transactions, the ecosystem of tools and channels that empower digital conversations is exploding. Facebook Messenger and WhatsApp, the most popular messaging apps in the world, now claim 3.3 billion monthly active users. And yet, the research shows enterprise brands have been slow to innovate via messaging.
This opportunity is quantified by the gaps between the services customers already use and what they say would be very useful. For example:
- 91 percent want mobile notifications of suspicious activity (e.g., banking), but currently, only 31 percent receive them
- 89 percent would find notifications about a service outage useful, but only 27 percent today receive them
- 88 percent would consider it valuable to have information about urgent public health care issues delivered by text or messaging, but only 24 percent currently receive this service
- 73 percent want to receive personalized videos (e.g., an illustration of services performed by an auto mechanic), but only 16 percent currently do
- 88 percent want to make an appointment by text or messaging, but today only 36 percent of people are able to
- Similarly, 52 percent of respondents today have confirmed an appointment by text or messaging but 94 percent would value this service
- 75 percent would appreciate getting reminders by text about items left in an online shopping cart, whereas just 39 percent currently do
- Just 14 percent of people today use any kind of mobile or online health assessment with a medical provider, something that 78 percent would like
- 41 percent currently receive personal discounts via text or messaging but 86 percent would value this offering
Using next-generation messaging, voice, video, and chatbots, global companies can now have highly personalized conversations with their customers at scale. Not only does this drive better customer experiences but real business value in terms of increased sales, decreased costs, or an uptick in customer loyalty.
“Global brand leaders have heard the drumbeat of ‘mobile transformation’ for years, but the COVID-19 crisis, and its impact on individual behavior, brings the need into sharp focus. This research shows that these behaviors aren’t going to change, and brands need to adapt accordingly for the long haul,” said Jonathan Bean, CMO of Sinch. “Customers are now overwhelmingly mobile-first, and they want utility at the press of a button: the ability to reserve, confirm, purchase, cancel, inform, entertain, and seek connections in an intuitive, personalized way. Customers are ready for these kinds of AI-powered conversations across channels on their mobile devices, and brands are in a high-speed race to provide all of these digital interactions … and more.”
Holiday Traffic
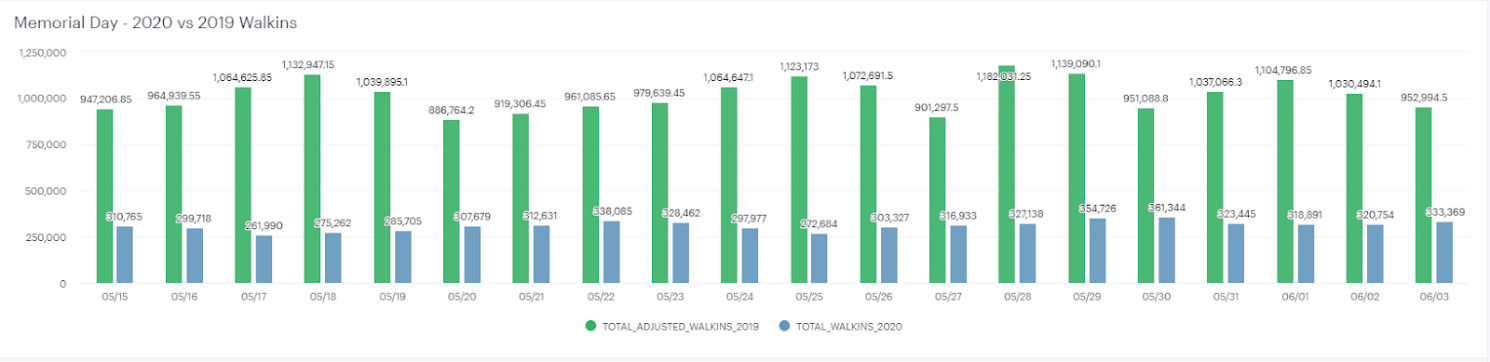
To get a better understanding of how consumers have been behaving during holiday weekends during the pandemic, Zenreach took a closer look at patterns before, during, and after holiday weekends, as well as how they compared to 2019 data.
In analyzing the average walkins for Labor Day, Independence Day and Memorial Day, two interesting holiday weekend trends emerged:
- During all three holidays, the average daily walkins increased the weekend after — 11.6 percent after Memorial Day, 10 percent increase after Independence Day, and 0.2 percent increase after Labor Day.
- For most holiday weekends, the first day of the weekend, Saturday, is actually the highest traffic day.
As one visual example, here’s a closer look at Memorial Day’s 2019 vs. 2020 traffic:
Holiday Expectations
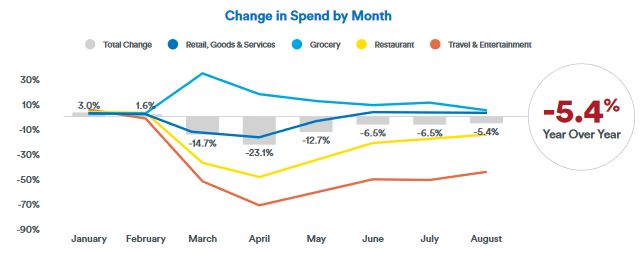
According to Cardlytics’ Eighth State of Spend Report, which analyzed half of all U.S. card swipes, the decrease in in-store foot traffic this holiday may hit restaurants hard. During the 2019 holiday season, in-store shoppers spent an average of $562.39 per customer dining out — 13 full-service, 12 fast causal, and 6 quick-service restaurant purchases.
Cardlytics also found that spend at restaurants this summer saw positive signs of recovery, while grocery spend declined (even though it outpaced 2019 levels as customers continue to prep meals at home). These trends may extend into the holiday season.
Best Cities for Vegans and Vegetarians
WalletHub released its report on 2020’s Best Cities for Vegans & Vegetarians, video above.
To determine the best and cheapest places for following a plant-based diet, WalletHub compared the 100 largest cities across 16 key indicators of vegan- and vegetarian-friendliness. The data set ranges from the share of restaurants serving meatless options to the cost of groceries for vegetarians to salad shops per capita.
|
Top 20 Cities for Vegans & Vegetarians |
|
|
1. Portland, OR |
11. Lexington-Fayette, KY |
|
2. Los Angeles, CA |
12. Tampa, FL |
|
3. San Francisco, CA |
13. San Diego, CA |
|
4. Orlando, FL |
14. Irving, TX |
|
5. Seattle, WA |
15. Atlanta, GA |
|
6. Miami, FL |
16. Lincoln, NE |
|
7. Boise, ID |
17. Chicago, IL |
|
8. Fort Wayne, IN |
18. St. Paul, MN |
|
9. Oakland, CA |
19. Lubbock, TX |
|
10. Austin, TX |
20. New York, NY |
Best vs. Worst
- Scottsdale, Arizona, has the highest share of restaurants serving vegetarian options, 27.76 percent, which is 12 times higher than in Laredo, Texas, the city with the lowest at 2.31 percent.
- Scottsdale, Arizona, has the highest share of restaurants serving vegan options, 16.01 percent, which is 16.7 times higher than in Garland, Texas, the city with the lowest at 0.96 percent.
- San Francisco has the most community-supported agriculture programs (per square root of population), 0.0172, which is 21.5 times more than in San Antonio, the city with the fewest at 0.0008.
- Orlando, Florida, has the most salad shops (per square root of population), 0.2076, which is 16.9 times more than in Garland, Texas, the city with the fewest at 0.0123.
To view the full report, click here.
Best Coffee Cities in America
WalletHub released its report on 2020's Best Coffee Cities in America.
To determine the best local coffee scenes in America, WalletHub compared the 100 largest cities across 12 key indicators of a strong coffee culture. The data set ranges from coffee shops, coffee houses and cafés per capita to the average price per pack of coffee.
|
Top 20 Cities for Coffee Lovers |
|
|
1. Seattle, WA |
11. Minneapolis, MN |
|
2. San Francisco, CA |
12. Orlando, FL |
|
3. Portland, OR |
13. Washington, DC |
|
4. Miami, FL |
14. Boston, MA |
|
5. Tampa, FL |
15. Long Beach, CA |
|
6. Pittsburgh, PA |
16. Los Angeles, CA |
|
7. Honolulu, HI |
17. Irvine, CA |
|
8. Denver, CO |
18. New Orleans, LA |
|
9. Oakland, CA |
19. Austin, TX |
|
10. Atlanta, GA |
20. Jersey City, NJ |
Best vs. Worst
- Miami and Hialeah, Florida, have the lowest average price for a pack of coffee, $3.44, which is 2.4 times lower than in Honolulu, the city with the highest at $8.10.
- Fremont, California, has the highest average annual spending on coffee per household, $236.41, which is 3.7 times higher than in Detroit, the city with the lowest at $63.91.
- Gilbert, Arizona, has the highest share of households that own a single-cup/pod-brewing coffee maker, 25.68 percent, which is 2.9 times higher than in Newark, New Jersey, the city with the lowest at 9.01 percent.
- Orlando, Florida, has the most coffee shops, coffee houses and cafés (per square root of population), 0.4571, which is 7.5 times more than in Laredo, Texas, the city with the fewest at 0.0611.
- Portland, Oregon, has the most coffee and tea manufacturers (per square root of population), 0.0219, which is 43.8 times more than in Riverside and San Bernardino, California, the cities with the fewest at 0.0005.
To view the full report, click here.
The Coffee Capitals of America
With the US a self-confessed coffee-loving nation, a new report by Wren Kitchens has revealed which state craves coffee the most, as well as illustrating which iconic landmarks each state could build with coffee cups through its consumption.
Want to know how your state ranks? Grab a cup and read on…
Oregon crowned coffee capital drinking over 113 Empire State buildings worth of coffee every year!
The Beaver State has been crowned the coffee capital of America, based on its demand and population size.
Consuming more than 624 million cups of coffee per year, if you were to stack up the amount of coffee cups in real life, the West Coast state would drink enough coffee to create 113 Empire State buildings per year.
With Oregonians having such an appetite for their cup of Joe, search data shows that 2.1 percent of the state’s 4.2 million goes online to search for their caffeine fix each month
The second-largest coffee-loving state is Colorado.
With a population of 5.7 million, the state of Colorado drinks 852 million cups of coffee every year! The search data reveals that 1.9 percent of Coloradans head online to look up their nearest coffee spot.
Washington state follows on the list with the third-most online coffee searches, 1.8 percent of the state’s population searching for java each month, and more than 1.1 billion coffees consumed each year.
With three of the top five states having the greatest demand for coffee based on the Pacific, the West Coast is the place they pay homage to the barista. Nowhere more can this be seen than California with the state sipping more than 5.8 billion cups of the steaming beans.
The data was gathered by looking at search volumes against population and the average amount of coffee consumed per person.
What's on Trend in the UK?
Tastewise has released a new report exploring consumer food trends in the UK. The report details the cuisines and ingredients on the rise, potential market opportunities, and more — all backed by the most up-to-
date data available.
Report highlights include:
● Wales reigns as the vegan capital of the UK, with eight percent of references to eating in the land of the daffodil centring on vegan food and beverage.
● The British baked bean breakfast is reinvented during COVID-19 as consumers seek to boost health with green beans, up 112 percent in popularity for breakfast during the pandemic.
● Popularity in CBD fades as L-theanine skyrockets, growing 300 percent as consumers seek out stress-relieving coffee and tea blends during these particularly challenging times.
● Health and fitness motivations draw consumers to sustainable eating more than climate change; sustainable foods are rising 52 percent in popularity YoY, with the movement prioritizing personal health over planetary health.
● Meal kits add flavor to the dreariness of quarantine, replicating experiences from life before the pandemic – interest in kits is up over 200 percent+ each in England, Wales, and Scotland.
● Consumers turn to edible flowers to star in their dishes and on their social media as they crave organic, aesthetic food.
● Korean Gochujang is the new sriracha, bringing the heat and the sweet as the sauce is growing five times faster in popularity across the UK than its Thai rival.