MRM Research Roundup: End-of-May 2021 Edition
21 Min Read By MRM Staff
This edition of MRM Research Roundup features What Feeds Us, top delivery apps, popular drinks and who is winning the chicken wars.
The State of What Feeds Us
Bluedot released the fourth installment of its State of What Feeds Us report which has kept tabs on consumer behavior and restaurant habits throughout the course of the pandemic. Data findings in the series have offered insight into customer expectations to support restaurant brands as they navigate through the health crisis and continue to move forward through the recovery. The latest research, based on a survey of over 1,800 American consumers, was completed last month.
Since the early stages of the health crisis, the State of What Feeds Us has monitored the surge in drive-thru visits and rise in curbside and in-store pickups as consumers sought a safer, more contactless customer experience. Throughout subsequent waves of the pandemic, the reports explored the growth of off-premise strategies including the spike in mobile apps and, more recently, captured softening safety concerns among consumers when they began favoring shorter wait times over safety protocols.
This latest report offers a year in review of shifting consumer restaurant habits precipitated by the pandemic. In addition to the emergence of indoor dining, it explores rising competition between fast food and fast casual restaurant brands with COVID restrictions loosening. The data finds consistent consumer behavior across both restaurant categories signalling the distinctions between fast food and fast casual restaurants are quickly evaporating.
“It remains to be seen if fast casual brands will win back the customers they lost to fast food restaurants this past year,” said Emil Davityan, Bluedot co-founder and CEO. “The data strongly signals long wait times are a vulnerability for fast food restaurants as they compete for customers. Brands that accelerated investments in technology and logistics to deliver faster and more frictionless service during the pandemic are beginning to level the playing field, but now there’s a race to roll out restaurants of the future. It’s the next evolution of personalization, speed and convenience layered with a unique brand experience that will best position restaurants to win market share.”
Highlights from the report include:
Fast Food
Fast food reigns supreme. Fast food far outpaced fast casual and casual dining restaurants by more than 2X in the past month. 45 percent visited fast food restaurants mainly, if not exclusively, over fast casual. Visits to fast food over casual dining restaurants were slightly higher at 47 percent.
Drive-Thrus
Drive-thru visits remain at pandemic levels. Drive-thru visits have increased 36 percent since the early days of the pandemic with 9 out of 10 visiting in the last month. 70 percent visited the drive-thru as often or more often over the past month, an uptick from 68 percent in February.
More money spent at the drive-thru. 35 percent indicated they are most likely to spend more in the drive-thru, followed by restaurant apps (24 percent) and the counter (20 percent).
Order accuracy and speed top list of what consumers want. The vast majority will revisit a specific drive-thru if their order is always correct (68 percent) and service is fast (62 percent).
Curbside
Curbside pickups at fast food restaurants dip. 57 percent utilized curbside pickups in the last month, down from 77 percent in February. 47 percent used curbside pickups as often or more frequently, a sharp decrease from 67 percent in February.
The arrival experience is failing. Of those who want automated check-in upon arrival at curbside, only 32 percent have experienced that capability. Of those who wish to alert staff with a tap of a button, only 23 percent have. When pulling into a curbside space, consumers are still required to call or text (32 percent), flag down staff (7 percent), or walk inside (9 percent) to receive their order.
In-Store Pickups
In-store pickups at fast food restaurants decline. 79 percent used in-store pickups over the last month compared to 89 percent in February. 58 percent used curbside pickups as often or more frequently, a sharp decrease from 67 percent in February.
Fast Casual
Curbside is popular at fast casuals. 60 percent used curbside pickups at fast casual restaurants in the past month, with 48 percent using it as often or more.
Indoor dining reemerges. A whopping 88 percent will dine inside fast casual and fast food restaurants, but there are high expectations for safety protocols including sanitized tables (70 percent), staff wearing masks (69 percent) and/or gloves (51 percent), and limited seating (52 percent).
Lines Blur Between Fast Food and Fast Casual
Drive-thrus wanted. The majority (51 percent) would visit fast casual restaurants more often if they had a drive-thru while 36 percent would visit fast food and fast casual restaurants equally.
Consumers expect to visit fast casuals more in the coming months. 41 percent plan to visit fast casuals and fast food equally and 25 percent plan to visit more fast casuals than fast food.
Speed of Service and Wait Times
Long lines are increasingly a dealbreaker. An overwhelming majority (85 percent) will leave or consider leaving a long line – up from 77 percent in February.
Impatience continues to surge at fast food. Consistent with the previous report, consumers still expect a wait time of under six minutes at the drive-thru, curbside and in-store, down from 10 minutes in August 2020.
Apps are deleted when wait times are too long. While 40 percent download mobile apps to bypass a long line, 48 percent will delete a restaurant’s app if they still have to wait once they’ve arrived.
Fast casuals are given more leeway. Consumers are more forgiving when it comes to curbside wait times at fast casuals. 37 percent expect a wait time of six minutes or less, but 33 percent are willing to wait eight or more minutes.
Casual Dining
Casual dining restaurants will get a boost in the coming months. Consumers plan to visit more casual dining restaurants compared to fast food in the months ahead. 36 percent plan to visit fast food and casual dining restaurants equally while 26 percent plan to visit mainly or all casual dining restaurants.
Safety and sanitation is a priority. Like fast casuals, 88 percent will dine inside casual dining restaurants with similar levels of expectations including sanitized tables (69 percent), staff wearing masks (67 percent) and/or gloves (50 percent), and limited seating (52 percent).
Mobile Apps
Apps are being downloaded for convenience and discounts. Fast and easy (56 percent) ties with coupons and deals (56 percent) for the top reasons consumers download apps followed by earn and track loyalty points (48 percent), easy payment options (43 percent), and to avoid long lines (40 percent).
Restaurant apps are more popular than third-party apps. 68 percent order directly from restaurant apps multiple times a month compared to 42 percent who never order from third-party apps.
Apps are being deleted and redownloaded. 28 percent will delete an app after using it, but 74 percent of those will redownload the app when needed. 39 percent keep restaurant apps on their phone for at least six months, down from 46 percent in February.
Restaurants of the Future
More drive-thru options. 63 percent want designated drive-thru lanes for mobile orders, far outranking other restaurant innovations. 31 percent would revisit a restaurant if it had a dedicated mobile drive-thru lane.
Modern menu boards. 40 percent stated a menu board that confirms their order as a top reason why they revisit a drive-thru.
Advanced personalization. 29 percent stated personalized deals and offers would keep them coming back to a specific drive-thru. In the future, 34 percent want menu boards that display their loyalty points and coupon offers while 24 percent want a menu board that greets them by name and knows their regular order.
Text ordering. 35 percent want the ability to text their order to restaurants.
Smarter arrival. 35 percent would download an app if it meant restaurants knew when they are on their way or have arrived.
The fourth State of What Feeds Us report can be found here. Access the first, second and third reports for additional insights.
On Premise Uplift
Fresh research from CGA highlights the growing popularity of the On Premise on public holidays, and the potential for operator-supplier collaboration.
New research from leading analysts CGA reveals the big uplift in On Premise visits on major U.S. events and celebrations in May—and the opportunities for operators and beverage suppliers to collaborate and maximize sales.
CGA data shows that more than a third (34.4 percent) of adults visited bars, restaurants or similar outlets for Mother’s Day on 9 May. Nearly a quarter (22.7 percent) went to the On Premise to mark Cinco de Mayo on 5 May, and 14.0 percent did so for the Kentucky Derby on 1 May—more than twice the number who did so for the 2019 Derby (6.0 percent).
These visits led to a significant increase in spending, CGA’s research indicates. More than two in five consumers say they spent more on visits for Cinco de Mayo (47.6 percent), the Kentucky Derby (53.1 percent) and Mother’s Day (43.2 percent) than they usually would, with no more than 5.6 percent spending less on any of the occasions. CGA’s CLIP data shows a 67 percent and 9 percent uplift in the value of sales on Mother’s Day and Cinco de Mayo respectively, though sales on Kentucky Derby day were flat.
CGA’s data also reveals:
- Local restaurants, neighborhood bars and casual dining chains were the three most popular destinations for the occasions
- Beer was the top selling beverage around the Kentucky Derby, while wine was most popular on Mother’s Day and tequila ranked second on Cinco de Mayo
- On all occasions, young adults were more likely to increase their spend than older consumers.
As COVID-19 restrictions ease, seating capacity increases and vaccines continue to roll out, many consumers are likely to be in celebratory mood and eager to mark big events. Forthcoming opportunities include Father’s Day on 20 June and Labor Day on 6 September. CGA’s CLIP data from 2019 shows that Father’s Day generated a 54 percent increase in sales by value, while Labor Day and Memorial Day recorded 27 percent and 15 percent growth respectively. Independence Day on 4 July had little impact on sales in 2019.
CGA’s consumer research has signs that sizeable numbers will be looking to the On Premise to mark events like these in 2021. Nearly a fifth of consumers are planning to celebrate Independence Day (18.4 percent) in bars or restaurants, and nearly a quarter (23.5 percent) of Labor Day celebrants plan to do so. Between 14 percent and 16 percent of those marking the occasions will do so on vacation, during which they may be likely to visit bars and restaurants.
“After months of restrictions, many consumers are ready to celebrate US public holidays and events in a big way in 2021,” said Alexandra Martin, Operator and Analytics Director at CGA. “On Premise operators and beverage brands have a great opportunity to capitalize on pent-up demand and position themselves at the heart of big occasions. To do so, they will need a deep understanding of consumers’ habits and preferences on elements like locations and beverages, which can vary substantially from occasion to occasion and place to place.”
CGA’s consumer research reveals what restaurant and bar operators and beverage suppliers can do to increase the appeal of the On Premise around big events. Two in five (39.9 percent) consumers say they would be encouraged to visit by special offers on drinks, and more than a quarter would be attracted by drink offers (32.7 percent), special events (31.6 percent) or live entertainment (27.0 percent).
Franchise Operations Index
FranConnect released its inaugural Franchise Operations Index Report, a comprehensive analysis of the ever-evolving role of franchise business consultants. In the 2021 report, FranConnected analyzed over 165K FBC interactions between Jan. 1, 2019 to Dec. 31, 2020 to help franchisors understand the impact of COVID-19 on franchise operations teams.
Among the highlights:
- Franchisor-driven evaluations increased 9.4 percent in 2020 as brands shifted to more frequent, virtual interactions focused on ensuring franchisees were weathering the storm rather than the traditional compliance audit.
- The number of self-assessments more than tripled in 2020, as franchisors more heavily relied on them as the pandemic persisted.
- Unscored audits increased by 29 percent in 2020, which had been a growing trend even in pre-pandemic times.
- Evaluation strategies have clearly shifted, with a majority of brands now using a combination of scored audits, unscored audits, and self-assessments.
- The pandemic increased franchisee business consultants’ span of control by over 21 percent, with each coaching an average of 34 units in 2020. This was primarily due to downsizing and furloughs, as well as franchise business consultants’ ability to oversee more units because they were not spending time traveling.
Order & Delivery Report
Paytronix Systems, Inc. published the Paytronix Annual Order & Delivery Report: 2021, which finds that sales generated through digital ordering platforms more than tripled after the onset of the pandemic, and most of those came from people who had never interacted with the brand previously. The annual Paytronix report examines industry trends across the digital ordering landscape, from enterprise brands to independent restaurants, in sales, guest experience and retention, and fulfillment method.
Download the report here
Some key insights from this year’s report include:
- Sales generated through digital ordering platforms grew more than 3x after the onset of the pandemic.
- A significant portion of the guests responsible for this increase in online ordering were entirely new to the brand, having never ordered online or in-store before.
- Many of the brands that weathered the pandemic well benefitted from the closure of what the National Restaurant Association estimates was 110,000 eating and drinking establishments. These closures presented the surviving brands with the opportunity to acquire new guests.
- Guests who place orders for delivery spend, on average, 10 percent more than guests who place orders for takeout, even before factoring in taxes or delivery fees.
- Brand value means more than food quality. Guests who rated their food at 1 star were 27 percent likely to return, while those who gave the restaurant’s value 1 star were only 20 percent likely to return.
“What we’re seeing in the online ordering and delivery market is a complete change in how guests interact with their brands. In fact, the pandemic presented brands with an opportunity build stronger guest engagement and then continue by providing a great guest experience,” said Andrew Robbins, CEO of Paytronix Systems, Inc. “The brands that will succeed in the future are those who can bridge the gap between off-premises order and delivery, and on-premises dining. Those brands will understand how to offer a great band experience, no matter how the guest chooses to interact.”
The report provides an in-depth look at these and other macro trends in the online ordering landscape in 2020, including online sales, tips, reviews, and fulfillment (takeout or delivery).
Delivery App Use on the Rise
New analysis from App Annie (mobile data and analytics provider) that reveals food and grocery delivery app use is still on the rise, despite the resurgence of indoor dining.
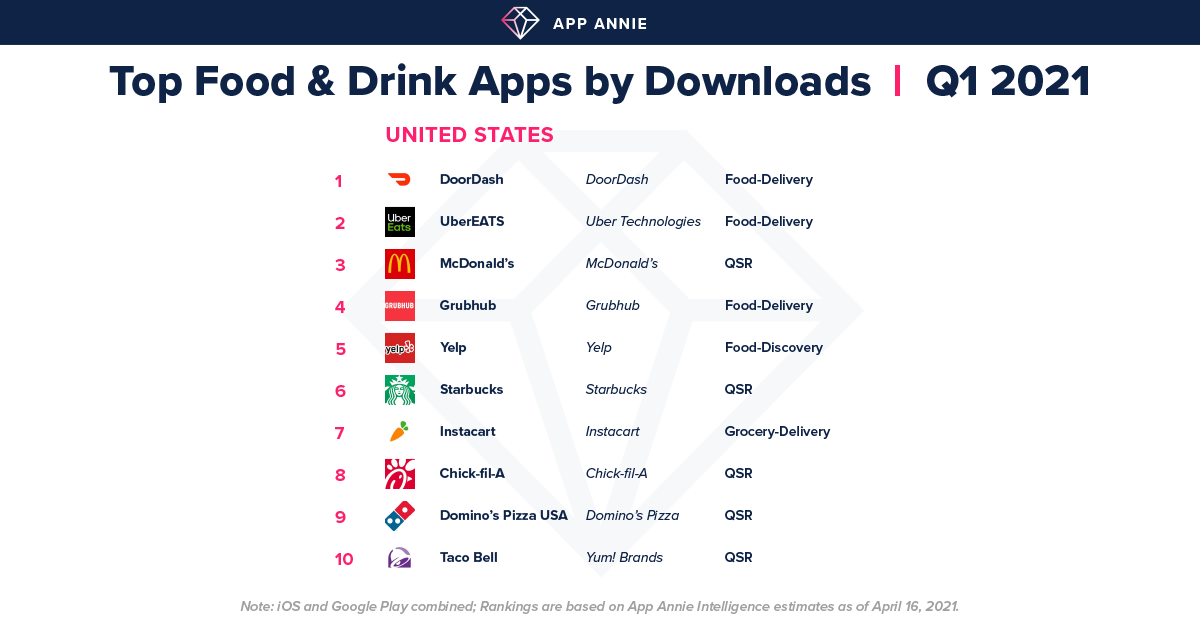
DoorDash ranked #1 among food and drink apps in April 2021 in the US and received 2.1 million new downloads, a continuation of their #1 ranking in Q1 2021 by downloads in the US. Other findings include:
Consumers who enjoy the convenience of a weeknight dinner delivered right to their front doors, also enjoy the efficiency of grocery deliveries.
In fact, 10 percent of US DoorDash users on iPhones also used Instacart: Grocery deliveries in April 2021.
Additionally, Walmart InHome Delivery has consistently ranked in the top 200 food and drink apps by daily iPhone downloads during the pandemic.
A mix of grocery delivery, food delivery and QSR apps top the downloads charts in China, Japan and South Korea.
KURASHIRU, a cooking app ranked #3 by Food and Drink downloads in Japan in Q1 2021, ahead of any fast food app.
Go Local?
A new report from the Institute for Local Self-Reliance spotlights 20 local restaurant delivery businesses and explains why these independent businesses are a better alternative to the big national delivery apps like Grubhub, DoorDash, and Uber Eats/
Dozens of locally based alternatives to the big, Wall Street-backed third-party delivery apps have popped up during the pandemic, proving that restaurant meal delivery can be done in a way that supports locally owned restaurants and builds local wealth.
“The economics of the big apps make no sense; they continue to post huge losses, while their predatory policies and exorbitant fees are literally killing tens of thousands of local restaurants,” said Kennedy Smith, a Senior Researcher with ILSR and the report’s author. “The only things DoorDash, Grubhub, Postmates, and UberEats have on their side are financial backing from Wall Street and a regulatory environment that tilts the playing field in their favor. The local delivery businesses in this report are demonstrating a better, more sustainable model that puts money back into restaurants and back into the community.”
“The big apps offer no real economies of scale,” Smith continued. “They present themselves as innovators, but the business really just involves people driving food orders to customers’ homes — an inherently local, labor-intensive service. And because local delivery services don’t have to repay venture capital or meet stockholder’s revenue expectations, they can provide this service to restaurants and their customers for less.”
The independent entrepreneurs profiled in the report, Special Delivery, are building viable businesses — all while charging restaurants less, paying their drivers more, and avoiding deceptive and predatory tactics. As an owner-worker at one of the businesses says in the report, “the whole goal is to put the money back into our pockets, back into restaurant pockets, back into the community.”
Rather than a cookie-cutter approach, the local delivery services profiled in the report customize their operations to fit their community’s needs. Some are cooperatively owned, either by restaurants or delivery drivers. Some deliver items from local stores as well as restaurant meals. While all have much lower fees than the dominant apps, some earn income on both the customer and restaurant sides of the ledger, while others only charge customers. Lexington, Kentucky’s Delivery Co-op, for example, is owned by local restaurants and drivers, while Slurpalicious in Astoria, Ore., charges restaurants almost nothing, relying instead on customers, who pay seven percent of the tab, plus 60 cents per mile, round-trip.
The pushback against big delivery apps is part of a growing grassroots movement fighting back against excessive corporate control of our local economies. As with federal efforts to rein in Amazon and other large Big Tech companies, there is an increased appetite for new federal, state, and local policies to combat monopoly power. This report includes a series of recommendations to help local meal-delivery businesses thrive, including capping third-party delivery fees, prohibiting predatory activity, and providing capital for the local delivery businesses.
The full report is available here.
How Consumers are Engaging with Tech
Mobiquity released results of a new Restaurant and Convenience Store Digital Impact Report. This new study explores how consumers are engaging with technology in restaurants and convenience stores as well as how this engagement affects loyalty, order frequency, and in-store or in-restaurant traffic. Mobiquity surveyed nearly 1,300 consumers across the U.S. who are 18 years of age or older in order to gain insight into their current digital habits when it comes to ordering food, how these habits may change moving forward, and what digital experiences still need improving. Findings include that younger people have increased their digital engagement frequency the most in the past year, presenting the biggest opportunity for restaurants and convenience stores to utilize digital offerings that cater to this growing audience, encourage more occasions and ultimately earn their long-term business.
According to Mobiquity’s findings, the majority of consumers surveyed reported an increase in mobile and online ordering as well as the utilization of curbside services in the past year. This is especially true among digital native generations, with younger customers nearly three times as likely to use mobile apps than those 56+. Because of this growing mobile usage, younger consumers are creating digital habits and developing strong preferences for brands that meet their needs.
Along the same lines, 63 percent of consumers aged 25-40 will frequent a restaurant or convenience store that has digital offerings more often than ones that do not. Additionally, 44 percent of consumers in this age group have changed where they order food from because their usual place had subpar digital offerings. With over 70 percent of consumers aged 18-55 stating that they are likely to increase how often they order from a store if their mobile app is easy to use, restaurants and convenience stores may want to consider an overhaul of their outdated apps before it is too late.
“Restaurant and convenience store customers have rapidly adopted digital tools over the last year in order to safely interact with their preferred brands,” said Britt Mills, Senior Director, Customer Experience at Mobiquity. “It comes as no surprise that younger generations of customers are more comfortable using mobile apps to order food. Our Restaurant and Convenience Store Digital Impact Report revealed that these consumers have built digital habits that will remain even as restrictions ease. It’s vital for restaurants and convenience stores to meet and exceed expectations when it comes to mobile apps to cement long-term consumer loyalty as competition grows.”
Additional findings of Mobiquity’s Restaurant and Convenience Store Digital Impact Report include:
- Digital ordering promotes customer loyalty: When it comes to continuing to order from a particular restaurant or convenience store, 82 percent of respondents agree that having an easy-to-use website is important, and 76 percent agree that an easy-to-use mobile app is crucial.
- Customers will switch allegiance for better rewards: Fifty-two percent of respondents aged 25-40 changed where they order food from because another store had a better loyalty or rewards program.
- Current apps are not quite meeting expectations: Of the consumers surveyed, 71 percent were satisfied with delivery mobile apps, such as DoorDash, GrubHub, and UberEats. Seventy percent were satisfied with restaurants’ apps, 61 percent were satisfied with coffee shops’ apps, but only 53 percent were satisfied with convenience stores’ mobile offerings.
- Contactless fueling could lead to increased C-Store visits: Among the 25-55 age demographic, the majority of consumers would visit a particular convenience store more if it offered them the ability to completely contactlessly fuel their car using a mobile phone (over 50 percent) as well as if they could earn fuel discounts via a mobile rewards program (over 70 percent).
- Income has an impact on order frequency: Those in the lowest income bracket ($50k or less) are most likely to use an app to order food and be frequent users, making about 56 visits a year. That’s compared to consumers who earn over $100k per year who make about 36 visits in the same timeframe.
The full Restaurant and Convenience Store Digital Impact Report is available here.
South Florida Recovery on the Way
According to a new survey released by Florida’s business law firm, Berger Singerman, the hospitality and tourism industries, both constant and key economic drivers for South Florida counties and the state over the last two decades, are expected to recover from the COVID-19 pandemic related interruptions in 2021. The survey, however, which garnered more than 8,000 respondents, also revealed that the recovery of the cruise ship industry remains halted and therefore will continue to interfere with the recovery of hospitality industry.
Results from the firm’s 2021 Hospitality Survey reveal that most respondents (47 percent) have and plan to take one to three leisure trips during the 2021 calendar year. Yet 24 percent will not be booking any sort of travel during the year.
“While still staying cautious, people are already gradually resuming travel, seeking to rediscover the places and people they haven’t been able to see,” said Iryna Ivashchuk, a partner at Berger Singerman. “As a result of the pandemic, I think we all have reevaluated the importance of travel in our lives and recognized how central it is to our mental health and well-being.”
50 percent of respondents are optimistic about the recovery of the hospitality industry in South Florida and 24 percent of respondents somewhat agree. Only a mere 26 percent of respondents do not believe the industry will recover this year.
“Even though the hospitality industry will need to adapt to new rules and standards, which will continue to influence our behavior as consumers, it is not surprising that future hospitality trends are overwhelmingly positive,” said Ivashchuk.
Another concern revealed in the survey is the timeline of expected disruption to the hospitality industry. The majority of respondents agree that disruptions are likely to last from 12-24 months to subside. While 39 percent remain optimistic in expecting disruptions to last only six months to a year.
“Expectations on the timeline of the disruption to the hospitality industry are at times biased, the pandemic has changed the way people live at large for more than a year,” said Marc Shuster a partner at Berger Singerman. “Although disruptions may spill into 2022, these will lessen and lessen through time with vaccine rollouts and loosening of local government mandates in respective to COVID-19 response”
Restaurants and hotels were chosen as the hospitality sector expected to recover the quickest in 2021, followed by air travel, nightlife, and cruise ships respectively
“The positive trends in the restaurant and hotel industries are a testament to the creativity of the industry leaders who continue to adapt in response to the changing customer behavior and demand”, said Ivashchuk. “In the COVID era, the key part of hospitality management is finding innovative new ways to impress customers who are seeking unique experiences while placing safety, convenience, and comfort at the forefront of their minds”.
The survey, conducted by Berger Singerman during April-May 2021, polled more than 8,000 professionals in South Florida’s hospitality industry.
QSR Foot-Traffic Review
The latest report by foot traffic analytics firm Placer.ai, titled QSR Review, finds that fast-food chains and quick-service restaurants (QSRs) are still in something of a food coma from the pandemic — with the glaring exception of one chain. The report — which analyzes foot traffic data from the past few months from restaurant chains including McDonald’s, Burger King, Chick-fil-A, Popeyes, KFC, and Wendy’s — says that the value offered by these chains has the sector situated to persevere despite tough economic conditions, but with business restrictions and ongoing issues related to the pandemic, many stores have had it rough. Things are improving, however, and in the case of one of the aforementioned chains, almost couldn’t be better.
And while there is one QSR to rule them all currently, the sector could see another shake-up in the coming weeks as Burger King has announced plans to enter the ongoing chicken sandwich wars with the new “Ch’King” menu offering.
The full report can be found here.
Report highlights:
- The comeback is on: Foot traffic numbers are down, but improving on a monthly basis (compared to 2019) at most chains in the report. For April, visits were down 13.1 percent at McDonald’s, 11.7 percent at Burger King, 13.7 percent at Chick-fil-A, 8.4 percent at KFC, and 12.3 percent at Wendy’s.
- Ready for recovery: With most chains still seeing a depressed number of visits, there’s reason to think that a foot traffic boom may be on the way, the report says. That’s because high-population states like California and New York are on the verge of “reopening,” which could unleash more customers, and pent-up demand, into the QSR sector.
- Eat your spinach: The big winner in the report is Popeyes, which is seeing incredible foot traffic numbers compared to 2019. Visits to Popeyes were up 25.5 percent in April, 24.6 percent in March, 12.6 percent in February, and 20.9 percent in January — while every other chain in the report saw significant drops in visits compared to 2019 during those same months.
The Chicken Wars
Fresh data about the super competitive 'Chicken sandwich wars' which most fast food restaurants are participating in now comes from ecommerce research company Edison Trends:
Key Takeaways:
- Chick-Fil-A took in 41 percent of the money spent on chicken sandwiches through food delivery apps (among top 8 brands)
- McDonald's was second with 27 percent, riding their debut of three new chicken sandwiches in late February. Popeye's took 12 percent, and Wendy's 6 percent. The final four were KFC with 5 percent, Jack in the Box with 4 percent, Burger King with 3 percent and Zaxby's with 2 percent.
This analysis was performed on over 120,000 transactions from 16 food delivery services.
The Most Satisfying Fries
Premise, a global data collection network, tasked 100 contributors across the country with the search to find the best french fry (spoiler alert, it is not McDonald's).
So, who offers the french fries with the most satisfying french fry? Of these 10 fast-food chains (Arby’s, Burger King, Chick-fil-A, Five Guys, Hardee’s, In-N-Out, McDonald’s, Popeyes and Wendy’s), these three offer most satisfying french fries:
- Chick-fil-A
- Arby’s
- Shake Shack
Not only is Chick-fil-A the french fry with the most satisfying taste, but it is also the most affordable, averaging $1.99 for a medium fry. They also asked 100 of our contributors what they look for in their fries:
- 60 percent say the taste is the most important factor
- 21 percent say the temperature is the most important
- 16 percent say the texture
- 2 percent say the price
- 1 percent say other factors make a truly satisfying fry
See the in-depth findings here.
What We're Drinking
According to Influence Central, alcohol brands have found themselves in an interesting spot- especially due to covid.
Only 26 percent of consumers share that they’re consuming even more alcoholic beverages at home now than they were before. But drinks abound even if at typical consumption levels.
Among all consumers when it comes to drinking choices, wine tops the list of drink choices, with cocktails and beer rounding up the top three:
- 43 percent turn to red wine
- 38 percent prefer white wine
- 37 percent are mixing up cocktails, while 18 percent prefer hard alcohol straight up or on the rocks.
- 31 percent drink beer
- 94 percent have not utilized any of the home delivery services for alcoholic beverages yet and are still going in-store for their alcohol purchases.
- Of those who are utilizing home delivery services for alcoholic beverages, 65 percent have only just recently started turning to these services.
And here's some stats when it comes to dining…
In-Person Dining … 27 percent are uncomfortable doing it all; 30 percent will do it as needed (less than once a month); 26 percent will do it infrequently (1-2 times a month); 16 percent will do it frequently (1-2 times a week)
In-Store Grocery Shopping… 3 percent are uncomfortable doing it all; 21 percent will do it as needed (less than once a month); 26 percent will do it infrequently (1-2 times a month); 50 percent will do it frequently (1-2 times a week)
Evolving Grocery Shopping Habits
For the past four decades, FMI—The Food Industry Association has tracked the grocery shopping habits of U.S. customers through the U.S. Grocery Shopper Trends report. The 2021 edition, prepared in partnership with The Hartman Group, explores how the future of food retail will be colored by the pandemic – driven by shifts in the way consumers purchase groceries.
“Throughout this past year, American grocery consumers have developed a deeper relationship with their kitchens, increased their healthy eating consciousness, and have learned new ways to shop,” FMI President and CEO Leslie Sarasin said. “We see shoppers engaging in more stock-up trips to support their at-home cooking, exercising new online shopping skills, and letting their personal concept of being well impact their food and shopping behaviors. Looking ahead, we expect many of these trends to continue.”
U.S. Grocery Shopper Trends 2021 identifies three major focus areas:
The Era of At-Home Meals
Today, 58 percent of shoppers report eating more at home and nearly half (49 percent) report cooking or preparing their own meals more than before the pandemic. When it comes to grocery shopping to support these at-home meals, shoppers have a newfound appreciation for the task, with 42 percent saying they like or love to grocery shop.
Ecommerce and Grocery Shopping
The number of online grocery shoppers grew to nearly two-thirds (64 percent) of all U.S. adults, with newcomers from every generation. Frequency of online grocery shopping also increased, with more than one-fourth (29 percent) of online shoppers placing a weekly order. For the first time, we saw many more online grocery shoppers now consider a Mass retailer to be their primary store.
The Concept of Being Well Evolves
Today, shoppers’ concept of being well involves an interlocking, circular relationship among the domains of shopping, cooking and eating and this phenomenon helps us understand shoppers’ engagement with the evolving retail landscape.
FMI has created an online experience at www.FMI.org/GroceryTrends that shares shoppers’ insights on being well in their own words.
Popular Cocktails on TikTok
Brewsmartly.com trawled through TikTok to find the most popular cocktails and ranked them accordingly.
Top 10 Popular Cocktail Recipes on TikTok
|
Rank |
Cocktail |
Number of Hashtags on TikTok |
|
1. |
Margarita |
361 Million |
|
2. |
Jungle Juice |
232.3 Million |
|
3. |
Mojito |
218.1 Million |
|
4. |
Mimosa |
210.7 Million |
|
5. |
Pina Colada |
73.8 Million |
|
6. |
Sangria |
68 Million |
|
7. |
Tequila Sunrise |
28.8 Million |
|
8. |
Daiquiri |
21.3 Million |
|
9. |
Moscow Mule |
20.3 Million |
|
10. |
Espresso Martini |
12 Million |
Brewsmartly.com can reveal that the most popular cocktail on TikTok is the Margarita, with 361 million hashtags. The classic Margarita contains Tequila, lime juice, and Triple Sec, however there are a variety of modern takes on the original recipe on the social media platform, such as, the spicy margarita.
The Spicy Margarita contains one extra spicy ingredient – Jalapeño simple syrup. This recipe garnishes the rim of the cocktail glass with a mild chilli powder for an extra kick.
The second most popular cocktail is Jungle Juice with 232.3 million hashtags on TikTok. Jungle Juice is a modern cocktail and the most common elements used in this trend are punnets of fruit, candied sweets, fruit punch mixes and an alcohol base such as Vodka or Gin.
In third place, the Mojito with 218.1 million hashtags on TikTok. Another classic cocktail, the mojito is made with a white rum base, lime juice, soda water and mint leaves. The recipes found on TikTok don’t stray too far from the original, only adding fruits such as berries and orange.
The Moscow Mule is the ninth most popular cocktail on TikTok with 20.3 million hashtags. This cocktail is traditionally made with Vodka, ginger beer, ginger bitters and lime. A popular TikTok approach swaps out the ginger beer for Lemon Ginger Tea.
Completing the top ten are Espresso Martini’s with 12 million TikTok hashtags. This timeless cocktails’ ingredients are Vodka, Kahlua and brewed espresso coffee with coffee beans to garnish.
However, the mixologists of TikTok created the Lemon Drop Martini, replacing Kahlua with Triple Sec and Coffee with lemon juice. As well as the intriguing Sake Martini. Sake is used in place of coffee and the Kahlua is removed entirely, it is garnished with an olive and a strip of pickled ginger.