
MRM Research Roundup: End-of-July 2021 Edition
13 Min Read
The edition of MRM Research Roundup features restaurant payment transaction data, foodservice equipment purchasing and the lasting appeal of chicken sandwiches.
Rent Struggle Is Real
Alignable’s July Rent Report has just been released, based on a poll of 5,911 small business owners that concluded last week. While there are some nice signs that the recovery is having a positive impact on rent payments, there are also many other indications that rent continues to be a major struggle for many small business owners in the U.S.
Here’s are some highlights:
- 40 percent of restaurants could not pay full rent in July, showing the extended effects of labor shortages and inflation on this industry. Times are even tougher for 64 percent of nonprofits, 50 percent of entertainers/artists, 48 percent of small businesses in the transportation sector, and 43 percent of event planners.
- 35 percent of ALL small businesses in the U.S. could not pay their July rent in full or on time (that’s slightly better than June, which was 37 percent).
- 52 percent of minority-owned small businesses still could not afford their rent in July. And 37 percent of women-owned businesses are in the same predicament, but only 23 percent of veteran-owned businesses are struggling with rent.
- With the Eviction Moratorium coming to an end on July 31st, worries are escalating about the small business owners who still can’t cover monthly rent payments and/or have back rent to pay.
- Some states are still facing challenges when it comes to small businesses paying rent in full — 46 percent of SMBs in Georgia couldn’t pay July rent, and the same goes for 41 percent of small businesses in New York and Massachusetts.
- Other states are in better shape right now, including FL (27 percent), VA (25 percent) and WA (18 percent).
To see the full Alignable July Rent Report, click here.
Transaction Volume Increase
TableSafe, Inc., shared insight into customer payment transaction data indicating that the recovery of the full-service restaurant industry continued in the second quarter of 2021. TableSafe’s data, gathered from full-service restaurants across the United States, reveals that customer transaction volume increased 47 percent over the first quarter of 2021. Additionally, transaction revenue increased 55 percent from the first quarter of the year.
“Even though many states are still working towards being fully re-opened, our data illustrate that full-service restaurants are seeing a steady recovery,” said Gordon Gardiner, CEO of TableSafe. “We’re seeing restaurants making dramatic increases in both transaction revenue and volume, indicating a slow climb back to pre-pandemic levels.”
TableSafe’s data align with a recent report from the National Restaurant Association stating that sales at eating and drinking places escalated in June, with total sales reaching $70.6 billion on a seasonally-adjusted basis – the highest level since February 2020.
“While the recovery is still a work in progress, these numbers are very encouraging for the industry,” Gardiner said. “Our customers are getting back on their feet, and we’re proud to be playing a role by helping them provide a superior dining experience that brings people back.”
On Premise Impact Report
The latest BeverageTrak data from CGA’s COVID-19 On Premise Impact Report reveals On Premise velocity in outlets currently trading is +72 percent higher than the same time last year in the week to July 24. The comparable week in 2020 (to July 25), while in recovery compared to the height of restrictions, was still lower than the same week in 2019.
Total U.S.
Across all states, value velocity remains strongly positive compared to last year, with all key states now ahead of 2019
Average outlet $ sales (velocity) trends are slightly positive (+1 percent) in the latest week (July 24 vs July 17) across the average U.S. outlet, following growth of +6 percent the previous week
100 percent of states have bars and restaurants open indoors completely (with no capacity restrictions in place)
Florida
While performances within the key cities in Florida has been variable, strong growth in Tampa (+12 percent) in the week to July 17 and in Miami (+6 percent) and Orlando (+5 percent) in the latest week has resulted in positive trends for the state as a whole (+1 percent)
Sales velocity is now +34 percent vs July 27, 2019
Sales velocity is now +82 percent year-over-year (comparing the same week one year prior)
Sales velocity is now +1 percent vs July 17 2021
Illinois
Illinois has seen similar patterns of growth, with +9 percent and +2 percent over the latest two weeks, although in this case trends in Chicago (+6 percent and +1 percent) were outperformed by the rest of the state
Sales velocity is now +10 percent vs July 27 2019
Sales velocity is now +74 percent year-over-year (comparing the same week one year prior)
Sales velocity is now +2 percent vs July 17, 2021
California
In California, strong performance in Los Angeles in the week to July 17 (+13 percent) and in San Francisco in the week to July 24 (+8 percent) result in positive trends for the overall state, with 2 percent growth in the latest week
Sales velocity is now +30 percent vs July 27 2019
Sales velocity is now +108 percent year-over-year (comparing the same week one year prior)
Sales velocity is now +2 percent vs July 17, 2021
New York
New York has experienced growth in the last two weeks (+11 percent to July 17 and +3 percent to July 24), driven by strong performances in NYC (+19 percent and +4 percent respectively)
Sales velocity is now +7 percent vs July 27 2019
Sales velocity is now +104 percent year-over-year (comparing the same week one year prior)
Sales velocity is now +3 percent vs July 17, 2021
Texas
Although flat in the latest week, consistent growth across all key cities in the week to July 17 lead to +7 percent growth for Texas, giving it the strongest performance vs 2019 of all key states (+37 percent) in the latest week
Sales velocity is now +37 percent vs July 27 2019
Sales velocity is now +6 percent year-over-year (comparing the same week one year prior)
Sales velocity is now 0 percent vs July 17, 2021
Matthew Crompton, CGA Client Solutions Director, Americas, said: “It’s really encouraging to see all states’ value velocity remaining positive and head of 2019 levels for the first time this year. With bars and restaurants fully open for indoor service with no restrictions across the country, and visitation remaining strong over recent weeks, it presents suppliers and operators with a valuable opportunity to keep engaging consumers, leverage tailored food and beverage offers and maximize spend opportunities.”
How are Consumers Feeling?
Vericast released proprietary data from its Valassis line of business, providing a snapshot into how American consumers are feeling and behaving as COVID-19 restrictions ease. The 2021 Consumer Intel Report, which is based on responses from over 1,000 U.S. adults, indicates that while consumers’ habits, perceptions and expectations have changed, there is an opportunity to capitalize on their desire to return to “normal,” but with cautious optimism.
As marketers look to align with this new paradigm, they must understand and cater to consumers’ current sentiment. For example, the survey findings point to the rise of a more conscious consumer — with 52 percent of respondents saying it is important that the brands they purchase from have values aligning with their own. In addition, 72 percent of millennial parents are more likely to be loyal to a brand or store that shares its efforts to be environmentally responsible or has sustainable or ethical business practices. Sustainability is worth a financial commitment for some — 63 percent of millennials are willing to pay more for sustainable products.
The in-store experience is going to become more critical than ever as consumers are eager to return and engage more closely with the brands they buy from. Shopping indoors performed better than most other indoor activities in terms of comfort level among respondents (49 percent said they are comfortable). The survey also found that 74 percent of consumers prefer to buy products that they need to smell, touch or feel in-store. Retailers can capitalize on this behavior with more seamless experiences and well-timed discounts.
In 2020, while online shopping increased significantly across food, household goods and health and beauty care products, it has nearly gone back to 2019 levels across these categories. For example, our survey found that 18 percent of consumers said they do all their food shopping online compared to 29 percent indicating this in 2020. At the same time, the shift to online shopping — largely driven by the pandemic — did generate first-time online shoppers, creating new opportunities for brands.
“There is a clear willingness among consumers to return to pre-pandemic activities, albeit tempered with some caution,” said Sarah O’Grady, Vice President of Brand Marketing at Vericast. “The challenge for brands now is to respect the caution while galvanizing action. With our survey results in mind, there are four definitive ways for marketers to generate authentic customer engagement: use messaging that conveys forward momentum, promote health and safety measures, demonstrate a social conscience and take advantage of in-store retail with promotions and experiences.”
Additional key takeaways from the report include:
- Saving is still king
- 72 percent of consumers said they increased their saving behaviors during COVID and 82 percent of those people told us they anticipate those behaviors to continue over the next year.
- The majority (82 percent) of respondents said the most important thing when shopping for grocery products is to save the most money by going to a store with the lowest price.
- Over half (52 percent) of consumers said a sale will drive an impulse purchase.
- Affluent shoppers get excited by coupons, too: 79 percent said they use coupons when planning their shopping and the same percentage said it’s exciting to discover a discount on a product they were already planning to buy. Most use both paper and digital coupons/discounts and 64 percent say coupons/discounts speed up their decision to purchase.
- Familiarity, trust and authenticity matter
- Following a period of uncertainty, consumers are now seeking out stability and familiarity. In fact, 67 percent said they prefer a brand or store that provides a consistent experience.
- 56 percent said they typically purchase from brands they’re familiar with because of their brand communications.
- Housing boom creates opportunity
- 75 percent of millennial parents, 73 percent of parents and 69 percent of millennials have purchased home comfort items within the last six months with more than half (52 percent) of all consumers intending to make a purchase in the next six months.
- 63 percent of millennial parents, 59 percent of parents and 55 percent of millennials said they’re spending more time and/or money improving their home.
- Restaurants must adapt
- There is a degree of caution about returning to restaurants with 61 percent of parents, 60 percent of millennial parents and 55 percent of millennials comfortable dining outside.
- 63 percent of consumers say they are more comfortable ordering carryout or delivery than dining inside at a restaurant.
Foodservice Equipment Purchasing Up
Purchasing activity and financing approval rates in the foodservice equipment industry are rebounding at a rapid pace, evidence that restaurants are staging a strong comeback from the Covid-19 pandemic, according to data released this month by KWIPPED Inc.
“Our tech supports equipment rentals, purchases and financing for hundreds of restaurant and foodservice equipment sellers, and we work with a large network of equipment finance companies, so our data offers a comprehensive perspective of macro and micro trends in the foodservice equipment market,” explained Travis Sherbine, KWIPPED’s Chief Growth Officer.
The following trends are based on more than 8,000 foodservice equipment requests for quotes (RFQs) over the past two years:
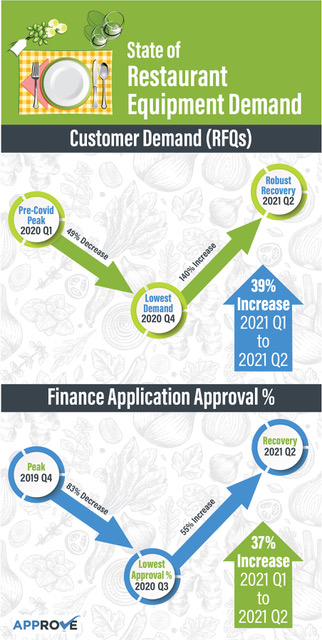
Demand for foodservice equipment (measured in RFQs) dropped drastically during restaurant shutdowns caused by the Covid-19 pandemic but has bounced back in 2021. KWIPPED’s data shows:
● RFQs decreased by 49 percent over the period running from just prior to the onset of the pandemic in Q1 of 2020 to Q4 2020, when they reached their lowest level.
● From that 2020 low point to Q2 2021, KWIPPED’s marketplace data shows a 140 percent increase in RFQs for foodservice equipment, indicating a strong rebound in the industry.
● Momentum has been strong in 2021, as KWIPPED data shows a 39 percent increase in RFQs from Q1 2021 to the present (Q2 2021).
Specific equipment categories experiencing the largest recovery numbers include commercial refrigeration, beverage machines and mobile equipment that can support outdoor service and events such as mobile cold storage units and food trucks.
“The mobile equipment category is absolutely exploding due to the reopening of public events like sports, festivals and and concerts,” said Sherbine.
As lenders tightened their approval criteria during the pandemic, restaurant and food service equipment financing virtually disappeared, but the data shows a strong resurgence that continues to trend toward pre-pandemic levels:
● There was a 58 percent decrease in finance application approval rates from Q4 2019 to Q2 2020, when approval rates reached a low point.
● Finance application approval rates increased 76 percent from Q2 2020 to present (Q2 2021).
● Approval rates have increased 37 percent from Q1 2021 to present (Q2 2021).
“All of the finance companies in our lender network have told us they are approaching pre-pandemic approval levels, and our internal data confirms it. Not many industries escaped the negative impacts of Covid-19, but the restaurant and hospitality industries were hit as hard as any other, and it’s really great to see them bouncing back,” Sherbine said. “We feel that leveraging the collective capacities of a network of lenders is a really smart way to optimize approvals and ensure restaurants and foodservice businesses are getting the lowest possible rates—and we consider it a privilege to help the industry recover.”
Chicken Is Hot and McDonald's Recovers
QSR are back with a vengeance – or rather, with their chicken sandwiches. The newest report by foot traffic analytics firm Placer.ai titled “Placer Bytes: RBI, Chick-fil-A and GameStop” dove into the data for two of Restaurant Brands International’s top brands – Popeyes and Burger King. One of them has almost completed its recovery, the other one has seen “tremendous growth”, as the report states.
Report highlights:
Cluck, cluck, here comes the cash:
Burger King’s decision to join the ongoing Chicken Wars has paid off in a big way — the fast-food giant’s recovery is almost complete. During the week of July 12th, 2021, visits were down only 4.5 percent compared to the same period two years ago — a tremendous improvement after being down almost 18 percent during the week of April 19th this year.
Decrowning the king:
But the true king of chicken is still Popeyes — the Louisiana-born fast-food chain has cooked up not only a recovery but some serious visit growth. From the report: “Looking at the weeks beginning June 28th, July 5th and July 12th showed visits up 9.5 percent, 11.6 percent and 22.6 percent compared to the equivalent weeks in 2019, respectively”
It’s a chicken craze:
There’s seemingly no end to Popeyes’ continued success, and Placer.ai credits the brand’s launch of its Chicken sandwich in August 2019. The chain has enjoyed an average weekly visit increase of 16 percent from the week of April 19th to the week of July 12th, 2021 (Yo2Y), with foot traffic growing more and more each week.
Another new report by foot traffic analytics firm Placer.ai, titled “The McDonald’s Recovery Continues,” shows that the fast-food giant is on course for a full recovery from the pandemic, despite lingering effects still disrupting many Americans’ routines. Foot traffic has stabilized and is approaching pre-pandemic levels, per the report, and as of the week of July 12th, has actually surpassed those levels. In other words, McDonald’s is back, and is reclaiming its status as the QSR sector’s Big Mac.
Report highlights:
Completing the comeback:
On a monthly level, McDonald’s visits have slowly inched up. In June, they were down 11.1 percent compared to June 2019. But in July, the comeback was complete. The week of July 12th, visits were actually up 2.1 percent compared to the same week in 2019.
Diners slow to revert:
Diners still haven’t reverted to pre-pandemic behaviors entirely. From the report: “One of the factors limiting a full visit return for McDonald’s this past quarter was patrons’ slow return to their pre-pandemic dining patterns. In June 2019, 39.8 percent of visits were before noon, compared with just 36.9 percent and 37.0 percent of morning visits in June 2020 and 2021.”
Strength ahead:
Despite the slow second quarter, it seems that July has marked a turning point for the brand. Visits are now exceeding pre-pandemic levels, and there’s no indication that they should slow down.
Canada's Restaurant Loss
Before the pandemic, Canada's restaurant count held steady at 66,000 units since 2016, but then 2020 happened, and the industry lost 5,000 units, a decline of -8 percent, reports The NPD Group. Independent restaurants lost 3,000 units, representing the bulk of the slide, according to NPD's ReCount®2020 restaurant census, which tracked Canadian restaurants opened as of December 2020.
The restaurant categories hardest hit by closures are those that relied heavily on customers' regular day-to-day routines, such as shopping, working, or schooling. Lunch is an example of how the disruption in daily routines impacted this daypart. In the 12 months ending December 2020, lunch traffic experienced the worst decline, down -26 percent, compared to the same period a year before. As a result, the sandwich-restaurant category lost the most significant number of units last year, with a store-count decline of -7 percent.
The juice, snack, and salad bars restaurant categories have a similar reliance on office workers, students, and gym-goers. These categories lost units in the mid-teens. The gourmet coffee and tea restaurants realized declines for similar reasons.
Visits, physical and virtual, to Canadian restaurants were down -13 percent in the year ending May 2021 compared to the same period last year. Most impacted by the mandated dine-in restrictions, full service restaurants experienced a -30 percent decline in traffic in the period. Quick service restaurants, most of which have off-premises services, like a drive-thru, saw visits drop by -8 percent in the year ending May 2021 compared to a year ago, according to NPD's continual tracking of the Canadian foodservice industry.
"Although last year's restaurant unit loss was steep, new restaurants did continue to open despite the pandemic," says Vince Sgabellone, NPD foodservice industry analyst. "As the expected recovery plays out over the coming months, expect to see even more openings and maybe some returning names added to our ReCount census next year. The resourcefulness and tenacity of the restaurant industry never cease to impress."
Consumer Perception on Foodservice Packaging
The Foodservice Packaging Institute released its second Consumer Perceptions on Foodservice Packaging Report to better understand the general consumer’s use and perception of single-use foodservice packaging. To discover those consumer perceptions and provide feedback to its members, FPI commissioned a third-party to conduct a survey to find out how frequently people use single-use packaging and their perceptions and behavior choices related to foodservice packaging, particularly during the COVID-19 pandemic.
“The spotlight has grown and remains focused on single-use foodservice packaging, particularly throughout the past year,” said Natha Dempsey, president of FPI. “We wanted to better understand consumer perceptions around these packaging products and compare them to our first consumer survey conducted in 2019. We also wanted to find out how, or if, the pandemic affected their perceptions of foodservice packaging.”
In the survey, respondents were asked if the COVID-19 pandemic influenced their perception of potential benefits, concerns or attributes of single-use foodservice packaging items. In both the U.S. and Canada, the clean and sanitary nature of single-use foodservice packaging items increased in importance for the highest percentage of respondents, followed by the protective/tamper-proof properties, although less than 40 percent said this would continue after the pandemic.
Reaffirming results from 2019, being leak- or spill-proof and stopping oil or grease from soaking through and staining clothes, car seats, etc. remain the most important attributes of single-use foodservice packaging for U.S. and Canadian respondents.
Results also showed that more than 50 percent of adults in the U.S. and Canada use single-use foodservice packaging at least once a week. This represents a slight decrease from 2019 results for U.S. and Canadian respondents. Within U.S. respondents, survey results in both 2021 and 2019 show that those with the highest income remain the most likely to use single-use foodservice packaging every day, and higher education appeared to correlate to higher use.
Participants were asked questions about how frequently they use single-use foodservice packaging; their beliefs about the importance of performance attributes in single-use foodservice packaging; benefits and concerns they have about single-use foodservice packaging and their reusable counterparts; their behavior choices related to foodservice packaging; environmental issues; and, new in 2021, the influence of the COVID-19 pandemic. Each question was analyzed looking for significant differences in responses across demographic groups and frequency of using single-use foodservice packaging, and from the 2019 survey.
The final report includes input from 800 respondents in the United States and Canada balanced across income, education level, gender and region. This sample provides a statistically representative view of the beliefs of these populations with a 95 percent confidence rate with a plus/minus 5 percent margin of error.
FPI members and contributing participants received complete survey results. A complimentary executive summary of the report is available on FPI’s website.