
MRM Research Roundup: End-of-July 2019 Edition
15 Min Read By MRM Staff
This edition of Modern Restaurant Management (MRM) magazine's Research Roundup features what customers want from the off-premise experience, America's favorite QSR chains and views on restaurant technology.
What Consumers Crave in Delivery Apps
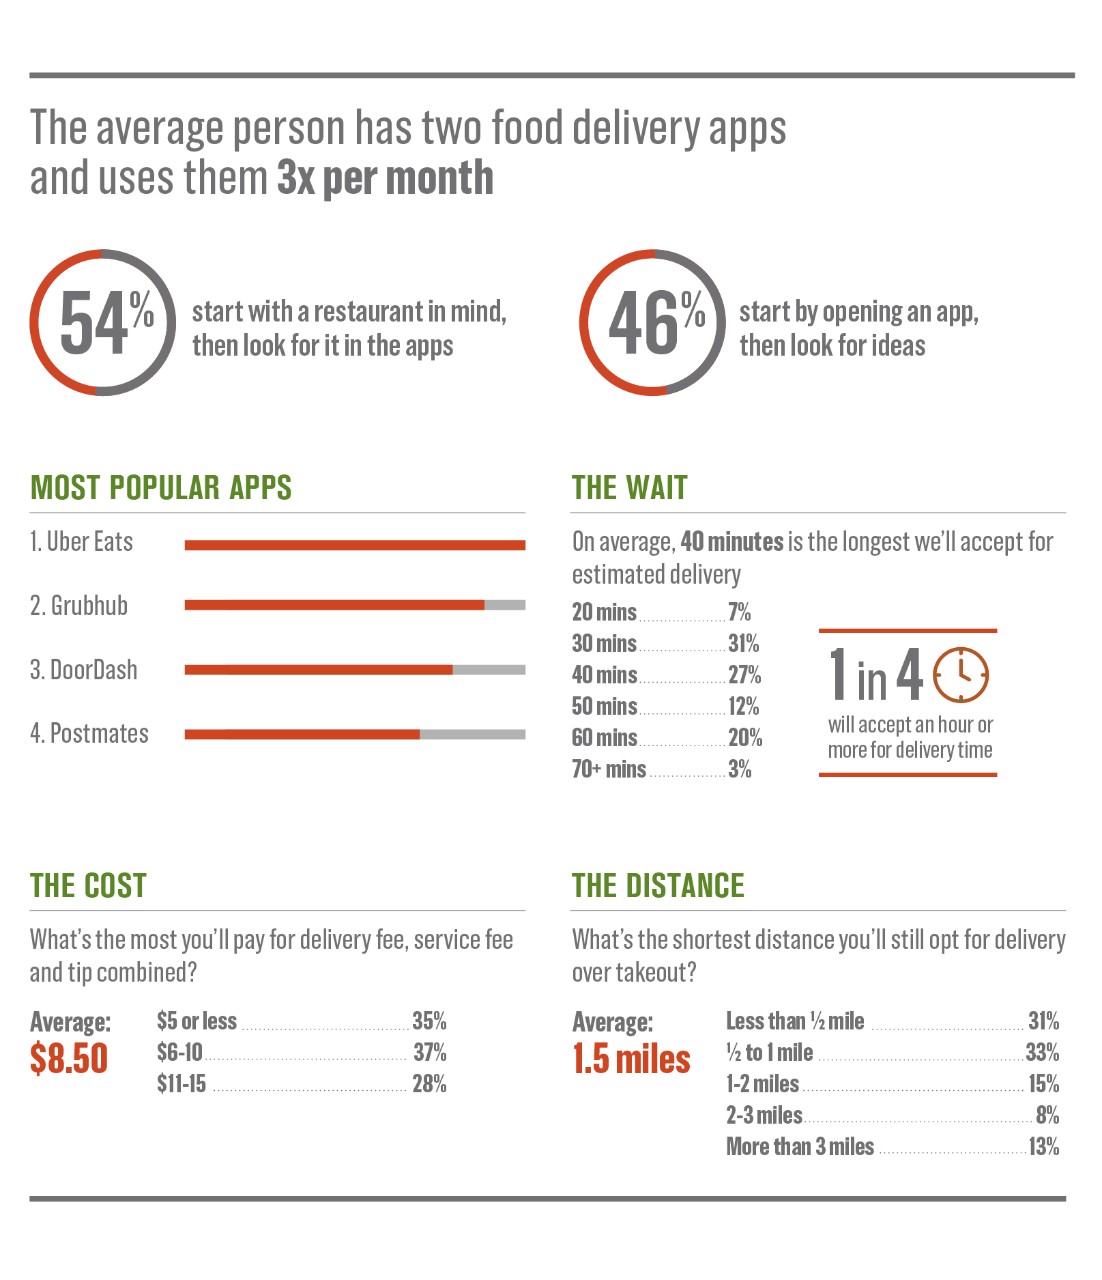
The team at US Foods wanted to learm more about what consumers crave in their off-premise dining experiences to let restaurant owners and operators know how they can better cater to their customers’ needs while making smarter business decisions.
For restaurant operators, the delivery industry can be a difficult landscape to navigate, but if done correctly, big profits are on the horizon.
In May, they surveyed 1,518 American adults who have used food delivery apps, including UberEats, Grubhub, DoorDash and Postmates. Respondents’ ages ranged from 18 – 77, with a median age of 31. They also surveyed 497 American adults who identified as having worked as a deliverer for at least one food delivery app. Respondents’ ages ranged from 21 – 63, with a median age of 30.
For restaurant operators, the delivery industry can be a difficult landscape to navigate, but if done correctly, big profits are on the horizon.
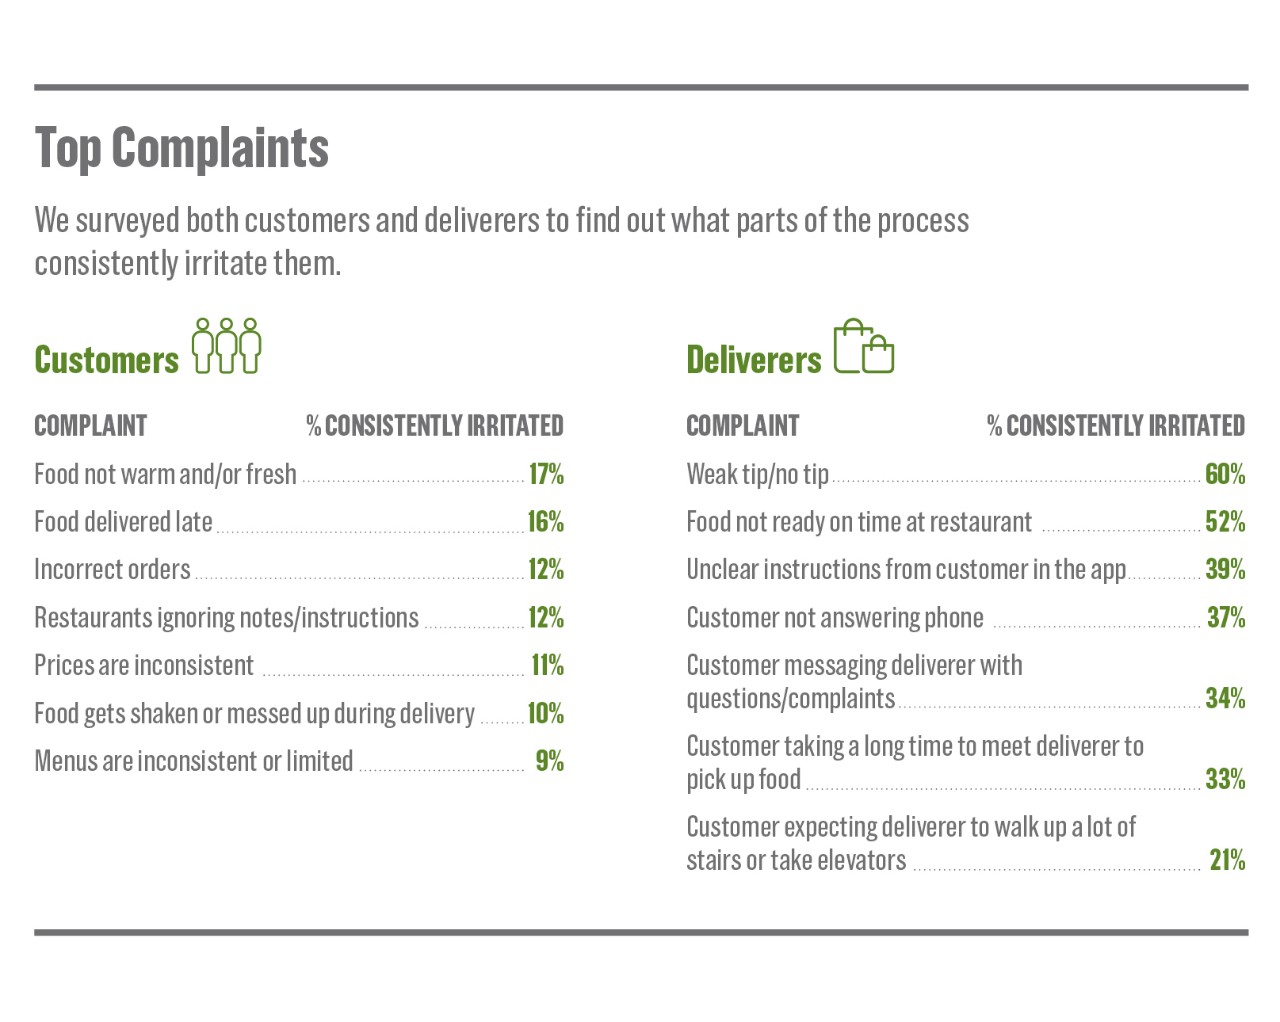
For consumers, the on demand aspect is everything. The survey establishes the most common complaints in the world of food delivery apps. Not surprisingly, people want food served warm, fresh and on-time – especially when they're paying a premium for it.
Of course, frustration extends beyond the customers. Of the nearly 500 deliverers we surveyed, topping the list is weak tips, food not being ready at the restaurant, and lack of communication with customers. To remedy this, many operators are scaling back delivery services and menus so as not to overwhelm the kitchen and create a negative experience for both the dine in and delivery customers.
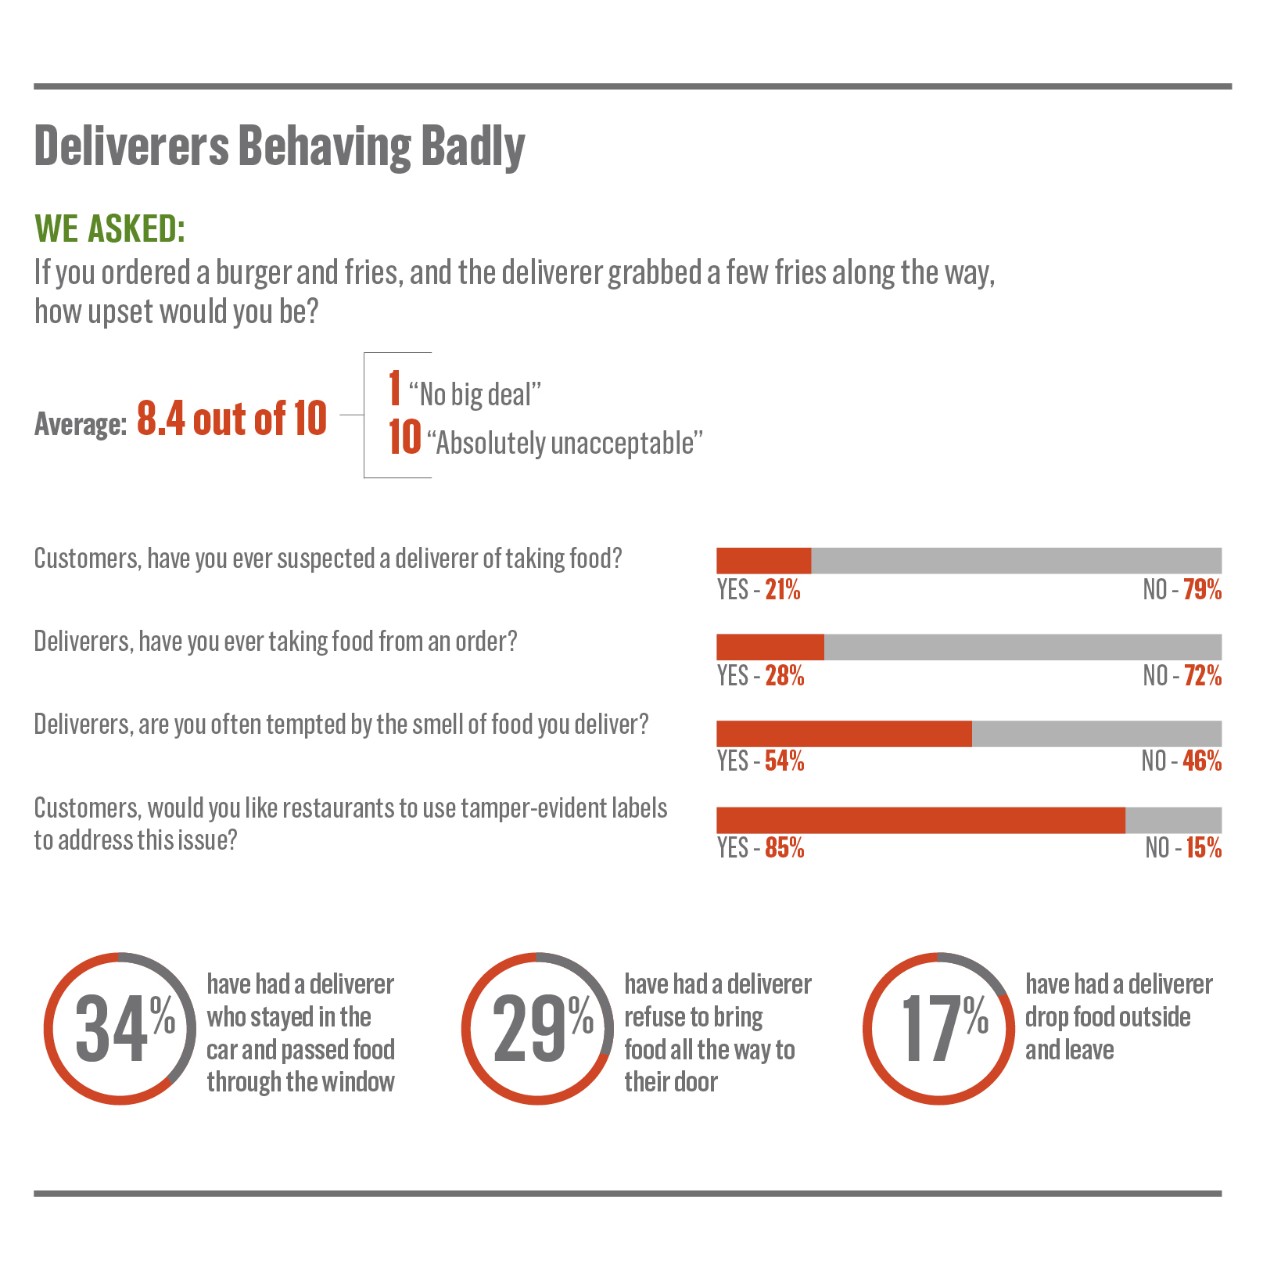
When things go wrong in food delivery, unfortunately the end consumer often blames the restaurant, even when they are not at fault. With so many moving parts, getting it right can be tough to achieve, but the industry is creating more solutions every day.
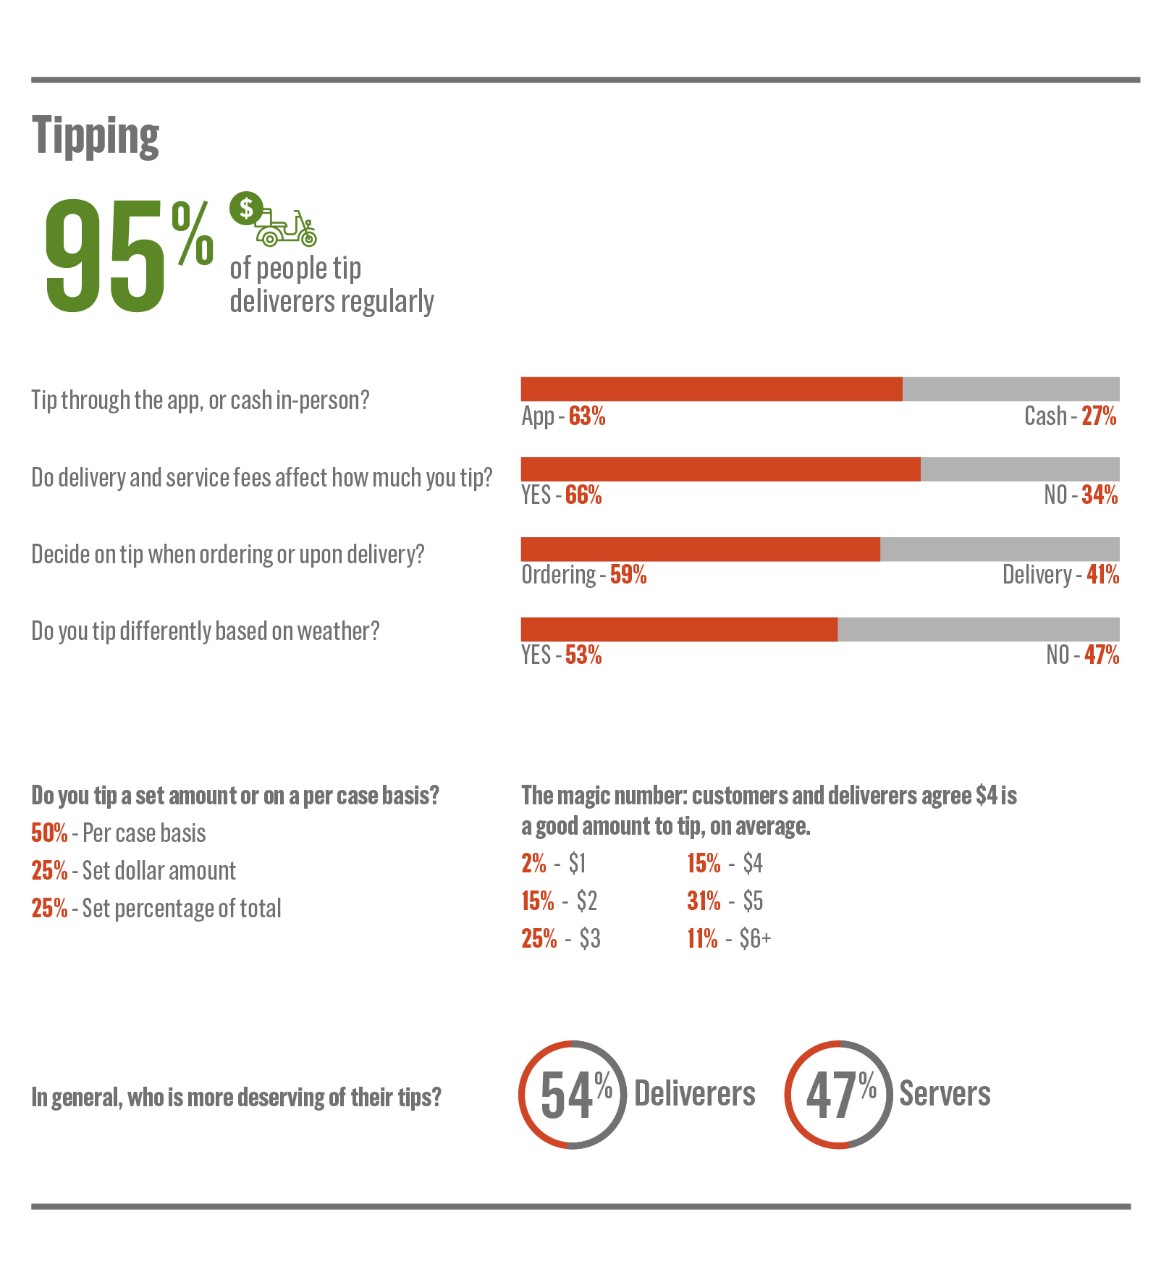
When delivery goes well, deliverers should be paid a solid tip. In decades past, the formula was simple – you give the pizza guy $5 on Friday night when he delivers your pie. As the food delivery business has expanded exponentially, tipping has become more complicated. Some customers use these apps five times a week. Should they be spending $25 on tips? Plus, there are service and delivery fees added in. It is always an emotionally charged subject in our culture. Here are the latest trends in food delivery tipping.
America's Favorite QSRs
A large-scale consumer study conducted by Market Force Information (Market Force) reveals America’s favorite quick-service restaurant (QSR) chains in seven popular food categories: burgers, sandwiches, Mexican, pizza, chicken, coffee and bakery, and frozen dessert and smoothie. The study found In-N-Out is still America’s favorite burger chain, while Jersey Mike’s ranked tops for sandwiches, Chipotle for Mexican food, Blaze for pizza, Chick-fil-A for chicken, Krispy Kreme for coffee and bakery, and Culver’s for frozen dessert and smoothie. Chick-fil-A earned the highest scores across all categories, making it America’s favorite QSR overall.
Chick-fil-A earned the highest scores across all categories, making it America’s favorite QSR overall.
More than 7,600 consumers were polled for the study, which ranks the brands on two factors – consumers’ satisfaction levels with their most recent visit and their likelihood to recommend the restaurant to others. The study also uncovers consumers’ QSR dining habits, brand preferences, delivery trends and in-restaurant technology use.
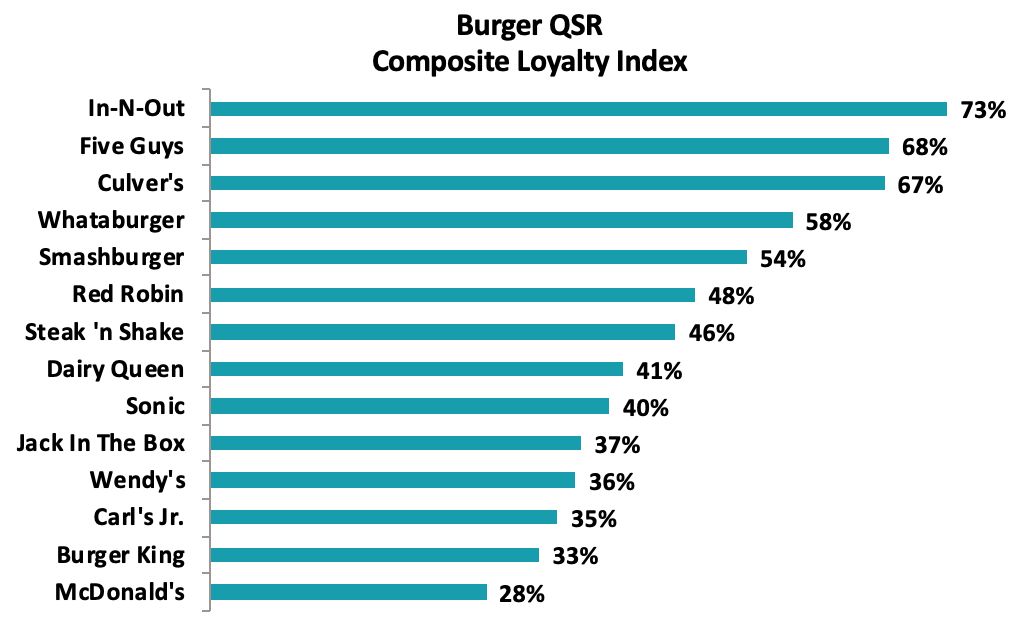
Burgers: In-N-Out Burger’s Reign Remains
In-N-Out Burger – a West Coast chain with a cult following – ranked No. 1 among burger chains in Market Force’s 2019 QSR study for the third consecutive year with a 73 percent score, followed by Five Guys in second place with 68 percent and Culver’s a close third with 67 percent. Carl’s Jr., Burger King and McDonald’s ranked lowest among the 14 burger chains studied, with McDonald’s coming in a full 45 percentage points below In-N-Out.
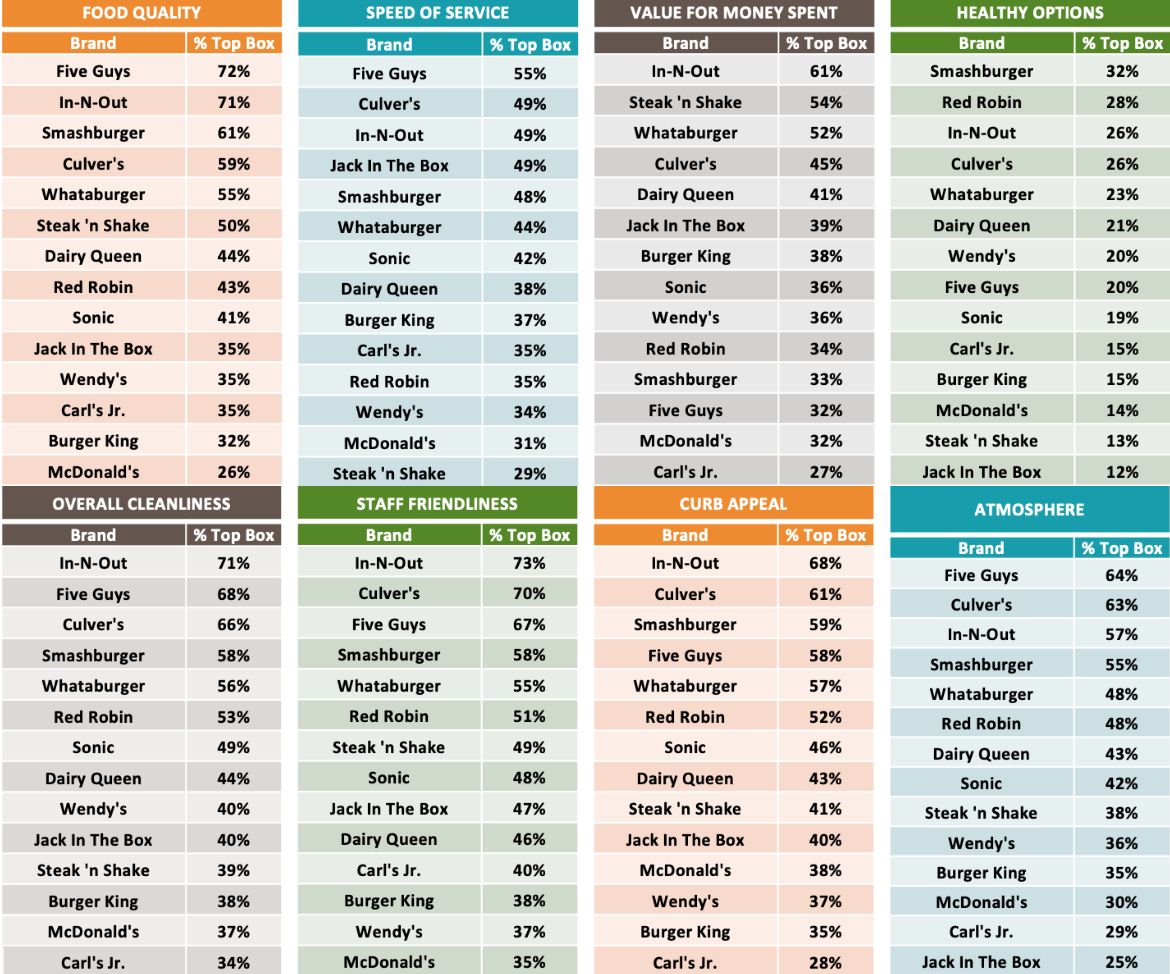
In-N-Out Has Best Value, Friendliest Staff
Market Force also asked diners to rank the burger chains on eight customer experience categories, including value, food quality, service speed, staff friendliness, cleanliness, atmosphere, healthy options and curb appeal. In-N-Out performed well, earning the top spot for value, staff friendliness, cleanliness and curb appeal, but was unseated this year by Five Guys for atmosphere, food quality and service speed. It was also bested by Smashburger in the healthy options category. On the flip side, McDonald’s found itself at the bottom for both food quality and friendly service.
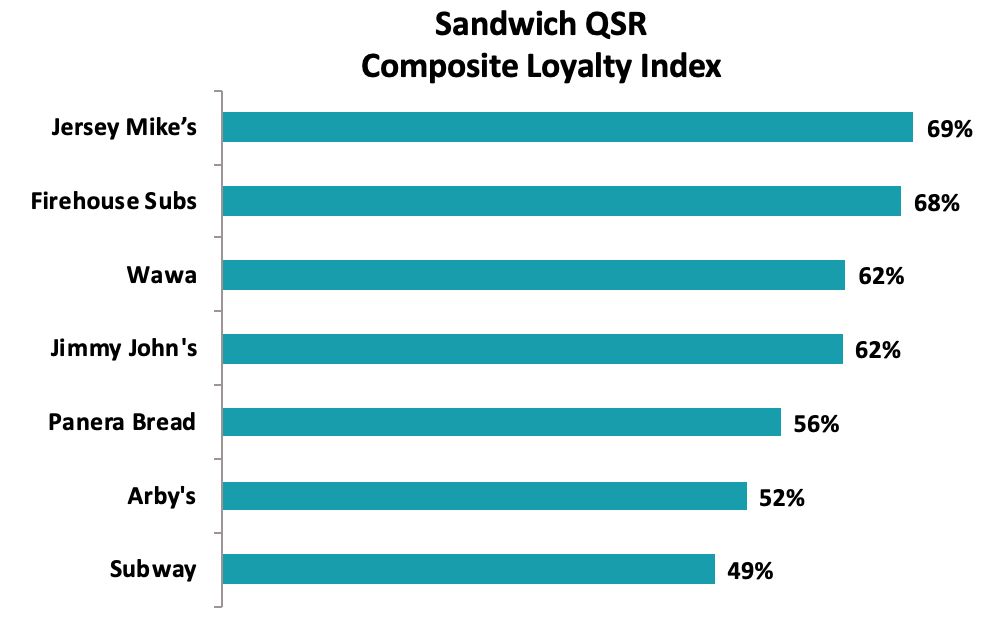
Sandwiches: Jersey Mike’s Unseats Wawa as Sandwich Favorite
While revered convenience store Wawa nabbed the sandwich top spot in 2018, Jersey Mike’s moved up from third place this year to outscore second-place Firehouse Subs and both Wawa and Jimmy John’s, which tied for third. Panera Bread, Arby’s and Subway again landed in the bottom three spots.
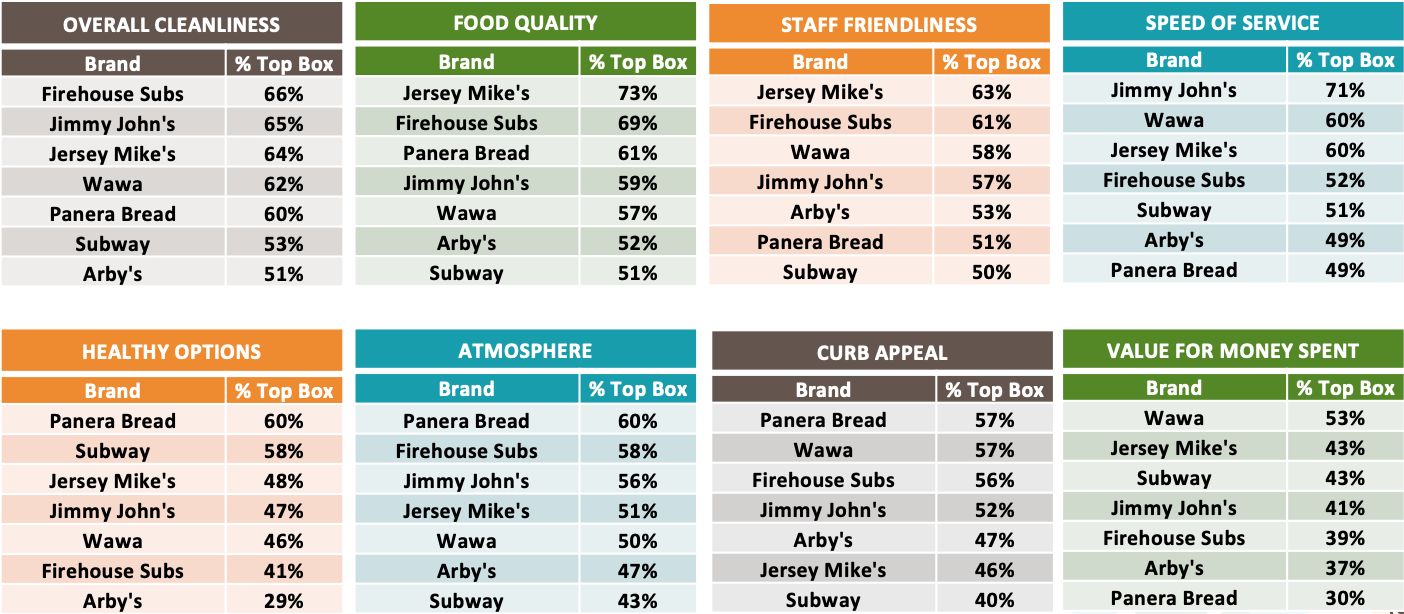
Sandwich Chains Run Gamut in Customer Experience Rankings
No single brand dominated across the eight customer experience attributes that Market Force studied, though Panera took the top spot in two – healthy options and atmosphere – but scored poorly on value for money spent. Jersey Mike’s came out on top for food quality and staff friendliness, while Jimmy John’s, Firehouse Subs and Wawa ranked highest for service speed, cleanliness and value, respectively. Arby’s, Subway and Panera all made an appearance in the bottom slot, with Subway doing so four times.
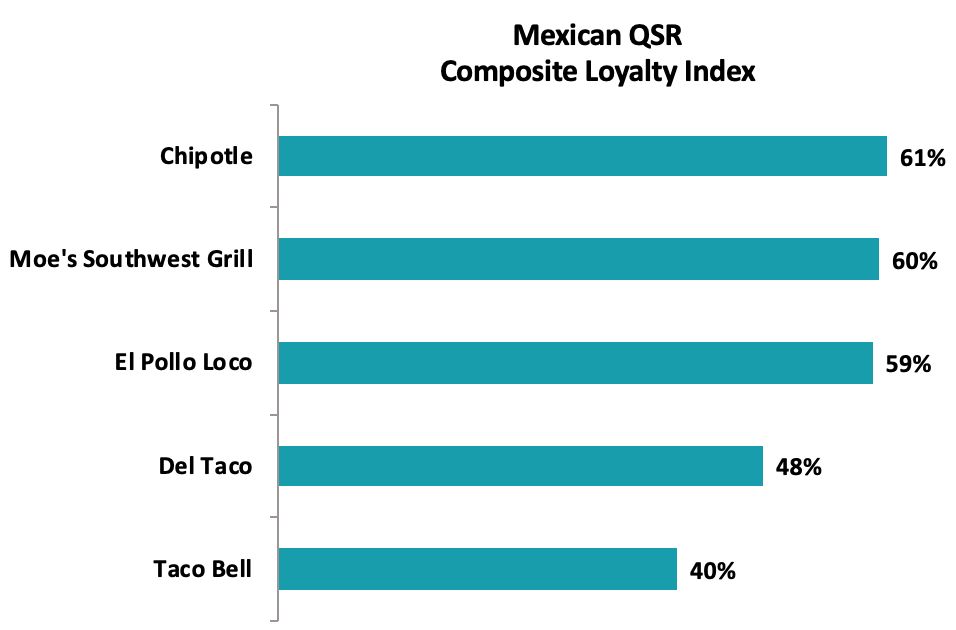
Mexican: Chipotle Lands at Top, Taco Bell at Bottom
Chipotle ranked first in the Mexican food category for the third straight year, ahead of second-place Moe’s Southwest Grill and third-place El Pollo Loco. Qdoba, which ranked third in Market Force’s 2018 study, failed to receive enough votes to make the rankings this year. Del Taco was fourth and Taco Bell was once again ranked lowest of the chains studied, with a score that trailed Chipotle by 21 percentage points.
Chipotle Is Tastiest and Cleanest
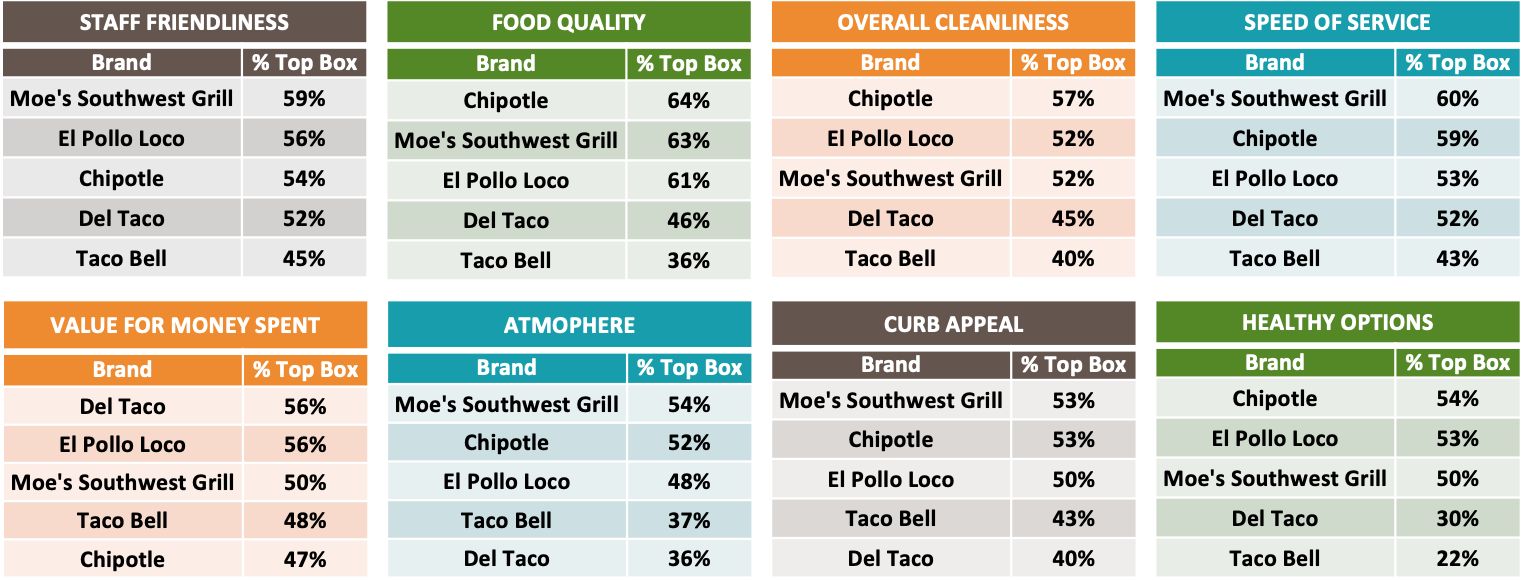
Chipotle and Moe’s Southwest Grill battled it out across the categories, with Chipotle winning for food and Moe’s for service. Del Taco was the value leader – an area where Chipotle lagged. Taco Bell and Del Taco ranked toward the bottom in most categories.
Pizza: Blaze Pizza Is Big Cheese Among Diners
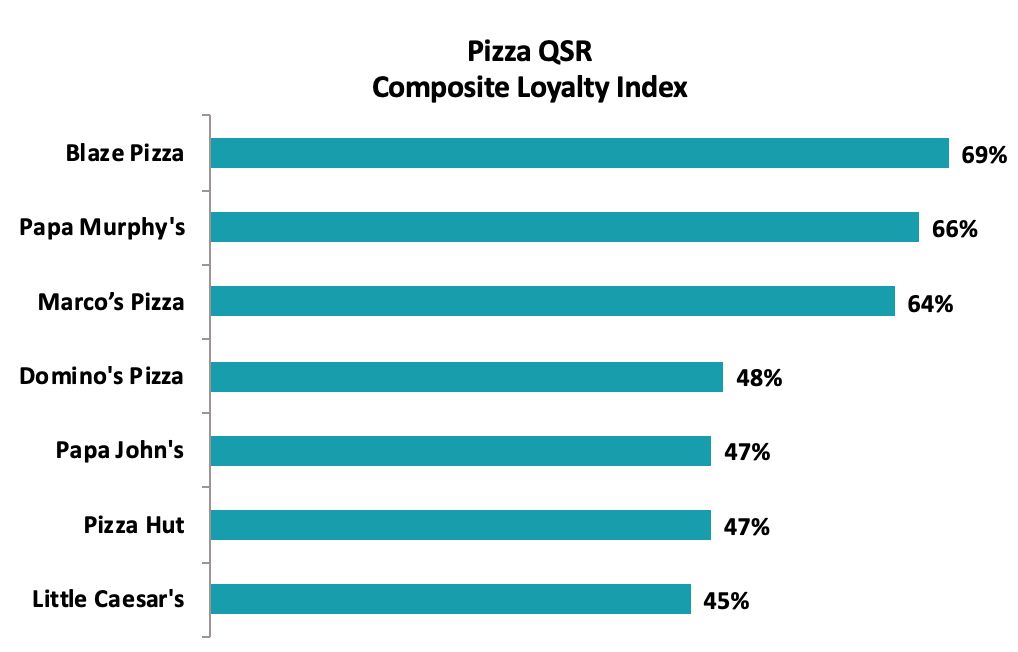
Blaze Pizza, a Pasadena, Calif.-based chain of more than 300 restaurants in 42 states and five countries, nabbed the No. 1 spot in the pizza category, followed closely by Papa Murphy’s in second and Marco’s Pizza in third. The three brands scored far ahead of Papa John’s and Pizza Hut, which tied for fifth, while Little Caesar’s landed at the bottom. Pizza Ranch failed to receive enough votes to make the list after placing first in 2018.
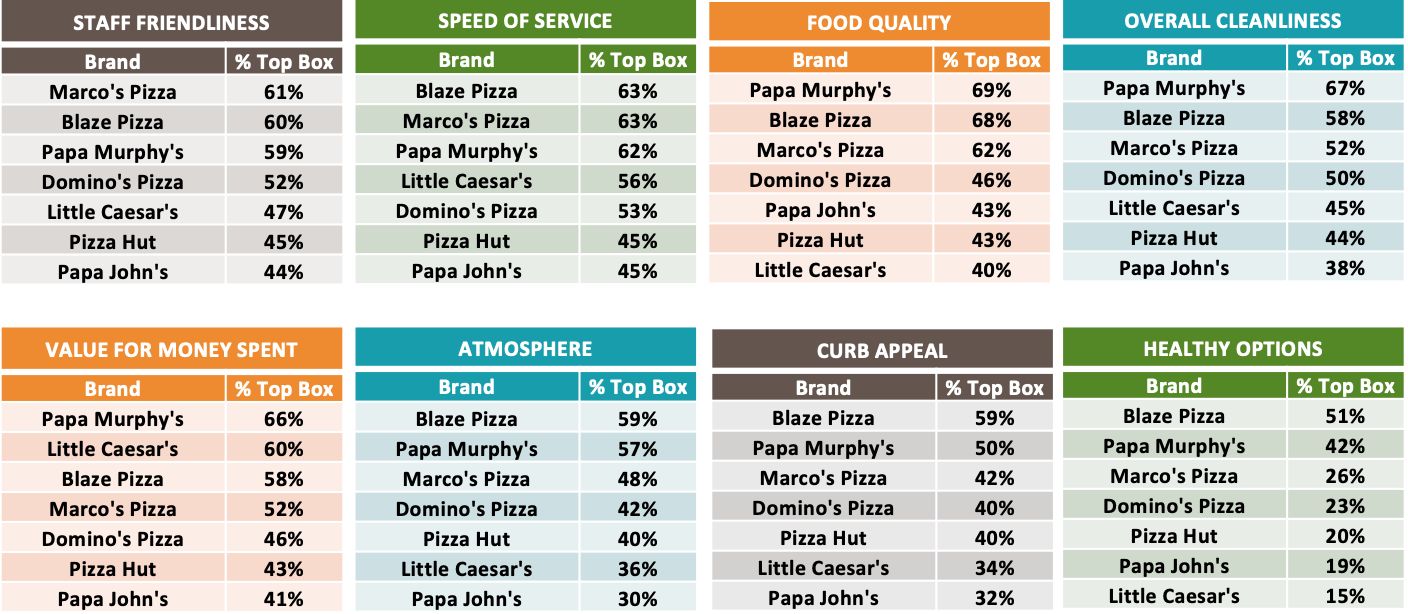
Papa Murphy’s, Blaze Pizza Excel in Customer Experience
Papa Murphy’s and Blaze Pizza led in every customer experience category except staff friendliness, which went to Marco’s. Papa Murphy’s was No. 1 in the key food quality and value categories, while Blaze Pizza was a clear winner in atmosphere, curb appeal and healthy options, and tied for first with Marco’s for its speed of service. Marco’s performed well, landing in the top three in every area except value.
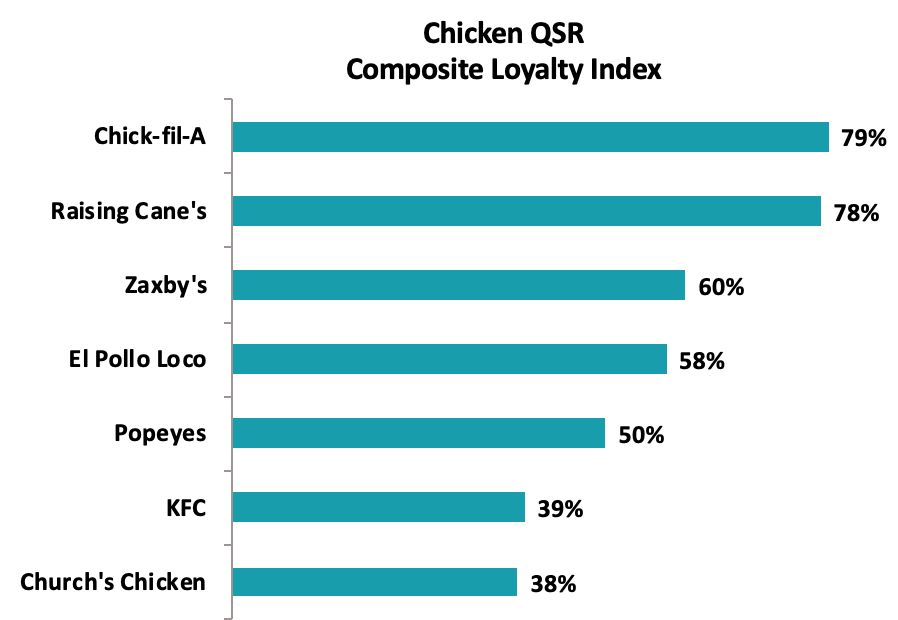
Chicken: Chick-fil-A Rules Roost for Fifth Consecutive Year
Consumers continue to crave chicken, and Chick-fil-A continues to deliver, ranking as America’s favorite chicken chain for the fifth straight year with a 79 percent score – neck and neck with Raising Cane’s, which ranked second at 78 percent. Zaxby’s rounded out the top three with a score of 60 percent. KFC and Church’s Chicken landed at the bottom of the seven chains studied.
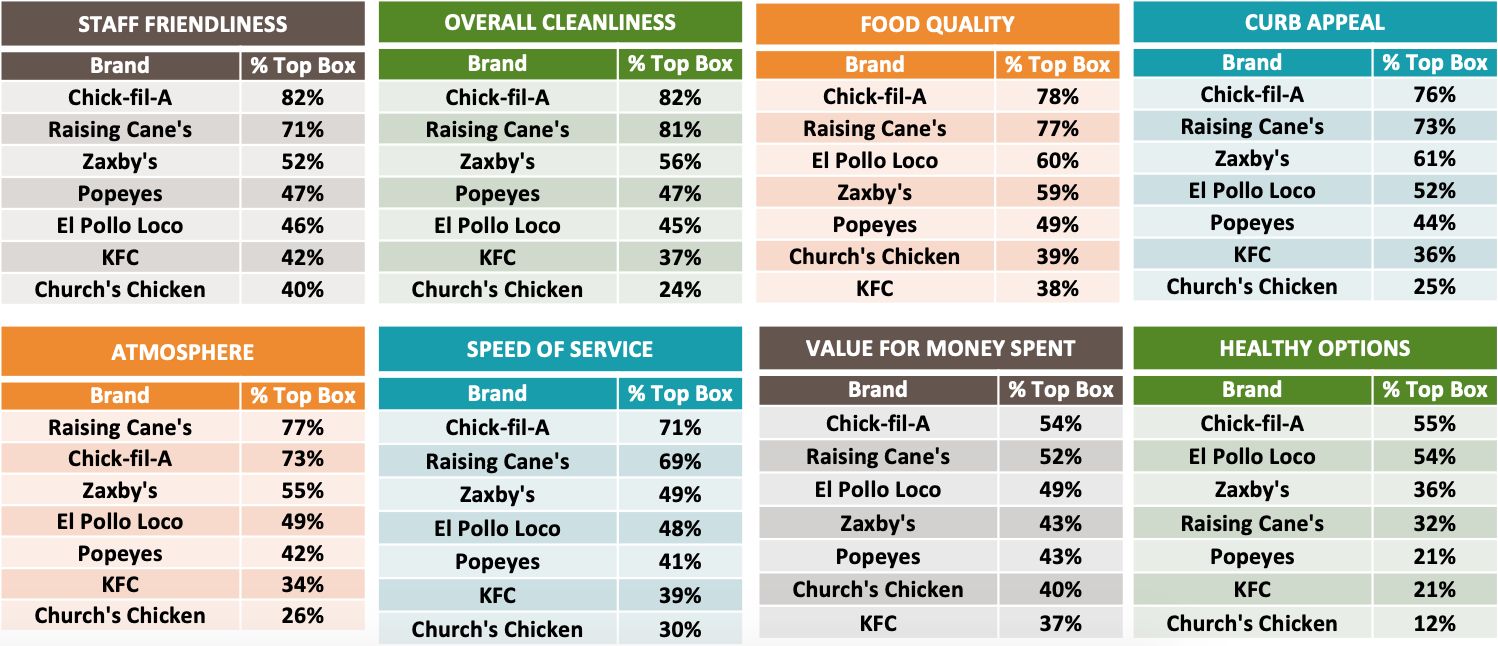
Chick-fil-A and Raising Cane’s Fly High in Customer Experience
Chick-fil-A was the overall winner for good reason, as the chicken chain outscored others in every category except atmosphere, an area that Raising Cane’s won out. Raising Cane’s performed well across the board, landing in the No. 2 spot for six of the eight categories, and El Pollo Loco placed in the top three for three categories. Church’s Chicken and KFC were last or second-to-last in every category, with Church’s Chicken ranking significantly behind the leaders in healthy options, cleanliness and atmosphere.
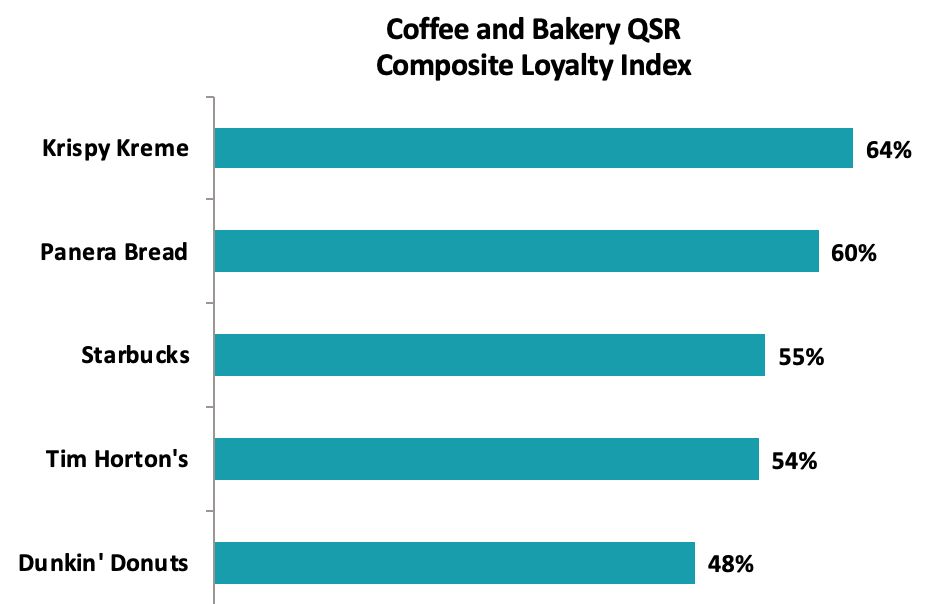
Coffee and Bakery: Krispy Kreme Reigns Supreme
In the coffee and bakery category, Krispy Kreme was the clear favorite with a score of 64 percent, followed by Panera at 60 percent and Starbucks at 55 percent. Dunkin’ Donuts brought up the rear with a score of 48 percent.
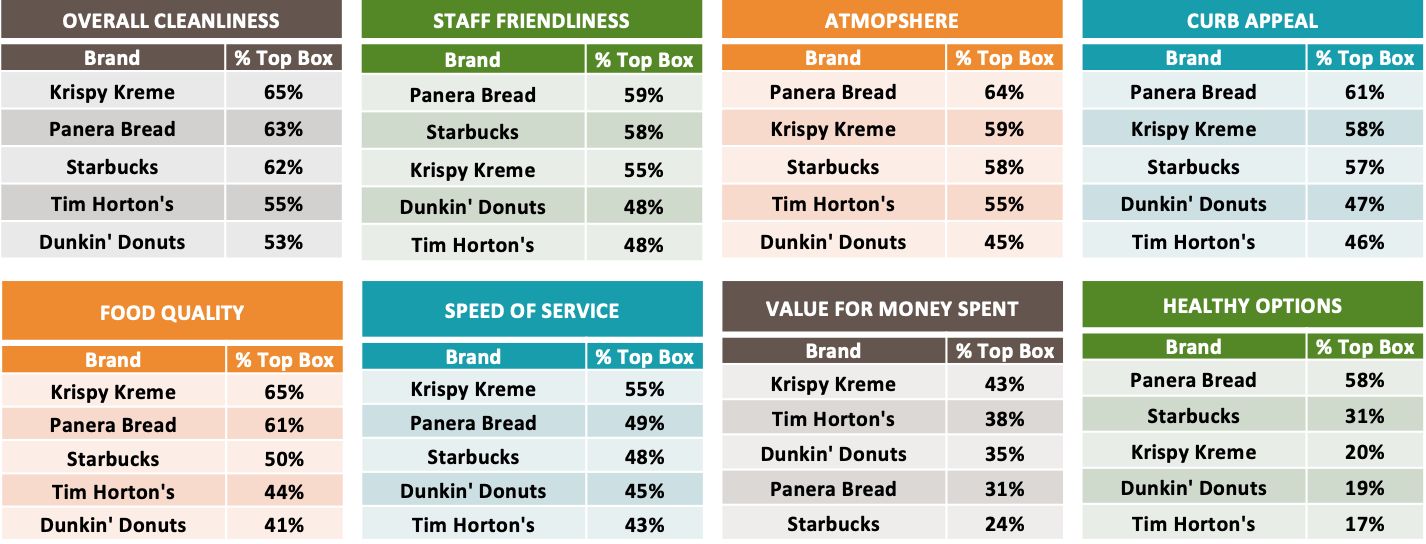
Panera, Krispy Kreme Dominate Customer Experience Categories
Of the eight customer experience categories studied, Krispy Kreme came in at No. 1 for half, including food quality, value, cleanliness and service speed. Panera edged out Starbucks for staff friendliness, and was also lauded for its healthy options, atmosphere and curb appeal. Starbucks was in the top three for every category except value, where it ranked last with nearly 20 percentage points less than top-ranked Krispy Kreme.
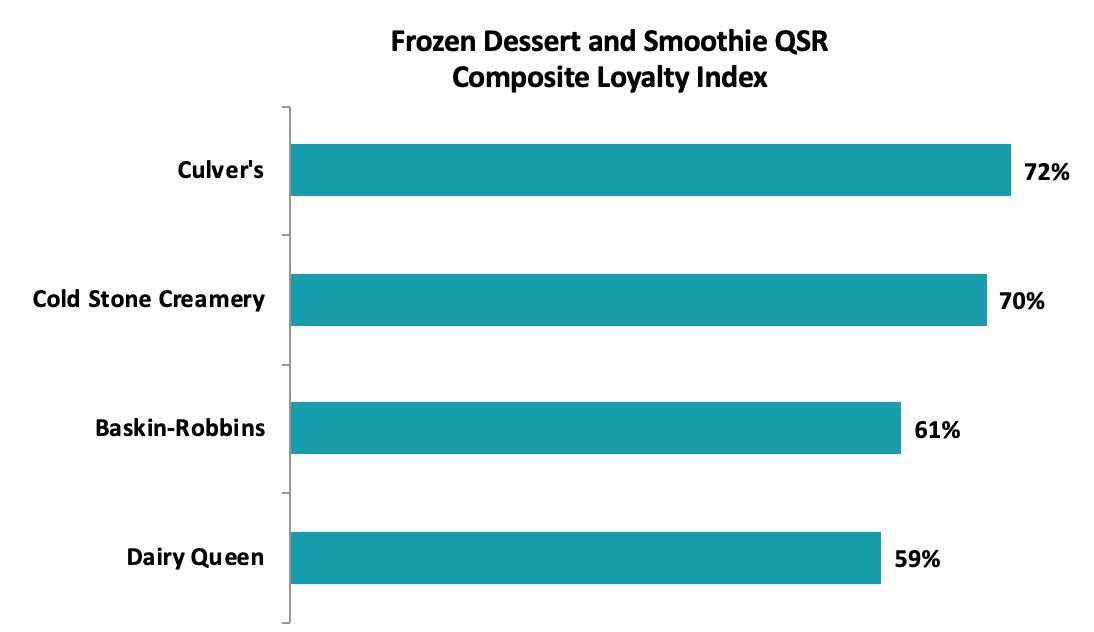
Frozen Dessert and Smoothie: Culver’s Scoops Top Spot
In the frozen dessert and smoothie category, Culver’s was the favorite, followed by Cold Stone Creamery, Baskin-Robbins and Dairy Queen.
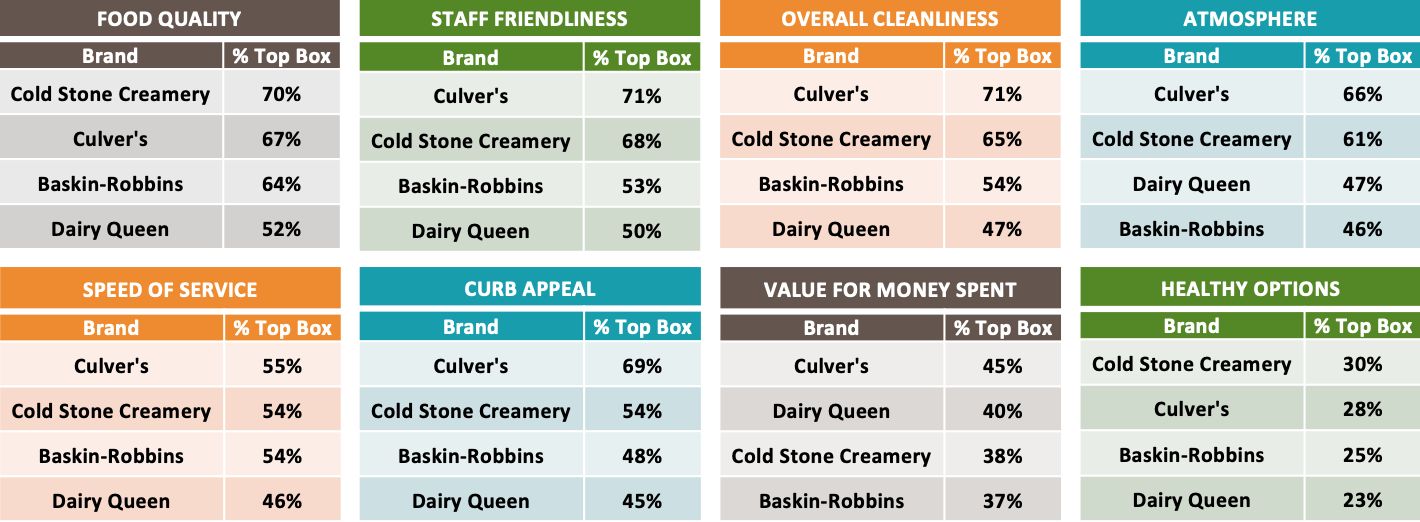
Culver’s Leads in Most Customer Experience Categories
Of the eight customer experience categories studied, Culver’s came in No. 1 for six, including staff friendliness, cleanliness, atmosphere, service speed, curb appeal and value. Cold Stone Creamery was found to have the best food quality. Dairy Queen trailed in six categories, and Baskin-Robbins in the other two.
For the rankings, Market Force asked participants to rate their satisfaction with their most recent QSR experience, and their likelihood to refer that restaurant to others. The results were averaged to attain a Composite Loyalty Index score. Only chains that received at least 100 consumer responses and representing 2 percent or more of responses were analyzed.The survey was conducted online in May 2019 across the United States. The pool of 7,668 respondents represented a cross-section of the four U.S. census regions. Fifty-four percent reported household incomes of more than $50,000 a year. Respondents’ ages ranged from 18 to over 65. Approximately 71 percent were women and 29 percent were men.
For more information on Market Force’s services for the restaurant industry, click here.
Views on Restaurant Tech
OnBuy.com surveyed 1,562 Brits on their attitudes towards restaurant technologies. Here’s what they thought. It’s no surprise that self-order kiosks are the most familiar tech to Brits at 82 percent – most McDonalds and service stations now feature these. This is followed by:
- Ordering food via a mobile app (75 percent)
- At-table food ordering (68 percent)
- Digital-electronic bill payments (39 percent)
- Immersive dining experiences (33 percent) *
A clear priority emerges with the type of tech we want to see. British people desire the ease of everything in one place – hence the most desirable tech is at-table food ordering (71 percent), followed by at-table food tracking (64 percent) and interactive menu experiences (62 percent) **.
Closely following are:
- Micro call buttons (59 percent)
- Immersive dining (57 percent)
- Wait list management software (51 percent) ***
- Electronic bill payments (47 percent)
And the least favoured restaurant technologies are:
- At-table digital feedback services (33 percent), built-in games while you wait (29 percent), and facial/fingerprint recognition payments (10 percent).
- A resounding number of respondents expect restauranteurs to implement new technologies – 71 percent expect it, 27 percent don’t, and 2 percent don’t mind.
- Not only this, but new tech will evidently attract more custom. 61 percent of Brits are more intrigued by a restaurant utilising innovative tech. This is compared to 27 percent who aren’t, and 12 percent who say they’re not sure.
Overall, Brits are in favour of new restaurant tech. 57 percent believe tech will successfully entice customers into visiting. 17 percent don’t, while 26 percent are sceptical, explaining it depends on the tech.
Finally, when asked how likely they are to eat at a restaurant featuring these technologies, most believe they will. 33 percent answered very likely, followed by likely (20 percent), somewhat likely (13 percent), neither likely nor unlikely (16 percent), somewhat unlikely (5 percent), unlikely (9 percent) and very unlikely (4 percent).
*’Immersive dining experiences’ can incorporate, but not limited to, the following: digitally enhanced walls and decoration, immersive and surround-sound music, digitally enhanced dining tables.
**‘Interactive menu experiences can involve AR assisted menus that create pop-up menu items, displaying: a projection mapping of ingredients within the dish, the cooking method and journey of the dish, nutritional information and allergens, and more.
***’Wait list management software’ is defined as software to enhance and fine-tune a problem of busy restaurants – that is, a waiting list. Software could create any of the following: pre-orders for food and drinks to be ready on sit-down, text alerts for when a table is ready, a virtual waiting list, and more.
How Tabletop Tech Helps
We’ve all been there… you’re out to eat and in need of a refill or the check and the wait staff is nowhere to be found. It slows down business, reduces customer satisfaction and hurts the bottom line. New research in the INFORMS journal Management Science shows to counter this, restaurants should introduce tabletop technology as a demonstrated way to improve service and satisfaction.
Tabletop technology allows customers to view menu items, re-order beverages, pay for the meal, play games and browse news content. The technology is meant to assist waiters, not replace them.
Tabletop technology is likely to improve sales by one percent per check and reduce meal duration by 10 percent.
The research conducted by Tom Fangyun Tan of the Cox Business School at Southern Methodist University and Serguei Netessine of the Wharton School at the University of Pennsylvania reveals tabletop technology is likely to improve sales by 1 percent per check and reduce meal duration by 10 percent. The combination of these two effects increase the sales per minute or sales productivity by 11 percent.
“We estimate the one percent sales lift per check translates into $2 million in extra sales or $1 million in profit per month in the short-run,” said Tan, an associate professor of information technology and operations management. “And that’s a conservative estimate.”
The data was collected from a restaurant chain here in the U.S. that owns 66 establishments. It looked at transaction data from 2012 to 2014 or 2.6 million transactions.
“A good, attentive waiter already does what the tabletop device does… a less attentive or forgetful waiter does not, but relies more on the device, which makes up for the lacking ability resulting in faster service,” said Tan.
The data suggest that restaurants reevaluate their operations to fully reap the benefits of tabletop technology. They can gain new competitive and financial advantages in an industry that faces hyper-competition and high levels of closures in their first year of business.
Economic Averages
Yelp Inc. released second quarter data for the Yelp Economic Average (YEA), a benchmark of local economic strength in the U.S. The report finds a sluggish local economy, as well as five metros that have bucked the national trend due to growing development. YEA is calculated from the fourth quarter of 2016, nationally and for 50 metros, reflecting data from millions of local businesses and tens of millions of users on Yelp’s platform.
The YEA ticked down by 0.2 percent from the first quarter of 2019 to 99.2, reversing a brief and modest recovery. YEA grew with the economy in 2017, but is now down 2 percent from its peak and has been performing below its baseline level of 100 for the past three quarters. According to researchers, Yelp provides a timely and accurate measure of a huge swath of the economy that is often missed by many major indicators. The YEA measures strength using two signals: business survival and consumer interest. The opening of new businesses and an increase in consumer engagement both boost the YEA.
“The U.S. economy is setting new records every month for its longest ever recession-free streak, but Yelp data about the Main Street local economy may be showing warning signs,” said Carl Bialik, Yelp’s data science editor. “Currently below 2017, the Yelp Economic Average shows a cooling brick-and-mortar economy across the U.S. that’s signaling a potential slowdown in consumer demand and business growth.”
Five Boomtowns Have Struck Gold in Development
The cities of Honolulu, Hawaii; Louisville, Ky; Memphis, Tenn.; Milwaukee, Wis.; and Portland, Maine had the country’s strongest combination of business growth and consumer demand, according to the YEA analysis across 50 top metros around the country. These cities grew in the second quarter of 2019 primarily due to real estate related business — agents, lawyers, services — indicative of a boom in development, sometimes aided by permissive local laws.
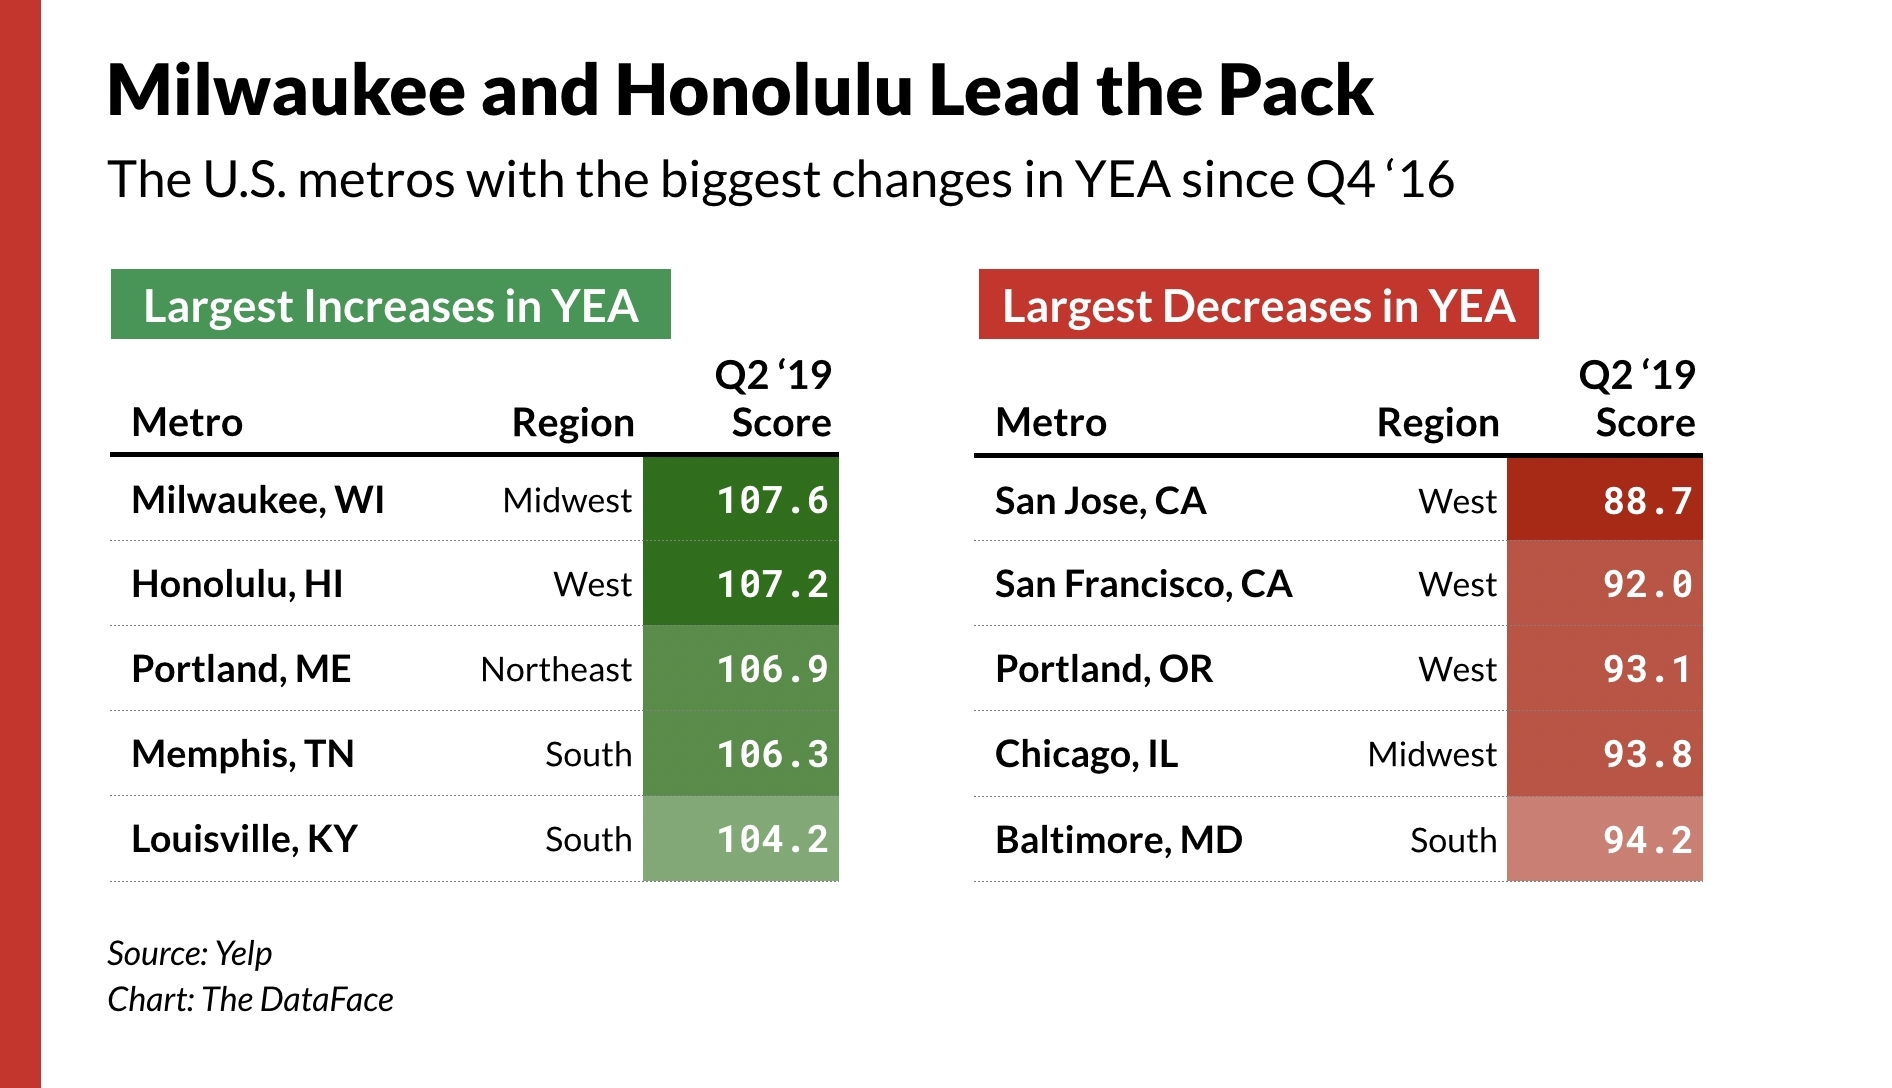
Development is among the factors driving growth in the five Yelp boomtowns, the fastest growing metros since our measurement of their local business health began in the fourth quarter of 2016. Milwaukee, Wis. is benefiting from hosting privileges for next year’s Democratic National Convention, and a new NBA arena. Developers are scrambling to meet demand for downtown housing in Memphis, Tenn. And Portland, Maine is drawing people from out of state, driving up residential permits.
Meanwhile, some of the most sluggish local economies are wealthy metro areas on the West Coast that have resisted development amid a national debate about how much to build: Portland, Ore.; San Francisco, Calif.; and San Jose, Calif. all are among the bottom five metros for growth.
Beyond the slowing brick-and-mortar economy, and boomtowns and laggards, other patterns emerged in the second quarter. More Americans were relying on paid professionals to clean in the second quarter — including their cars, clothes, carpets and homes. Americans also sought out their local watering holes with gains in lounges, pubs, and sports bars. And more of them passed on dessert, with a dip in results for businesses selling donuts and ice creams.
Popular Summer Foodie Destinations
TripAdvisor revealed the most popular restaurants and great hidden-gem alternatives in top summer travel destinations.
"Every city has those popular restaurants where it's almost impossible to get a reservation, even when planning in advance. The great news is that there are other fabulous restaurants to discover when you are ready to eat," said Desiree Fish, vice president of global communications for TripAdvisor. "The latest TripAdvisor app is the best in-destination travel tool because it helps you find great dining alternatives wherever you are traveling this summer. By leveraging the power of our community-driven platform, travelers can easily access restaurant recommendations from locals, experts and other travelers, as well as reserve tables on the go."
Popular Summer Restaurants and Delicious Alternatives
|
Destination |
#1 Restaurant (Traveler Ranked) |
Top Alternative (from Destination Expert) |
|
New York City |
DE tip from iStillDrinkwater: I have been able to get same day reservations even on busy summer Fridays. Sometimes I walk in and had to wait 10-30 minutes to get a table, no issues. |
Recommended by iStillDrinkwater: This restaurant is almost right next to Piccola Cucina. It has an amazing selection of pastas for almost half the price. The food is fresh and quick. Great deals on beers and wines as well. Just walk in, and you can easily get a table. If you have to wait, then the wait is quick. |
|
Las Vegas |
DE tip from kbunde: There shouldn't be difficulty getting a table on any given day, though it will always be more difficult during special events & on weekends, as with any restaurant. |
Recommended by kbunde: I recommend the Stratosphere–McCall's is the better steakhouse, but the Top of the World restaurant has arguably the best views in Vegas. They have a great happy hour & I especially recommend coming for drinks or dinner at sunset. You get the same views others pay for–but you get a drink and/or dinner with your view! |
|
Boston |
DE tip from Northern_Traveler00: Book well in advance for a weekend reservation, even in summer. |
Recommended by Northern_Traveler00 |
|
San Francisco |
DE tip from mini: It's best to reserve a table one to two months in advance, as this is popular among locals and tourists. There is a sister restaurant in Palo Alto but both locations are booked well in advance. |
Recommended by mini: This is the most unique and best Greek restaurant in San Francisco and it's hard to find a good alternative. They sometimes do the Greek Summer Fairs in the bay area – small booth area so may you want to look into that if you want to dine on their food. |
|
New Orleans |
DE tip from The_Loup_Garou: Best to reserve a table during peak dinner hours 14-20 days in advance. |
Recommended by The_Loup_Garou |
|
Sydney |
DE tip from KVE1005: A very generic non-descript restaurant, offering a creative but limited menu. Jack & Knife doesn't require advanced bookings, and accommodates the majority of the walk-ins. |
Recommended by KVE1005 |
|
Chicago |
DE tip from Cliff_Rock: You can usually get a same-day reservation. |
Recommended by Cliff_Rock |
|
Lisbon |
DE tip from PMAL: You need to reserve a table at least one week in advance to get the day/time you want during summer peak season. |
Recommended by PMAL |
|
Tokyo |
DE tip from Dr. Shibuyakko: You can generally get a table if you make a reservation 2-3 days in advance; however, this restaurant is extremely popular among foreign tourists, so in a peak season (such as the cherry blossom season of late March-early April), it's better to make a reservation at least one week in advance. |
Recommended by Dr. Shibuyakko |
New Milk Choices Win Acceptance
From almond to oat and coconut to pea, plant-based milk alternatives are causing something of a stir, as latest research from Mintel reveals Brits are branching out in their milk tastes. Almost a quarter (23 percent) of Brits used plant-based milk alternatives in the three months to February 2019, up from just 19 percent in 2018.
Driving the plant-based revolution, some 26 percent of women enjoy plant-based milk alternatives and as many as a third (33 percent) of 16-24s opt for these varieties. Growth of milk alternatives is largely fuelled by more recent category entrants such as oat (volume sales of which grew 71 percent between 2017), coconut (up 16 percent between 2017-18) and almond variants (up 10 percent between 2017-18), all of which have grown in visibility as well as availability in 2018.
But while plant-based milk alternatives continue to grow in popularity, according to Mintel research, they accounted for just 4 percent of volume sales and 8 percent of value sales of white milk in 2018. Furthermore, their use in cooking and hot drinks remains limited. Only 25 percent of plant-based milk alternatives consumers use these products in cooking, compared to 42 percent for standard cow’s milk users. The difference is even wider with hot drinks, where just 42 percent of plant-based milk alternatives consumers use them in hot drinks, compared to 82 percent for standard cow’s milk users. Nevertheless, a fifth (21 percent) of Brits believe nut milks add more flavour to drinks than cow’s milk.
Highlighting that there are more opportunities for further growth in the plant-based milk alternatives trend, 65 percent of plant-based milk users would welcome advice on how to use plant-based milk/cream alternatives in cooking/baking – with 24 percent of non-users also interested in such advice.
Emma Clifford, Associate Director of UK Food and Drink, said: “Plant-based milk alternatives continue to make further inroads into the mainstream, with high levels of innovation activity such as the entrance of Innocent Drinks to the market in 2018. Growth in this segment forms part of a much wider plant-based movement, driven by concerns around health, ethics and the environment, as well as by consumers’ love of variety in their diets.
“The shift towards the higher-priced plant-based alternatives will carry on, helping to add value to the market overall. Consumer interest in advice on how these alternatives suit different usage occasions signals marked potential to boost usage among current users and non-users alike.”
Traditionally a household staple, usage of standard cow’s milk is sliding among 16-24-year-olds, falling from 79 percent in 2018 to 73 percent in 2019. While cow’s milk still accounted for the vast majority of white milk sales in 2018 (96 percent), usage of this family favourite is increasingly skewed towards older consumers, peaking at 92 percent among over-45s.
This fall in usage among 16-24s comes as 37 percent of this age group say they have reduced how much standard cow’s milk they have used in the last 12 months for health reasons. Environmental concerns are also playing a role, with 16-24s most likely (36 percent) to agree that dairy farming has a negative impact on the environment. The significantly lower usage of cow’s milk among the younger generation is also in line with these consumers being most likely to report dairy avoidance in their household, at 26 percent of under-35s.
Mintel research highlights the importance of ethics and the environment for the milk and dairy industry as a third (33 percent) of milk, milk drinks and cream users are interested in products in a bottle/pot made wholly/partly of recycled plastics. Meanwhile, a quarter (27 percent) of users are interested in products with a guarantee of sustainable farming. Around one in seven (15 percent) users would be interested in products with an on-pack statement of how many days the animals spent outside.
Finally, as many as 40 percent of standard white cow’s milk users would pay more than £1.20 for a four-pint bottle of milk, up from 35 percent in 2018. The price for a four-pint bottle of standard own-label milk stood at around £1.10 in April 2019, the same as in March 2018.