
MRM Research Roundup: End-of-April 2019 Edition
19 Min Read By MRM Staff
This edition of Modern Restaurant Management (MRM) magazine's Research Roundup features F&B companies views on mobile technology, the cashless culture and OpenTable's best bruch restaurants.
F&B and Mobile
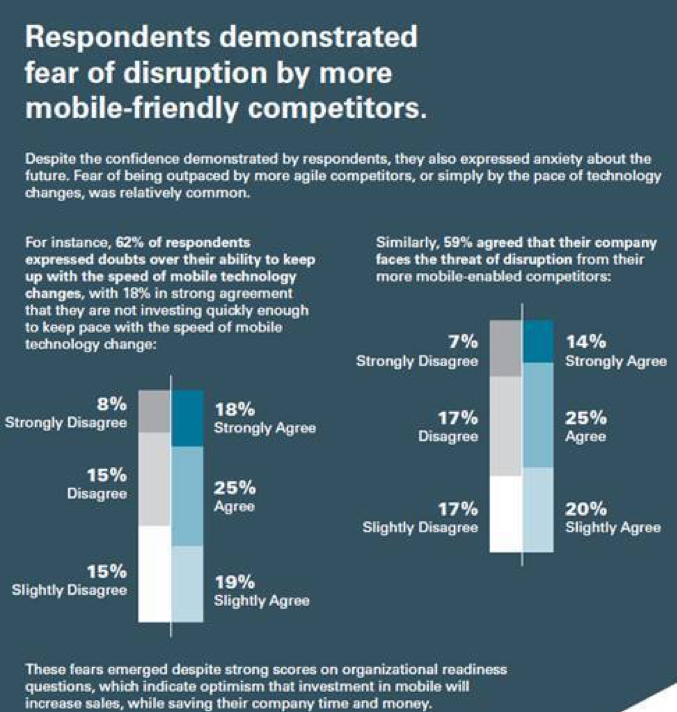
A recent survey of food and beverage leaders highlights that while a large percentage feel confident in their restaurant’s current use of mobile technology, only 48 percent feel prepared to capitalize on future innovations. Sixty-two percent of respondents expressed doubts over their ability to keep up with the speed of mobile technology changes. And more than half (59 percent) agreed that their company faces the threat of disruption from their more mobile-enabled competitors.
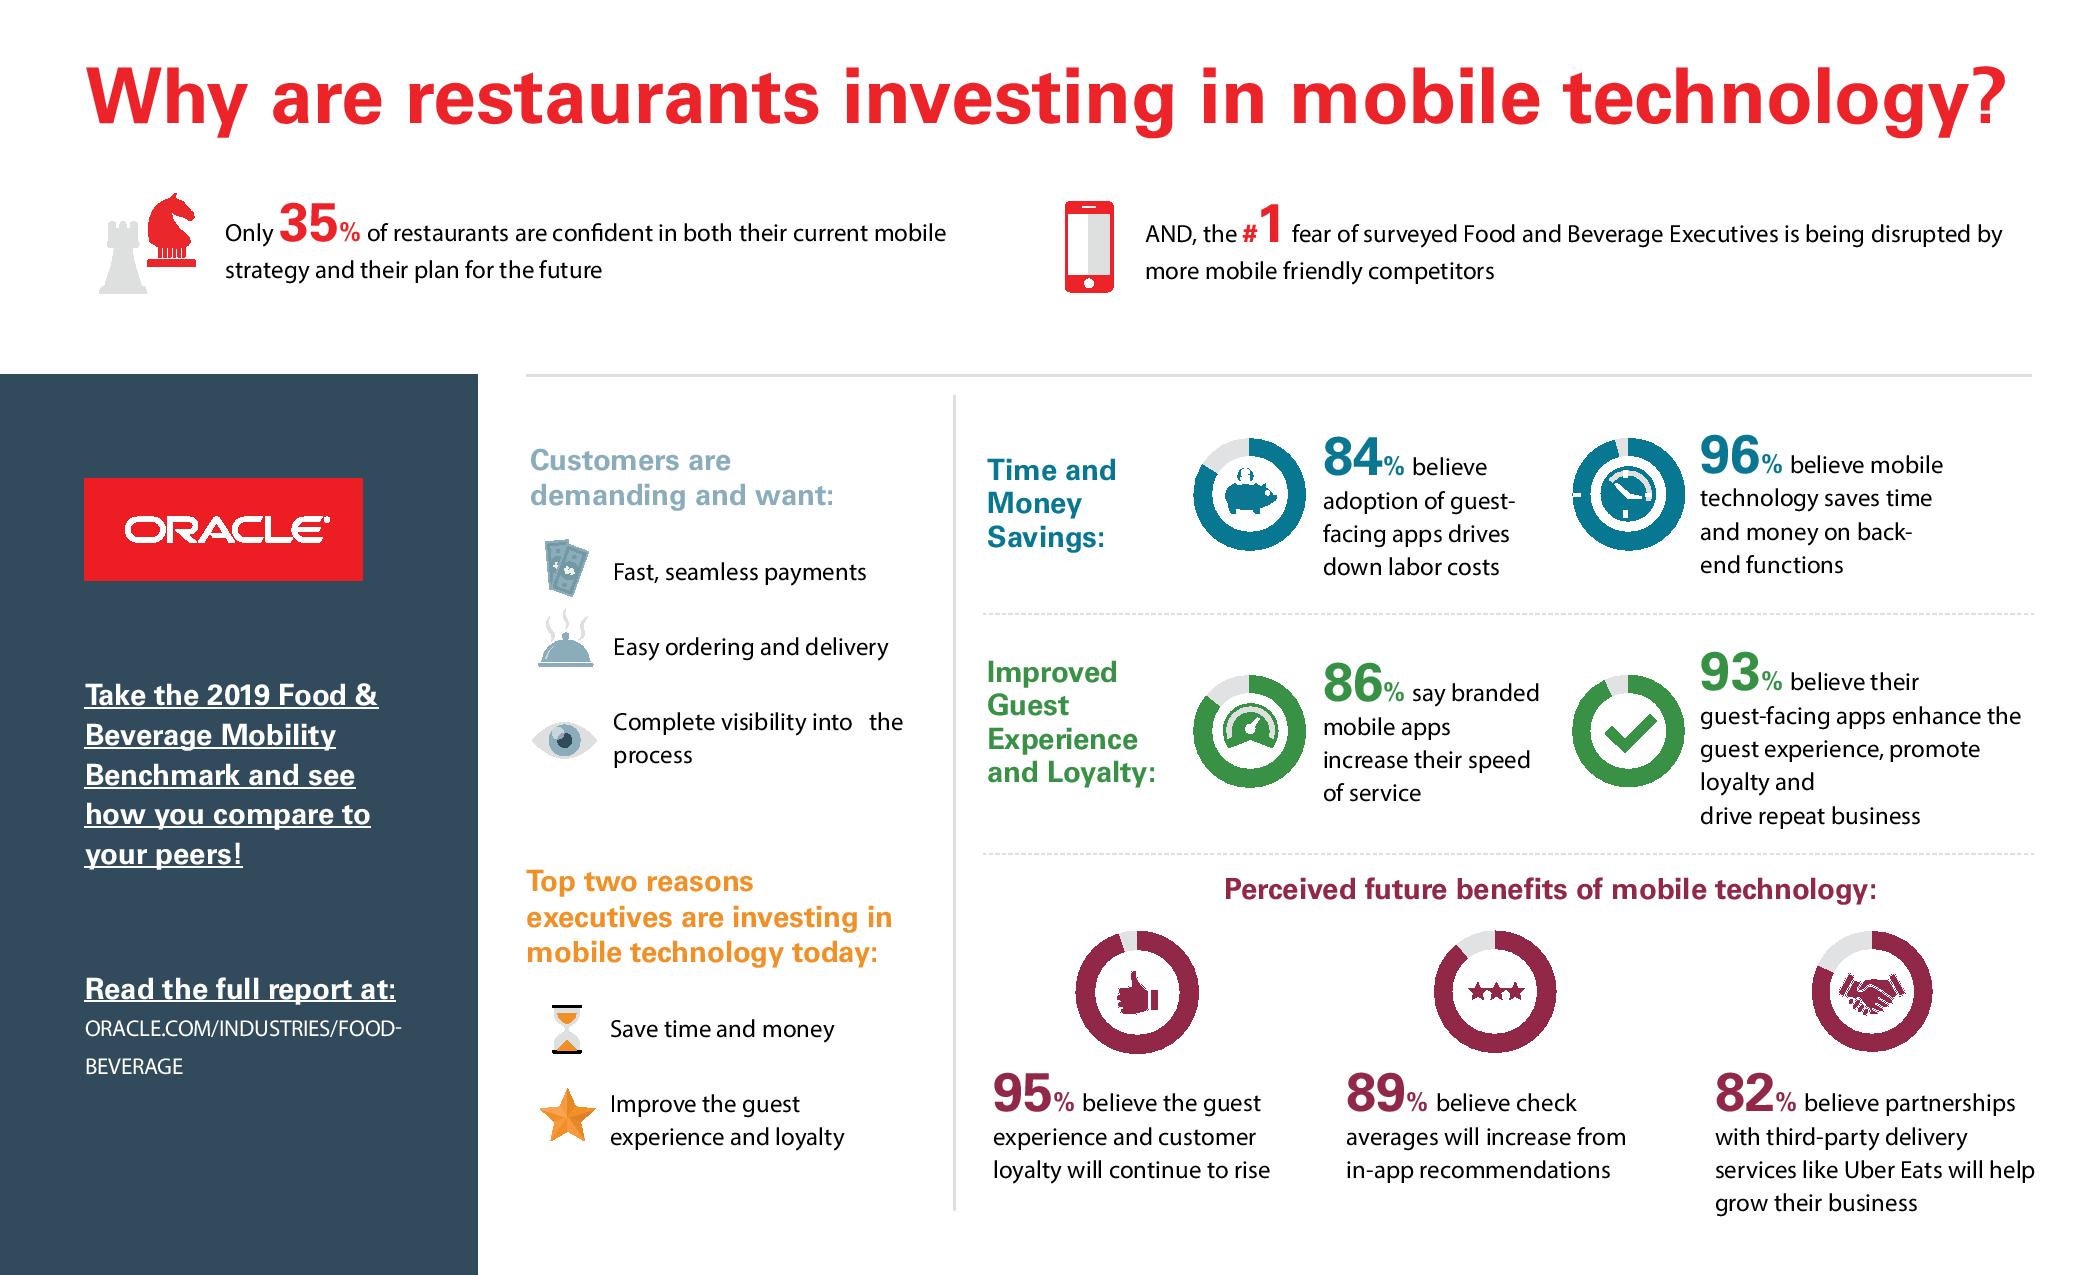
“The rise of mobile ordering and on-demand food delivery services are completely changing the restaurant and guest experience,” said Simon de Montfort Walker, senior vice president and general manager for Oracle Food and Beverage. “In order to remain relevant to a rapidly evolving audience, restaurants must act quickly to modernize their mobile strategy and offerings. Today, the experience a customer has ordering online or from a kiosk can be just as essential as if they were ordering in the store.
The study findings point to a clear and urgent need for restaurants to embrace the right mobile and back-end technology to drive higher ticket value, turn tables faster and enable more cross and upsell. In addition, the findings highlight the need to embrace mobile technology to avoid being outpaced by the competition, help cut labor costs and improve the guest experience – all critical components to revenue growth.
Cutting Costs, Saving Time Equals Increased Revenues
Restauranteurs are investing in mobile technology to cut costs and save time in areas such as hiring less serving staff but more runners, keeping a close eye on stock levels to avoid over-ordering and waste, and the ability to quickly change the menu and offer specials when there is an over-stock of inventory.
84 percent of food and beverage executives believe the adoption of guest-facing apps drives down labor costs
96 percent agree, with 40 percent strongly agreeing, that expanded mobile inventory management will drive time and money savings
Improving Loyalty and the Dining Experience
Today’s foodies are satiated with choices. In addition to great food, what drives their loyalty is easy ordering and delivery, fast, seamless payments, and a personalized experience.
86 percent of operators say branded mobile apps increase their speed of service and therefore revenue
93 percent believe their guest-facing apps enhance the guest experience, promote loyalty and drive repeat business
Perceived Future Benefits of Mobile Technology
Restaurants are already using mobile devices for table reservations, taking orders, and processing payments, but what value do restauranteurs believe will come from future mobile innovations?
82 percent believe partnerships with third-party delivery services like Uber Eats and GrubHub will help grow their business
89 percent believe check averages will increase thanks to in-app recommendations
95 percent believe the guest experience and customer loyalty will continue to improve
The Road Ahead
While most organizations rated themselves as highly able to meet new consumer demands, an undercurrent of anxiety about the future was also apparent with only 48 percent of respondents reporting that they have the tools they need to meet the mobile demands of tomorrow. The mobility study findings show a clear path for restaurateurs including applying mobile innovation to broader areas such as inventory efficiency, getting new customers in the door, serving them more efficiently, and keeping them coming back.
For this survey, Oracle queried 279 leaders in the food and beverage industry who use mobile technology in their organizations during the summer of 2018. 45 percent of those surveyed were from full-service restaurants, 24 percent from fast casual and 23 percent from quick service. Seventy-one percent of respondents are director level or higher, with 45 percent hailing from companies that generate more than $500M in annual revenue.
To learn more, click here.
Restaurant Rebound
The restaurant industry's sales rebounded solidly during March after stumbling the previous month. Same-store sales growth was 1.2 percent in March and 1.0 percent for the first quarter of 2019. The industry is going through its strongest period of sales expansion since 2015, with four consecutive quarters of positive same-store sales growth, according to TDn2K's Black Box Intelligence™. However, chain restaurants continue to struggle with declining guest counts. Same-store traffic was -1.8 percent during March.
Restaurant guests have many options when it comes to buying food away from home. This means each guest interaction is vital for restaurant brands to develop loyal guests that will help offset this waning traffic trend. But are restaurants delighting their guests and meeting their expectations?
White Box Social Intelligence™ data reveals sentiment has indeed been increasing for restaurant guests in recent months. Guest sentiment based on chain restaurant food became more positive during each month in the first quarter compared with March of 2018. The same is true for guest sentiment based on restaurant service. This is especially important since TDn2K research continues to show that service is a key differentiator for top performing brands based on sales growth. A common characteristic of these top performers in recent years has been delivering an experience that is driving higher service sentiment scores.
Although intent to return positive sentiment is declining slightly year over year, the overall values remain extremely high.
Connecting the Dots
What food items do guests of top performing restaurant brands love? What food offerings have the highest guest sentiment among the brands with the largest same-store sales growth during the first quarter of 2019?
In the case of guests of top performing limited-service brands (those in quick service and fast casual), the terms with the highest net sentiment during March were the following: sandwich, BBQ, salad, fries and chicken. Most of these terms typically come to mind when thinking about limited-service restaurants. But there are guests of these segments that are looking for healthier options. Top performing brands in these segments are providing craveable salad options as a way to attract guests and drive sales.
In the case of full-service brands (casual dining, family dining, upscale casual and fine dining), the food terms with the highest guest sentiment during March were the following: sauces, desserts, steaks, parmesan and avocado. It is interesting that in the case of full service, the terms that get the highest positive sentiment were mainly ingredients versus meals. The details such as the sauce or a topping included in a dish can make all the difference in delighting the guest. Additionally, once guests have decided to sit down at a full-service restaurant and spend a little more time and money, desserts are enhancing the experience and can be powerful drivers of positive sentiment.
Top and Bottom DMAs
March once again proved Orlando, FL has the restaurant guests with the most positive sentiment among the largest metropolitan areas in the country. Orlando topped the list with the most positive net sentiment based on restaurant food, beverages, service, ambiance and value.
As has been the case in recent months, Los Angeles again emerged as having guests the least satisfied with their chain restaurant experiences. During March, this market had the lowest net sentiment based on service, beverages and value. Raleigh is also frequently on the list of guests with lowest restaurant sentiment. During March, guests in this market had the lowest sentiment regarding restaurant ambiance, food and their intent to return to the brands they mentioned during the month.
Best and Worst Regions
The relative strength of chain restaurants can be perceived not only at the national level, but throughout the country as well. All eleven regions of the country tracked by TDn2K reported positive same-store sales during March. This is something that has only happened four times in the last three years, all of them within the last twelve months.
As could be expected, guest sentiment is also positive in all regions of the country. For the fourth time in the last five months, over 50 percent of all restaurant online mentions and reviews were positive in each of the eleven regions.
Florida not only has the market with the highest sentiment on multiple restaurant attributes, it was also the region with the most positive sentiment overall during March. It was the only region in which over 60 percent of all mentions and reviews were positive. The Mountain Plains and Western region rounded up the list of the most positive regions during March.
The regions with the least positive restaurant sentiment during March were the Southwest, New England, and New York-New Jersey. The last two are frequent inclusions in the list of least positive sentiment each month.
Restaurant Technology Report: Empowering Diners
Hospitality Technology released its 21st annual Restaurant Technology Study, titled, “Exponential Digital Drives Quantum Convenience.” For more than two decades, Hospitality Technology has charted the budgets, business drivers and investment plans of restaurant companies across segments and brand sizes. The study has chronicled the growth of restaurant IT over a course where the pace of change and technological advancement has been exponential.
Data from previous reports shows that in the not-far-distant past, the key charge for IT deployments was to reduce operating costs and increase efficiency. With that operational focus, in 2008, casual dining establishments were leading in technology innovation, with 43 percent saying they led the competition compared to 32 percent of QSRs that claimed to be leaders. In 2019, the quick service space includes fast casual concepts. Combined, the vast majority (93 percent) claim to feel they lead in innovation. This isn’t necessarily false pride – as the more successful a brand is, the more likely they have been referred to as “technology companies that serve food.”
The 2019 study reveals that restaurants are placing hyper-focus on empowering diners with service options. Through illustrative and written analysis the report charts the budgets, strategy and investments of restaurant technology from what happened in 2018 to what is planned for 2019.
Key findings include:
- Restaurants are planning hardware upgrades with the largest portion of IT budgets being allocated here (23 percent). A telling byproduct of the fervor for delivery options is that the second greatest amount of IT spend will go to third party providers (21 percent).
- As a strategic goal for technology, engaging with third-party delivery providers is a priority for 12 percent of overall respondents, but restaurants that consider themselves innovators in digital customer engagement put higher urgency here with 33 percent naming it top goal.
- The drive for providing new service and delivery options for diners crystallizes in investment plans for 2019. The top six investment areas for restaurant innovation is dominated by providing guests with personalized experiences. These include: third party delivery integration (48 percent), mobile payments (47 percent), digital ordering (45 percent), tableside ordering (34 percent), predictive analytics (34 percent) and interactive kiosks (32 percent).
- These investment plans are mirrored in software rollout plans. The focus will be on digital ordering software upgrades and changes with 59 percent of restaurants putting IT dollars here. This is tied with mobile payments which sees 25 percent of restaurants adding the functionality for the first time, 26 percent making enhancements and another 8 percent changing suppliers.
- As goes software, so goes hardware. Looking at installation plans for hardware POS terminals, kiosks and tablets take the lion’s share of investment in 2019. Providing guests with the option to self-serve has driven more than a quarter of restaurants to plan to add kiosks for the first time and 19 percent of restaurants are adding tableside tablets for payment.
- The leaders in the restaurant industry are proving that the focus on digital will be the source of growth. These digital components will be bolstered by data on both the customer side – to understand what guests want, where and how, and on the business side – to monitor, react and predict with attention on KPIs.
To download the 2019 Restaurant Technology Study,: click here.
Understanding the Cashless Culture
In Cashless Culture: the Marketer’s Guide to the Emerging Cashless Consumer, consumers grapple with the future of cash, cards, mobile, and everything in between. The surprising findings uncovered significant insights for the grocery, retail and restaurant categories in particular.
The biggest takeaway? We have a long way to go before we give up our cash completely. And yet most of us seem resigned to eventual digital domination: Over 50 percent of those surveyed anticipate paying for goods and services via fingerprint scanning or facial recognition within ten years.
Among the study’s compelling data points:
Cash and Cards Are Far From Dead
- 76 percent still carry cash daily
- 55 percent hate the idea of life without cash
We’re Still New at Mobile Payments, But Younger Consumers are Leading the Way
- 58 percent of those using mobile payments have only started in the past year
- 45 percent of those over 40 have never used mobile payments; while 22 percent of those under 40 use it daily
Significant Barriers to Going Cashless Remain:
- 45 percent say there is no reason to use mobile payments
- 63 percent say clear and consistent visual cues around mobile payment options are needed at P.O.P.
'The Stadium of the Future'
Sports fans have had it with long concession wait times and are willing to pay for more modern conveniences and experiences shows a new global study from Oracle Food and Beverage. Nearly all—94 percent—of respondents noted they buy food and beverages while at sporting events and 58 percent said they would spend even more if they didn’t have to wait in lines. Seventy-six percent added that in-seat delivery would improve their stadium experience.
“There is nothing more frustrating for sports goers than missing part of the game while they wait for a hot dog and beer,” said Simon de Montfort Walker, executive vice president and general manager, Oracle Food and Beverage. “Stadiums must modernize the ordering and delivery of food and beverages to improve the experience and keep fans coming back. The survey shows that fans are amazingly tech-savvy and expect to bring the same conveniences they have in their everyday lives – self ordering, food delivery, mobile payments, etc. – to their favorite sporting venues.”
Modern Technology Scores with Fans
The sports industry is fast-paced and stadiums need to keep up with the growing demands of their extremely loyal fan base. The survey showed that when it comes to food and beverages, fans would welcome self-ordering from kiosks and mobile apps to speed the process. And much like they have come to expect from emerging food delivery services – they want the food to be delivered to them in their seat, so they spend their time watching the game. And, they expect all this to be paid for via the click of a button, via cashless or modern payment systems or loaded tickets.
While fans were also open to AR/VR to view menus and for drone food delivery, they drew the line at robots delivering their food. Sixty-three percent of fans were also interested in joining a loyalty program to get even more benefit from the game-day outing.
“Venues can no longer think of game-day as a moment in time,” added de Montfort Walker. “It’s an opportunity to engage fans before, during, and after a game in an easy and seamless manner for a fan. For example, loyalty programs members may receive a coupon for a $1 hot dog during the seventh inning stretch at a baseball game or free wings at a venue owned restaurant outside the stadium after a game. It’s a win-win that rewards the fan and helps the venue move product and increase revenue.”
The study of more than 2,000 sports fans from the U.S., UK, Germany, Australia and Canada, highlighted what fans expect from their game-day experience:
To enjoy food and drink: Seventy-two percent of US fans always or usually purchase food at a game while 76 percent buy a beverage, spending an average of $42 per game. Australia fans spent an average of $34 per game and Canada, $33. The total for the UK and Germany combined was €30.
To stay in their seats: Nearly 30 percent of fans globally ranked being able to stay in their seats as the most important way to improve the food and beverage experience at the stadium.
Shorter wait times: Fifty-nine percent of fans would spend more on concessions if their wait time were cut in half. In fact, 10 minutes was the maximum acceptable wait time to buy food and drinks according to those surveyed which is why 74 percent said they would like to pick up an order from an express line at a concession stand if offered.
Easier ordering options: Sixty-eight percent were highly interested in using a mobile application to order food and beverage, and 63 percent said they would use a self-service kiosk, mobile app or tablet for purchases.
Futurist technology that doesn’t disrupt the game: Fans are already using paperless tickets and contactless payments, but are less interested in too-futuristic technology. For example, 95 percent of fans were not interested in receiving an order from a robot but 41 percent said they would be likely to use drone delivery or voice activated virtual assistants. Thirty-seven percent would use augmented reality to see food options.
Loyalty rewards: Fans globally are interested in joining a loyalty rewards program with Germany and the US leading the way at 70 percent and 69 percent. However, less than 4 percent actually participate in these programs in the US and 1 percent in Canada, showing that more needs to be done to engage the fans and make it worth their while.
Mobile conveniences: Cashless payments and paperless tickets proved to go a long way in improving the fan experience for survey respondents.
Click here to download the full report.
A Little Loyalty Goes a Long Way
As most businesses want to collect more and more data from customers to benefit their marketing efforts, they may be surprised to learn—just in time for national “Get to Know Your Customer Day” on April 18, 2019—that most customers actually don’t want to get that chummy. In fact, according to a new U.S. survey conducted online by The Harris Poll on behalf of Wilbur, a new, ultra-simple loyalty program designed by Smart Transaction Systems, most Americans (71 percent) would be less likely to join a loyalty rewards program that collects personal information (e.g., address, account information), with 27 percent saying they would be much less likely.
In addition, most Americans (58 percent) are also less likely to join a customer loyalty program that requires them to download an app to access the benefits, with 26 percent saying they would be much less likely.
“These survey results prove that U.S. consumers are becoming much more selective about the loyalty programs they join and, I believe, are ultimately more loyal to brands that respect their personal privacy,” said Ray Clopton, President and CEO of Wilbur and Smart Transaction Systems. “It is really important for businesses to pay attention to what their customers want—especially when developing a loyalty program—and I think these results could not be timelier given that we’re about to celebrate ‘Get to Know Your Customer Day.’ Yes, businesses should get to know their customers—but as people. Not as a slice of a database or a spreadsheet column.”
The survey also found that a majority of Americans (76 percent) are more likely to join a customer loyalty program that collects only their name and phone number, with 32 percent responding they would be much more likely to join. Americans also said they were more likely to join a customer loyalty program that does not require them to carry a physical card (79 percent), with 34 percent saying they would be much more likely to join.
“What these results tell us is that customers don’t want to join a loyalty program that asks for too much data or requires them to carry another card in their wallet or download another app on their smartphone,” Clopton says. “We have been hearing this from customers for years, which is what inspired the creation of Wilbur and how it works. But it feels official now that a reputable research company like The Harris Poll has validated our assumptions and informal research.”
Wilbur is a privacy-friendly, super simple loyalty program designed for busy business owners who don’t have extra time to manage a loyalty program, and customers who don’t want to fill out another form, carry another card or download another app. The program only collects customers’ first name and phone number, and only texts them when they have earned or redeemed rewards.
This survey was conducted online within the United States by The Harris Poll on behalf of Wilbur from April 4-8, 2019 among 2,003 U.S. adults ages 18 and older.
'Defining the Coupon & Value Restaurant Consumer'
Valassis released new research via its “Defining the Coupon & Value Restaurant Consumer” study, providing insights for restaurants and industry marketers on how to attract modern diners.
In-home dining has become more prevalent as a result of easier access to meal kits and new food delivery options. Consumers eat out less frequently each year – 14 percent less compared to 2000. However, Valassis found restaurants can entice consumers to dine out when there is a better understanding of the restaurant consumer and the use of incentive-based marketing strategies.
To help restaurants understand how consumers make dining decisions, Valassis identified three customer saving profiles – coupon savvy (those that use coupons to find highest quality for lowest price); value seekers (those that typically look for the lowest price); and full price purchasers (those who are willing to pay full price when dining). While these restaurant customers have similar demographics, their purchase behaviors differ. Interestingly, the median restaurant spend of coupon savvy consumers ($19) is closer to the full price purchasers ($20) vs. $15 for value seekers. When it comes to what motivates them, coupon savvy consumers want quality and a variety of options; value seekers are naturally driven by affordability, but also convenience; while full price purchasers seek quality, speedy service and an atmosphere fit for a variety of occasions. Value seekers make up 70 percent of restaurant visits while full price purchasers and coupon savvy make up 17 percent and 13 percent, respectively.
Coupon-users visit restaurants seven times per month on average, compared to non-coupon users who do so just 4.8 times per month. Overall, 77 percent of consumers say they use coupons at restaurants. With this, it is clear that today’s diners are hungry for savings and can be tempted to visit brick-and-mortar locations if incentives are offered.
“Consumers’ desire for savings is strong across purchase categories and the restaurant market is no exception. Our data shows when restaurants make an up-front investment in offering incentives to diners, they see greater ROI and foot traffic gains in the long run, as well as more frequent and lucrative brick-and-mortar visits,” said Dana Baggett, Executive Director – Restaurant, Valassis.“Marketers who expand outside of traditional value-oriented consumers and tap into other demographics via proximity-based advertising strategies, competitive pricing and offers will attract diners and drive consumer spend.”
As the restaurant industry continues to evolve, one facet that remains is consumers are creatures of habit – in fact, 54 percent usually visit the same eatery. While this is good news from a brand loyalty perspective, it also means encouraging them to switch dining locations can be more challenging. However, offers and price promotions can spark behavior change:
- 20 percent of consumers switch restaurants based on promotions or coupons, and 12 percent do so in order to find the lowest price.
- Even when deciding between several restaurants they like, 54 percent will pick the one that offers a coupon, with this number rising to over 60 percent among heavy (weekly) dining visitors.
- 57 percent use coupons for a location they have never visited, with this number peaking for fast casual, family and fine dining restaurants (all 72 percent).
Furthermore, diners appear to be extremely deal-hungry, with 41 percent saying they want to receive coupons at least once per a week. This number rises among millennials (54 percent) and parents (49 percent). How do they want to receive deals? It ultimately boils down to the type of restaurant and consumer. However, in general, Valassis found they have an affinity for both print and digital channels:
Casual Dining Customer
Favorite coupon format: Mail (49 percent); email (48 percent)
Couponing frequency: 36 percent use coupons at least once per week
Willingness to switch: 67 percent will try a new restaurant if a coupon is offered (among heavy frequenters)
Fast Food Customer
Favorite coupon format: Mail (67 percent)
Couponing frequency: 41 percent use coupons at least once per week
Willingness to switch: 64 percent will try a new restaurant if a coupon is offered (among heavy frequenters)
Pizza Customer
Favorite coupon format: Mail (56 percent)
Couponing frequency: 41 percent use coupons at least once per week
Willingness to switch: 64 percent will try a new establishment if a coupon is offered (among heavy frequenters)
To view additional data points from the study, download Valassis’ “Restaurant Coupon Correlations” ebook.
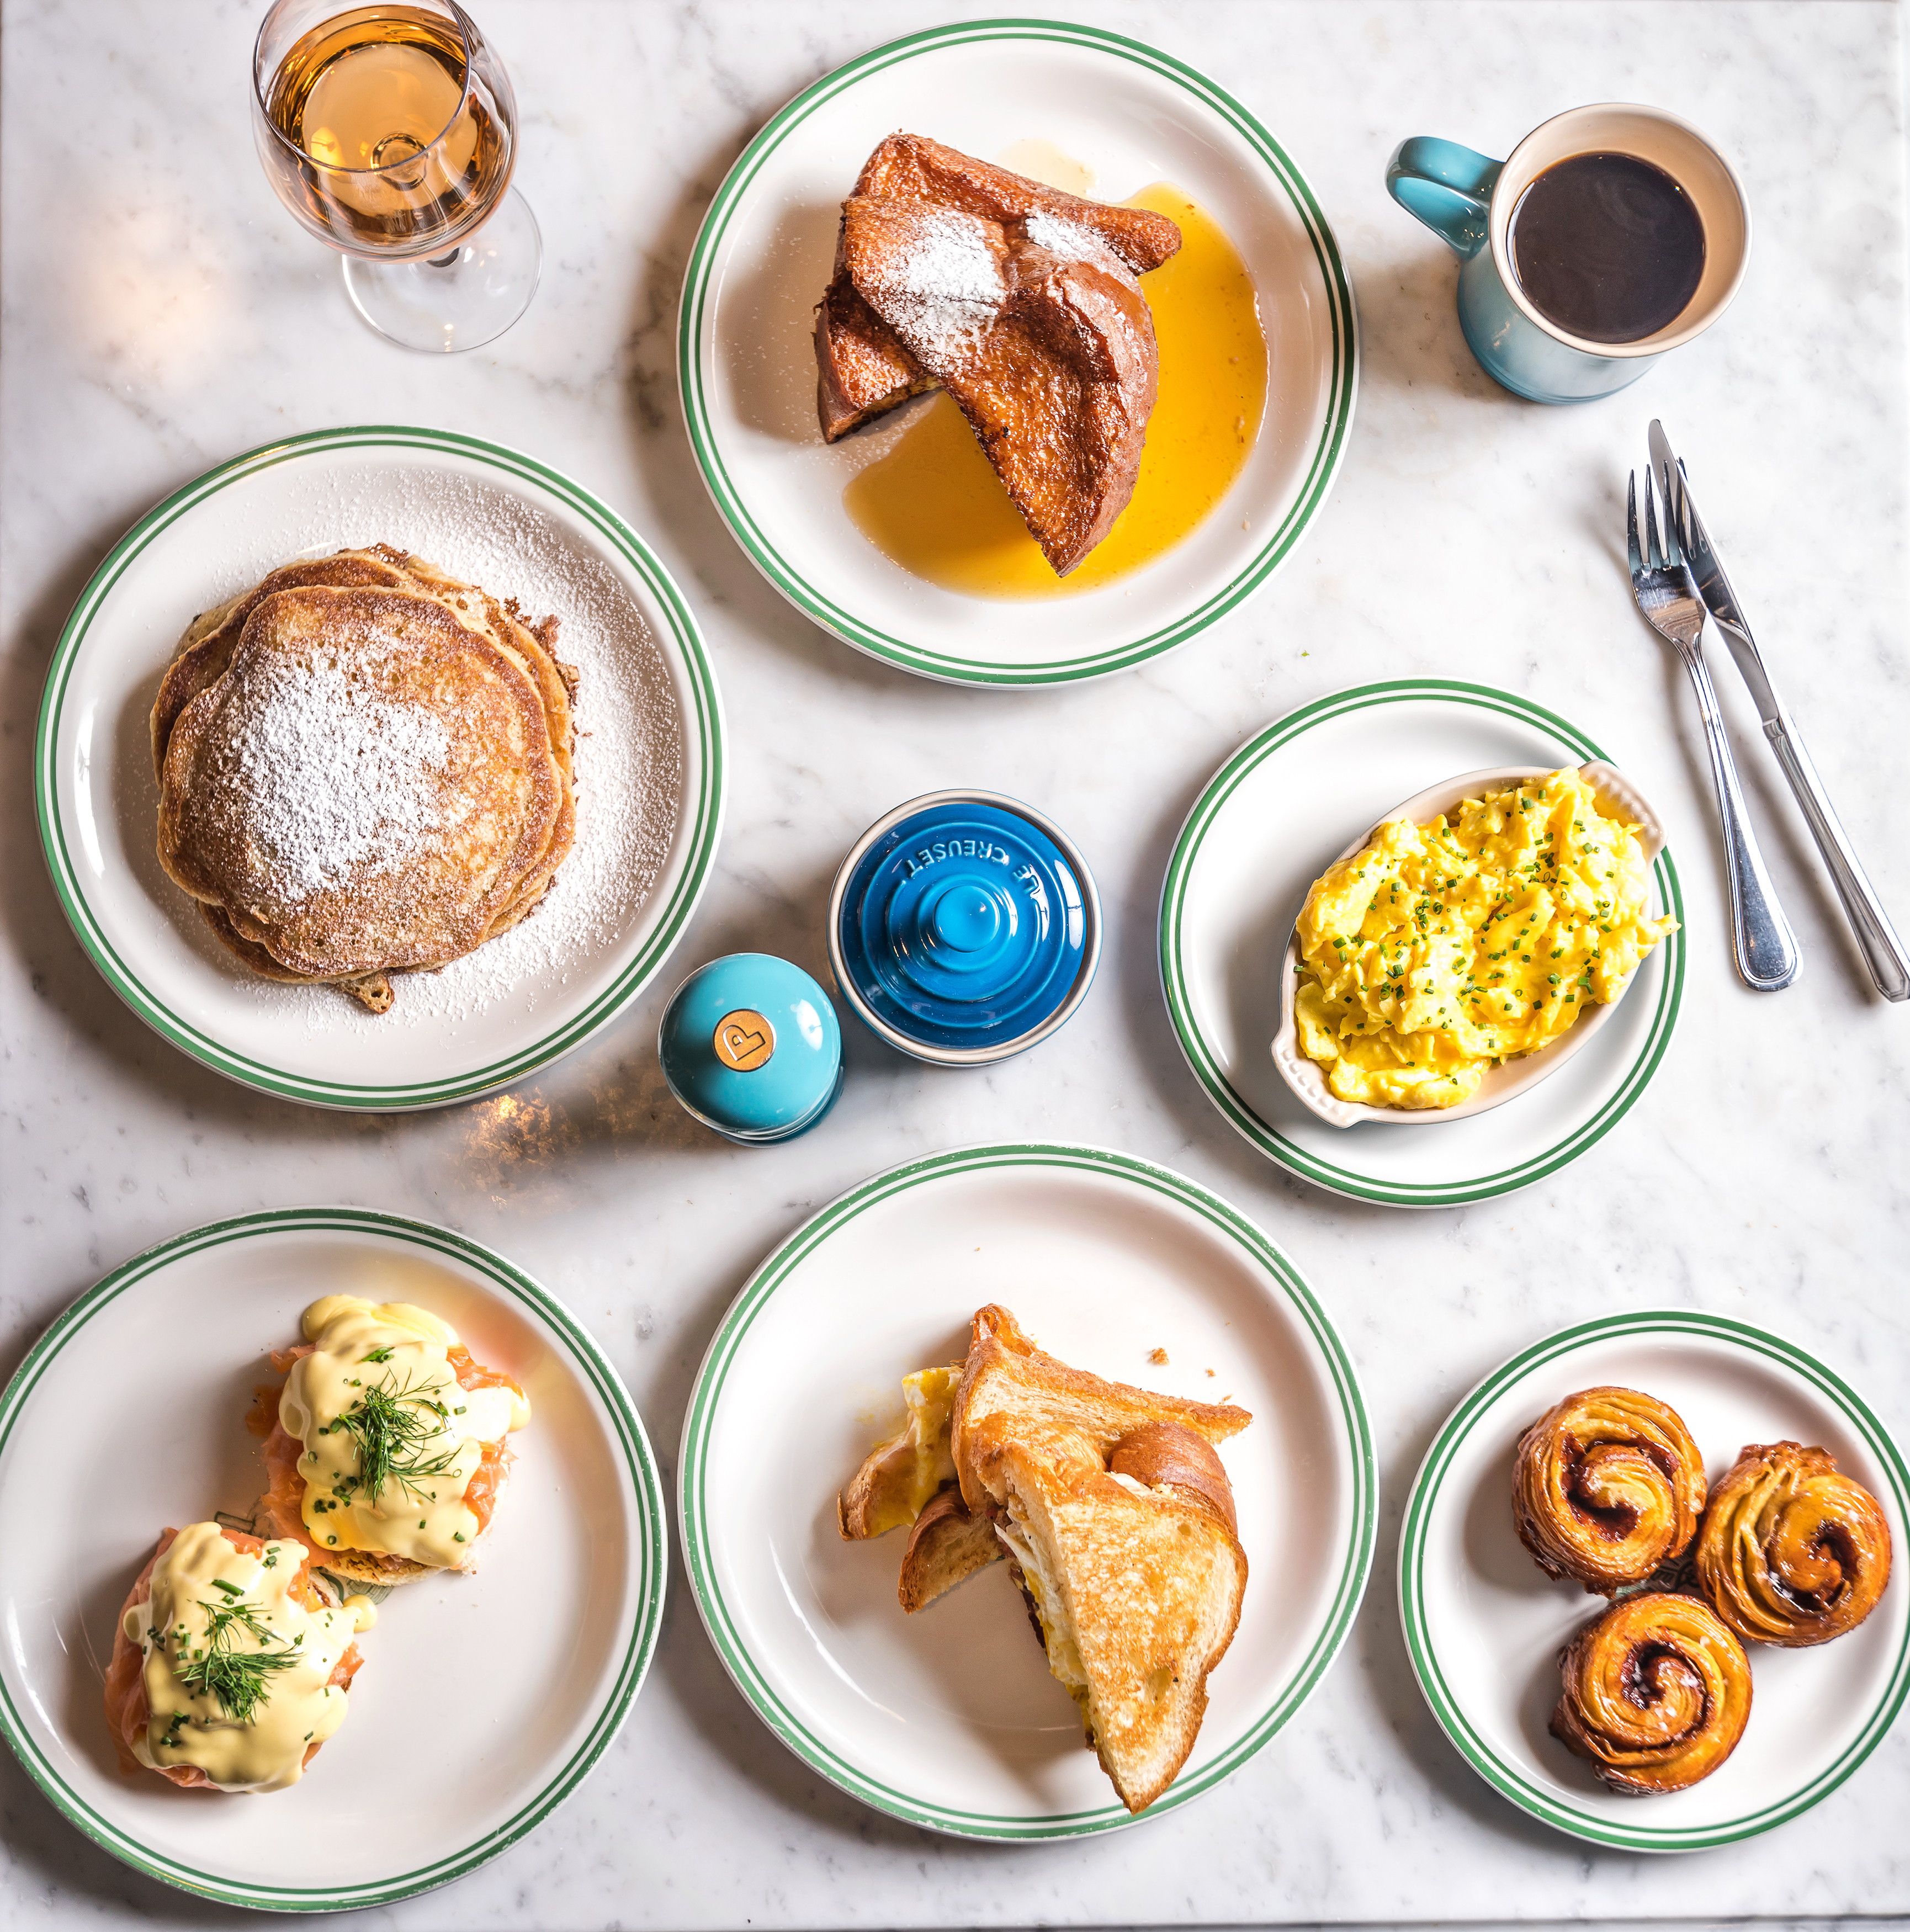
Best Brunch
OpenTable, the world's leading provider of online restaurant reservations and part of Booking Holdings, Inc. (NASDAQ: BKNG), today released its annual list of the 100 Best Brunch Restaurants in America for 2019. OpenTable data shows that 81 percent of diners book their Mother’s Day reservations two weeks in advance, so the list comes at the perfect time to help diners find the best brunch eatery to celebrate the mother figure in their lives. Featuring restaurants coast-to-coast, across 24 states and Washington, D.C., the list is a comprehensive look at the best brunch spots in the country. The Best Brunch Restaurants in America list was culled from more than 12 million verified diner reviews of over 30,000 restaurants in 50 states and Washington, D.C.
From restaurants with magnificent views like Geoffrey's Restaurant in Malibu, Calif., to brunch institutions like Sadelle’s in New York, to acclaimed eateries like Somerset in Chicago, the Best Brunch Restaurants list features a wide variety of restaurants. California is the most recognized state on the list with 16 restaurants honored, followed by New York with 12 winning restaurants and Illinois and Pennsylvania with eight each. Florida, Texas and Washington, D.C. each boast seven winning restaurants and Louisiana claims five honorees.
The annual list comes on the heels of OpenTable’s national #DiningMode campaign, a challenge to diners to set aside their phones while dining with mom and connect with those around them this Mother’s Day. Diners are now encouraged to give moms the gift of being truly present at a celebratory brunch at any of this year's winning restaurants making honoring the mom in your life easy and more rewarding.
“On Mother's Day 2018, we seated more diners than any other day that year and recognize that celebrating mom is a priority for our diners," said Caroline Potter, Chief Dining Officer at OpenTable. “The honorees on this year’s best brunch list are creating experiences that will dazzle her and make embracing our #DiningMode challenge a snap, with sublime drinks and dishes and friendly service. You won’t be tempted to pick up your phone on May 12 at any of these spots.”
The 100 Best Brunch Restaurants list is generated solely from diner reviews collected between March 1, 2018 and February 28, 2019. All restaurants with a minimum "overall" score and number of qualifying reviews were included for consideration. The overall score is made up of unique data points, such as overall diner rating, user klout, total number of reviews and regional overall rating. Qualifying restaurants were then scored and sorted according to the sum of tags for which "brunch" was selected as a special feature.
Based on this methodology, the 100 Best Brunch Restaurants in America for 2019 according to OpenTable diners, are as follows (in alphabetical order):
100 Best Brunch Restaurants in America for 2019
Atchafalaya Restaurant – New Orleans, Louisiana
Balthazar – New York, New York
Bartolotta's Lake Park Bistro – Milwaukee, Wisconsin
Beachcomber Cafe – Crystal Cove – Newport Coast, California
Brennan's – New Orleans, Louisiana
Brennan’s of Houston – Houston, Texas
Bristol Seafood Grill – Multiple Locations
The Butcher, The Baker, The Cappuccino Maker – West Hollywood, California
Bud & Marilyn's – Philadelphia, Pennsylvania
Café Ba-Ba-Reeba – Chicago, Illinois
Cafe Fiorello – New York, New York
Cafe Luxembourg – New York, New York
Cafe Monte – Charlotte, North Carolina
Cappy's Restaurant – San Antonio, Texas
Carmine's – 44th Street – New York, New York
Catch LA – West Hollywood, California
Chart House Restaurant – Weehawken, New Jersey
Chez Zee – Austin, Texas
Cookshop – New York, New York
The Copper Hen – Minneapolis, Minnesota
The Dandelion – Philadelphia, Pennsylvania
The Dining Room at Salish Lodge & Spa – Snoqualmie, Washington
Duke's – Huntington Beach, California
Emmaline – Houston, Texas
Farmers & Distillers – Washington, D.C.
Farmers Fishers Bakers – Washington, D.C.
Farmhouse at Roger’s Gardens – Corona Del Mar, California
Founding Farmers – Multiple Locations
The Gage – Chicago, Illinois
Gandy Dancer – Ann Arbor, Michigan
Geoffrey's Restaurant – Malibu, California
Gertrude's – Baltimore, Maryland
Giada – The Cromwell – Las Vegas, Nevada
Grace's – Houston, Texas
The Grand Marlin of Pensacola Beach – Pensacola, Florida
Great Maple – San Diego, California
Green Valley Grill – Greensboro, North Carolina
The Hamilton – Washington, D.C.
The Hampton Social – River North – Chicago, Illinois
Harbor House – Milwaukee, Wisconsin
Hell's Kitchen – Caesars Palace Las Vegas – Las Vegas, Nevada
The Henry – Phoenix, Arizona
HEXX kitchen + bar – Las Vegas, Nevada
Ida Claire – Addison, Texas
The Ivy – West Hollywood, California
Jake's Del Mar – Del Mar, California
Kyle G's Prime Seafood – Jensen Beach, Florida
Lafayette – New York, New York
Lake Elmo Inn – Lake Elmo, Minnesota
Le Diplomate – Washington, D.C.
Le Moo – Louisville, Kentucky
Lindey's – Columbus, Ohio
Little Goat – Chicago, Illinois
Lola Seattle – Seattle, Washington
Louie Bossi Ristorante – Fort Lauderdale, Florida
The Love – Philadelphia, Pennsylvania
Maggiano's – South Coast Plaza – Costa Mesa, California
Mama's Fish House – Paia, Hawaii
Mere Bulles – Brentwood, Tennessee
Mon Ami Gabi – Las Vegas, Nevada
Muriel's Jackson Square – New Orleans, Louisiana
Oxford Exchange – Tampa, Florida
Palace – Miami Beach, Florida
Palace Café – New Orleans, Louisiana
Parc – Philadelphia, Pennsylvania
Perch LA – Los Angeles, California
Pier W – Cleveland, Ohio
Poor Calvin's – Atlanta, Georgia
Print Works Bistro – Greensboro, North Carolina
The Rotunda at Neiman Marcus – San Francisco, California
Sadelle’s – New York, New York
Sarabeth's Park Avenue South – New York, New York
Shaw's Crab House – Chicago, Illinois
The Smith – Multiple Locations
Somerset – Chicago, Illinois
Spencer's Restaurant – Palm Springs, California
Stanford Grill – Columbia, Maryland
Succotash – Penn Quarter DC – Washington, D.C.
Summer House Santa Monica – Chicago, Illinois
Suraya – Philadelphia, Pennsylvania
Talula’s Garden – Philadelphia, Pennsylvania
Tavern on the Green – New York, New York
Terrain Garden Cafe – Glen Mills, Pennsylvania
The Tropicale – Palm Springs, California
Top of the Hub – Boston , Massachusetts
Tower Oaks Lodge – Rockville, Maryland
Town – San Carlos, California
Tupelo Honey – Downtown Asheville – Asheville, North Carolina
Ulele – Tampa, Florida
Unconventional Diner – Washington, D.C.
Upland – New York, New York
Whiskey Cake – Plano, Texas
White Dog Cafe – Wayne, Pennsylvania
Willa Jean – New Orleans, Louisiana
X2O Xaviars on the Hudson – Yonkers, New York
Yank Sing – Rincon Center – San Francisco, California
The complete list may also be viewed here.