
MRM Research Roundup: Cravings, Pint Prices, and Swangy
19 Min Read By MRM Staff
This edition of Modern Restaurant Management (MRM) magazine's Research Roundup features dining visit trends, US fast food market performance, menu price inflation, Met Gala dining stats, 50-plus buying power, Green Restaurant Awards, and the happiness of small business owners.
More Personalized Loyalty Thanks to AI
The 2026 Paytronix Loyalty Report finds that the brands pulling ahead in 2026 have stopped competing with points-based programs and started building personalized experiences driven by AI and first-party data that their competitors can’t replicate. The report evaluates loyalty program success across nine restaurant and c-store concepts to reveal exactly how this relationship between engagement frequency and business results plays out across different customer segments and why investing in unified data pays serious dividends.
A loyalty program’s data strategy is only as powerful as the business outcomes it drives. While real-time personalization and AI powered decisioning create the technical foundation for modern loyalty, the ultimate test is whether these capabilities translate into measurable guest value over time. Recent Paytronix client data reveals exactly how this relationship between engagement frequency and business results plays out across different customer segments and why investing in unified data pays serious dividends.
Loyalty programs across the restaurant and convenience industry told an interesting story in 2025. The concepts best built for frequency (Beverage & Snack, Specialty, and Sandwich/Mexican) held their ground or improved, with active rates between 66 percent and 72 percent. Snack concepts specifically had the breakout year, jumping 18 percent in active rate and nearly doubling their share of high-engagement members.
Family Dining quietly held flat, which is its own kind of win. This signals higher-end operators are finding ways to make loyalty feel relevant despite low visit frequencies.
The harder story is in the occasion-driven and high-footprint segments. Bar & Grill dropped 13 percent in active rate, with nearly three in four new members never returning within 90 days. Gasoline brands saw a 22-point decline, though the context matters: their total membership base grew by more than 1.5 million, suggesting rapid enrollment outpaced onboarding, rather than existing members walking away.
Casual Dining dipped below the 50 percent active rate benchmark for the first time, a signal worth watching as it shows programs that are enrolling members but not yet giving them a compelling enough reason to come back.
The through line across all nine concepts is the same challenge in different forms: signing people up is only half the job. The 90-day window after enrollment is where loyalty is either built or lost, and the gap between joined a program and became a regular remains the most consequential. Getting them back a second time is where loyalty is either built or lost. Getting them back a fourth time is where regulars are made.
Concepts that are winning have found ways to make that window feel personal, rewarding, and worth returning for, and the data suggests the gap between those programs and everyone else is widening.
March Dining Index
“Affordability is driving a QSR stabilization and pressuring full-service,” according to the March 2026 Placer.ai Dining Index. The Index analyzes dining visits at QSRs, fast casual, and full-service restaurants, and the data shows that “macroeconomic headwinds continue to influence dining behavior — putting some categories on more favorable growth trajectories than others.”
Key takeaways:
-
During Q1 2026, the fast casual segment saw a boost, with visits increasing 3.1 percent year-over-year. QSR visits were up 0.1 percent, while full-service restaurant visits were down 1.4 percent.
-
All three segments saw an increase in monthly visits in February compared to the previous year, followed by a drop-off in March. During March, fast casual visits were up 1.5 percent year over year (after being up 5.9 percent in February), QSR visits were down 1.4 percent (after being up 3 percent in February), and full-service visits were down 4.7 percent (after being up 1.8 percent in February).
-
Data also show that weekday visits boosted traffic across all three segments, compared to weekends (Friday-Sunday). For example, fast casual visits grew 4.7 percent year over year on weekdays in Q1, but only 1.3 percent on weekends.
Brand Performance Tracker
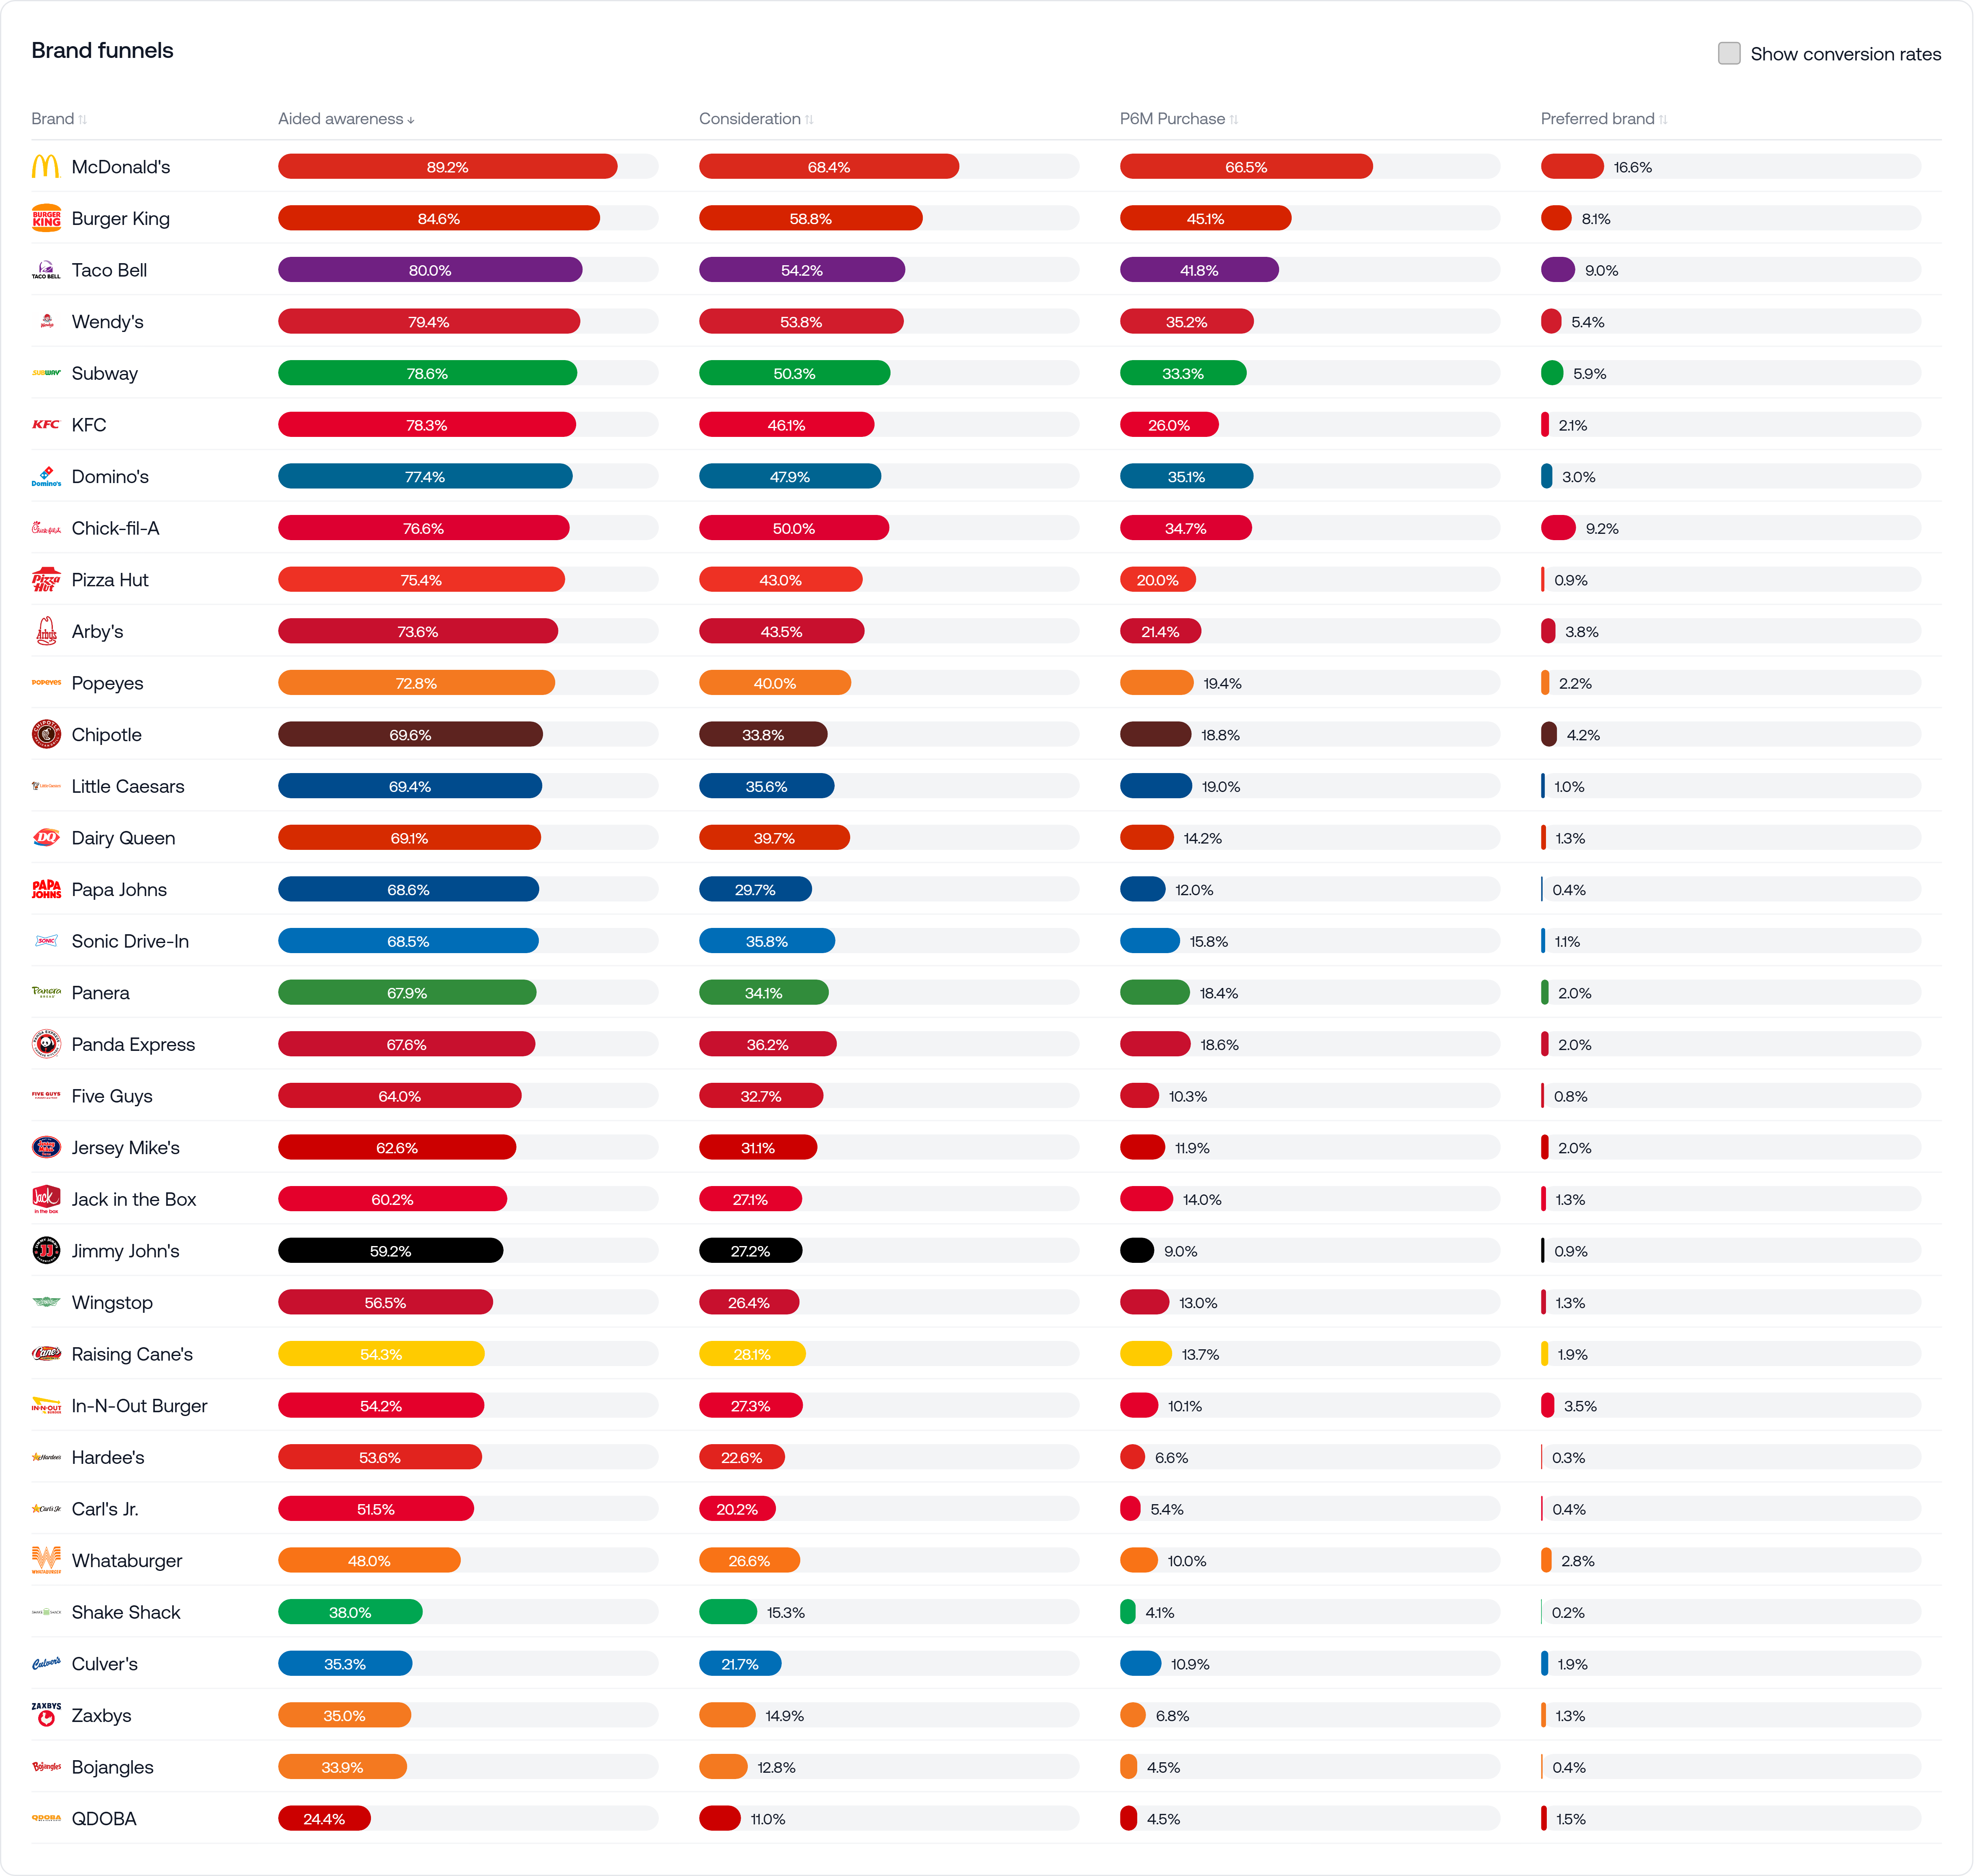
Conjointly expanded its coverage to include US fast food chains, shedding light on brand performance across this highly competitive sector.
McDonald's commands a dominant presence in the US fast food landscape, leading across all tracking metrics: 89 percent aided awareness, 68 percent consideration, 67 percent past-6-month purchase, and 17 percent preferred brand. It is followed by Burger King (85 percent awareness) and Taco Bell (80 percent), reflecting a deeply established and fiercely competitive market with 11 brands above 70 percent awareness and 21 brands above 60 percent. Both perform as strong runners-up on consideration (59 percent and 54 percent respectively) and P6M purchase (45 percent and 42 percent), though they fall behind Chick-fil-A on preferred brand (8 percent and 9 percent respectively). Chick-fil-A stands out as the second-highest preferred brand (9 percent) despite ranking only 8th on awareness, a remarkable efficiency in converting recognition into genuine loyalty. The next tier is rounded out by Wendy's and Subway, which place 5th and 6th across awareness, consideration, and preferred brand.
Some of the most interesting stories are about chains that fewer people have heard of, the hidden gems, but those who have tend to love them. Chick-fil-A converts 65 percent of aware consumers to consideration and achieves a 27 percent conversion rate from past-6-month purchase to preferred brand, the highest among nationally recognized brands. As a regional brand, In-N-Out Burger, despite covering just 54 percent aided awareness, converts 35 percent of purchasers into brand preference and leads the entire category in trust at 91 percent.
Consumer perception data reveals further differentiation across the market. Subway scores highest on healthy options (85 percent) and taste (82 percent) among all tracked brands. Burger King leads on service quality (89 percent), speed (82 percent), and price value (82 percent). McDonald's performs solidly on speed (75 percent) and service quality (76 percent), consistent with its operational scale and reach. Brand trust tells a nuanced story at the top of the market: In-N-Out Burger leads at 91 percent, ahead of Chick-fil-A (89 percent) and Wendy's (88 percent), all outpacing McDonald's (84 percent) despite its unmatched scale.
The findings are based on a syndicated study of 1,427 US adult consumers, with 902 qualifying respondents confirming that they had eaten at or ordered from at least one fast food chain in the past 30 days. Participants were recruited via Conjointly's panel network and compensated for their time, with the sample weighted to national demographics to ensure findings are market-representative.
March Menu Price Monitor
Toast released its March Menu Price Monitor offering a granular view of how inflation is truly impacting restaurant menus. The monitor shows coffee prices are continuing an upward trend, while other categories like wings and burgers see slight dips.
Highlights include:
-
☕️ Regular Coffee Prices Perk Up: The median price of regular coffee in March was $3.69, up 1.1 percent from February 2026. Year-over-year, prices have jumped 5.4 percent since March 2025, the highest increase for this category since April 2025.
-
🧊 Cold Brew Prices Stabilize: The median price of cold brew in March was $5.58, which remained flat (0.0 percent) from February 2026. Year-over-year, prices are up 3.3 percent since March 2025.
-
🍔 Burger Prices Dip Slightly: The median price of a burger in March was $14.63, down 0.1 percent from February 2026. Year-over-year, prices are up 2.5 percent since March 2025.
-
🍗 Chicken Wings Prices Cool Off: The median price of chicken wings in March was $13.88, down 0.2 percent from February 2026. Year-over-year, prices are up 1.6 percent since March 2025.
-
🌯 Burrito Prices Hold Steady: The median price of a burrito in March was $13.50, which remained flat (0.0 percent) from February 2026. Year-over-year, prices are up 1.8 percent since March 2025.
-
🍻 Beer Prices See Modest Rise: The median price of a beer in March was $6.52, up 0.5 percent from February 2026. Year-over-year, prices are up 1.9 percent since March 2025.
The Price of a Pint
In honor of National Beer Day, Toast released a report analyzing data from restaurants and bars to see how much Americans are paying for a pint in 2026. The report highlights a shifting landscape for beer lovers, with the national median price of a beer reaching $6.52 in March 2026 – a 1.9 percent increase since March 2025.
Among the highlights:
🗽The $9 Pint has Arrived: New York City is the first and only major city to cross the $9 threshold, with a median price of $9.16.
📈High Growth Markets: While national prices rose moderately, price inflation was sharpest in Philadelphia (+3.3 percent), Nashville (+3.2 percent), and Washington, D.C. (+3.0 percent).
💸Finding a Deal: San Antonio remains the most affordable city for beer at $5.99 and was the only major city to see a year-over-year price decrease (-0.4 percent).
☀️Peak Seasonality: Beer consumption peaks in May, with order volumes 10 percent higher than the annual average, while hitting a low point in February at 16 percent below the monthly average for the year.
🍻Saturdays Are For The Brews: Saturdays are the busiest days for beer sales. The Saturday before St. Patrick’s Day (March 14) saw orders skyrocket, up 152 percent from the daily average.
Gen Z Flavor Trends
Gen Z is reshaping grocery shopping with a strong appetite for “newstalgia”—nostalgic flavor memories reinvented with bold, modern “weirdness,” such as bright colors, unexpected textures, and global mashups. They’re also driving demand for “swangy” flavor profiles that combine sweet, spicy, and tangy notes in surprising ways. A Q4 2025 consumer survey† underscores this push for innovation, with 65 percent of Gen Z consumers worldwide saying that uniqueness or novelty is either essential or nice to have when buying a product, according to GlobalData.
Gen Z, who are looking for novel and unique experiences, prefers mid-level heat paired with sweetness, seeks out global spices, and increasingly purchases food that tells a story beyond taste. Labels like “sweet + spicy + tangy,” heritage flavors, and clean-label ingredients are now central in Gen Z-influenced product development. For brands, this means indulgence now comes with authenticity, texture, and surprise. Products that evoke warm memories—from childhood or past decades—while adding zesty finishes or tropical accents are seeing traction. From revamped retro packaging to flavor drops that mix cardamom, black currant, chili, or citrus, the trend is transforming what Gen Z picks up on a weekly grocery run.
Manufacturers and key players are responding with a bold alignment between sentiment and offerings. In 2026, Kerry launched its Global Taste Charts, revealing that “swicy” (sweet + spicy) flavors are evolving into “swangy,” as hot honey and spicy mango drive double-digit growth in bakery and confectionery products. These charts, backed by deep consumer and scientific insights, are helping brands anticipate flavor preferences and shorten product development cycles.
Among nostalgic reinventions, Otis Spunkmeyer has introduced cookies infused with classic dessert flavors like Birthday Cake, Double Chocolate Caramel, and Pumpkin Spice Chocolate Chip, aiming to tap into consumers’ memories while elevating traditional formats through premium ingredients. The Graceful Cookie Co. is similarly offering flavors like Blueberry Pie, Lemon Cheesecake, and Strawberry Milkshake alongside heritage staples. Citrus flavors like lemon burst and yuzu are often used as the “twist.”
In beverages, classic soda profiles are being revived with better-for-you twists: Poppi released a Shirley Temple variant with lower sugar and added prebiotics; legacy soda brands such as RC Cola and Mr. Pibb are leaning into their simpler, nostalgic flavor profiles. Meanwhile, in global flavor ingredients, star anise, botanical and floral notes, tart tropical fruits such as guava, passionfruit, and woodsy berries are increasingly appearing, often paired with heat or acid to amplify their impact.
Relevance of 50-plus Consumer
Brands have long competed for the attention of younger consumers, but a sweeping new study from Curion, suggests that strategy comes with a significant blind spot. According to Curion’s Insights Poll Pulse 2026 survey of more than 7,000 U.S. consumers, adults 50 and older are not only increasing their spending across key consumer categories, but they are also the final purchase decision-makers in their households. Yet 93 percent say brand messaging fails to authentically reach people like them.
The data tells a story that many brands have yet to act on. Adults 50 and older report increasing their spend over the past year most significantly in food and beverage (32 percent), health and wellness (30 percent), and beauty and personal care (29 percent).
People 55 and older account for more than half of total health spending in the U.S. — 56 percent — while representing just 31 percent of the population. Globally, that cohort contributes more than $8 trillion annually to the broader economy. And yet, among those same consumers, fewer than one in ten say brands market to people like them in a way that feels authentic.
Research directly challenges several assumptions shaping brand strategy
Adults over 50 are active users of smartphones, social media, e-commerce platforms, and telehealth tools and technology ranks among the categories where more than one-third (36.1 percent) say they personally make the final purchase decision.
The notion that this demographic is difficult to reach also falls short. Their media habits tend to be more consistent and less fragmented than younger consumers; the gap lies not in access, but in message resonance. Only 6.5 percent of consumers 50 and older say brand messaging feels authentically designed for people like them. That leaves 93.5 percent who say brands are missing their mark.
The purchase authority this segment holds extends well beyond health and wellness. Curion’s data shows that adults 50 and older are the final decision-makers in household and cleaning purchases (45.8 percent), apparel (44.6 percent), home improvement (35 percent), and technology (36.1 percent). This aligns with broader U.S. consumer data from Morgan Stanley showing that everyday staple categories are where adults over 50 concentrate a significant share of recurring spend and where they wield the most purchasing authority.
In health and beauty, the disconnect between brand positioning and consumer reality is especially visible. Consumers over 55 are not looking to be reminded that they are aging. What they want are products that support vitality, functionality, confidence, and longevity and they are willing to pay for them. Product positioning, however, often remains narrowly focused on anti-aging tropes or skewed toward younger life stages.
According to McKinsey Health Institute research, by 2050 the number of adults over 65 globally will roughly double to approximately 1.6 billion a demographic and economic shift that makes this audience not a niche, but a defining force in the future of consumer categories.
Curion’s consumer insights experts emphasize that closing this gap requires more than symbolic inclusion. Adults over 50 should be prioritized in consumer research recruitment and observed in real-life contexts not only because of their household purchasing authority, but because the way they shop, use products, and integrate wellness into daily routines. Engaging this segment does not require brands to shift away from younger audiences rather expanding the lens.
Global longevity research positions older consumers as one of the most powerful growth opportunities of the next quarter-century framing healthy longevity not as a cost center, but as a high-return investment. The Curion data reinforces that conclusion. The 50-plus consumer is financially strong, curious, engaged, and motivated to invest in well-being. The brands that recognize this, and design for usability, credibility, and authentic relevance, stand to benefit from a segment that is far from past prime.
Curion utilized its Poll PULSE methodology for the poll, which captured over 7,000 real-time consumer sentiments across a nationally representative U.S. sample.
Small Business Happiness
VistaPrint released new research painting a strikingly optimistic portrait of America's entrepreneurs. Despite a year marked by economic uncertainty, small business owners are happy, prepared for growth and embracing the future.
VistaPrint’s 2026 Small Business Happiness Report, based on a survey of 610 U.S. small business owners, finds that 84 percent are currently happy in their role and 83 percent report being happier than when they worked for someone else. The findings offer a clear counterpoint to persistent narratives of small business headwinds, revealing a community that is finding purpose, stability and satisfaction driven from within.
Key findings include:
-
84 percent of small business owners report being happy today, driven by autonomy, passion, and independence
-
74 percent use AI tools at least monthly, with 58 percent saying AI has made them happier as business owners
-
More than 70 percent are confident in their ability to grow or expand in the next 12 months
-
80 percent of small business owners say their employees seem happy to work there; 77 percent report high employee retention, bucking broader labor market trends
-
50 percent say they feel prepared for an economic downturn; 43 percent say policymakers do not fully understand their needs
Running a Business Is Hard, But Worth It
Owning a small business is not without its challenges. Small business owners ranked income uncertainty (41 percent), poor work/life balance (40 percent) and keeping up with evolving business trends (38 percent) as the top three things they dislike most.
Despite these pressures, small business owners are actively choosing this path and finding profound fulfillment in it. Of those who report being happier today than when they first opened a small business, 38 percent attribute their happiness solely to internal, day-to-day factors, rather than external or macroeconomic conditions (11 percent). What’s driving that inner satisfaction? 54 percent cited the freedom to set their own schedule, followed by doing something they love or are passionate about (47 percent) and the ability to control the certainty of their income (35 percent) as the top three things they like most about being a small business owner.
Embracing Innovation: AI Contributes to Happiness
Another internal factor contributing to happiness is small business owners’ strategic use of technology to support their bandwidth. 58 percent of small business owners who use AI regularly are happier now than before adoption. Today, 74 percent use AI at least monthly, with 55 percent using it several times per week or more. 47 percent of small business owners who use AI at least monthly are now deploying it specifically for marketing. Other leading use cases include writing and documentation (56 percent), analysis and problem solving (47 percent), and communication (45 percent). These align closely with the tasks owners find most time-consuming, helping free up capacity to focus on more fulfilling aspects of running their business.
Confidence in Growth Remains Strong
Looking ahead, the outlook among small business owners is decidedly optimistic. More than 70 percent say they are confident in their ability to grow or expand over the next 12 months, with marketing and customer acquisition (51 percent) and business operations (51 percent) topping their list of planned investments, followed by team and staff (34 percent) and technology and automation (34 percent).
That optimism is tempered by a clear-eyed awareness of broader conditions. While half of small business owners say they feel prepared for an economic downturn, 43 percent say policymakers do not fully understand their needs, a reminder that America’s small business owners remain self-reliant by necessity, not just by choice.
Fostering Workplaces Where Employees Want to Stay
Small business owners aren’t just investing in their own happiness, they’re building environments where employees thrive. A full 80 percent say their employees seem happy to work there, and 77 percent report high employee retention, standing in contrast to ongoing workforce challenges at larger companies. It’s a testament to the culture of purpose and connection that defines so many small businesses: when the owner is fulfilled, that sense of meaning tends to extend to the entire team.
Met Gala Dining
Met Gala Week Drives 5x Surge in NYC Private Dining Demand as Spend and Group Sizes Climb
Tagvenue data signals premiumisation of private dining and rising demand for experience-led venues in New York
Demand for private dining in New York City has increased more than fivefold ahead of the 2026 Met Gala, according to new data from venue marketplace Tagvenue – pointing to a broader shift towards higher-value, experience-led bookings.
The platform recorded a 417 percent increase in enquiries for Met Gala week (May 4–10, 2026) compared to the same point in 2025. Crucially, growth is being driven by higher-spend, larger-format events:
Average spend per booking up 52 percent ($2,239 → $3,406)
Average group size up 69 percent (18 → 31 guests)
Alongside rising demand, venue mix is shifting. Rather than traditional private dining rooms, bookers are increasingly selecting design-led, multi-use spaces – including galleries, lofts and studios – that offer built-in atmosphere and reduce the need for additional production spend.
Tagvenue Met Gala Index 2026 — Key Findings
- Private dining demand up 5.2x in NYC year-on-year
- Average party size up 69 percent
- Average spend per event up 52 percent
NYC leads: Over 6x more demand than the next closest US cities (Austin and Chicago)
Venue mix evolving: Galleries, lofts and studios gaining share over traditional dining
For years, private dining demand was primarily driven by location, capacity and price. Tagvenue’s 2026 data indicates a shift towards venue-led experience design, where the space itself reduces the need for external styling, décor and production.
This is driving increased interest in venues with:
- Distinct architecture and layout
- Built-in lighting and visual features
- Flexible, multi-purpose event formats
The result is a redefinition of private dining — from a food-led occasion to a broader experiential format.
Constant Cravings
Cravings hit hardest at 3:42 p.m., according to new research.
A survey of 5,000 Americans, split evenly by state, looked at what cravings look like across the country, finding that the average person gets two cravings a day, with one in four experiencing cravings more often than this (24 percent).
Regardless of the time, six in 10 respondents can’t hold out on their cravings for more than an hour (57 percent) — and one in five give in in 15 minutes or less (21 percent).
Respondents from New Mexico are the champions when it comes to withstanding their cravings the longest, but Maine-dwellers and West Virginia residents give in earlier.
Conducted by Talker Research for EveryPlate, results found that when the hankering hits, those surveyed yearn for comfort food (33 percent), fried foods (22 percent) and salty foods (22 percent).
Comfort food is especially crave-worthy in Michigan (23 percent) and Arizona (20 percent), while soul food is well-loved in Mississippi (12 percent), Georgia (10 percent) and South Carolina (8 percent).
Spicy food gets love from those who live in North Dakota (16 percent), Arizona (15 percent), Texas (12 percent) and seafood is a particular favorite among respondents from Louisiana (13 percent) and Mississippi (12 percent).
Besides sweets and snacks, some of the most-craved dishes include pizza (30 percent), burgers (22 percent), french fries (19 percent), tacos (18 percent) and fried chicken (15 percent).
No matter what they like to eat, nearly two-thirds of Americans would rather satisfy their cravings at home rather than turn to takeout.
This carries over to their grocery habits, too — 35 percent percent said that their cravings from the previous week regularly affect their grocery list for the following week.
On average, those surveyed follow up on cooking a meal based on a craving more than half the time (56 percent).
Those from Maine, Colorado, Louisiana, Maryland and Mississippi cook meals based on their cravings the most.
Satisfying a craving knows no bounds, as nearly half of Americans have spent more than an hour cooking a complex recipe just to satisfy a specific craving (49 percent).
Forty-three percent have even attempted to cook a professional-level dish at home after seeing it online and feeling the need to have it.
However, not all respondents are feeling their skills. Respondents of Arizona (24 percent), Massachusetts (24 percent) and South Carolina (24 percent) are admittedly least confident in being able to come up with a new dish that hits their desired flavor profile.
For many, it’s about resetting expectations. A third of Americans admit that more of the meals they see online are unrealistic for the average person to cook.
Yet, 43 percent of those surveyed who are parents feel guilty at least once a week about not cooking meals that look “influencer-worthy.”
When cooking meals inspired by recipes they see online, the average person estimates that they come about 60 percent close to their vision, although 29 percent admittedly don’t get to a full 50 percent accuracy.
Green Restaurant Awards
The prestigious 2026 Green Restaurant Awards™ recognize the restaurants and organizations in the restaurant industry which have accomplished a high level of environmental achievement in their respective categories. Here are the winners.
Greenest Restaurant
4 Star Certified Green Restaurant® Carvers’ Café at Mt. Rushmore in Keystone, South Dakota has implemented 80 environmental steps and earned 477.65 GreenPoints™, the most GreenPoints™ of any Certified Green Restaurant®. Carvers’ Cafe has on-site solar panels that produce over 57 percent of its annual energy usage, on-site BOH composting, and much more.
Greenest Caterer
4 Star Certified Green Caterer™ Gilded Tomato Company in Rehoboth, MA is the Greenest Caterer in America, earning more GreenPoints™ than any caterer. Gilded Tomato Company has earned 522.20 GreenPoints™ by implementing 67 environmental steps. This caterer on-site solar that offsets 74 percent of its energy usage. Gilded Tomato Company also sources many products locally from its own farm. Recycling batteries, corks, electronics, fluorescent lamps, ink, and soft plastics, along with plastic, glass, aluminum, cardboard, and paper, also helps keep this caterer's waste out of landfills.
Greenest Airport Contractor
With 260 Certified Green Restaurants® across 23 airports, SSP America is significantly improving its restaurants’ environmental impact by decreasing energy, water, and waste.
Greenest Food Contractor
With 167 Certified Green Restaurants® across the U.S., Compass is the greenest food contractor in North America. Collectively, Compass’s Certified Green Restaurants® have taken over 7,700 environmental steps to earn more than 33,700 GreenPoints™.
Greenest Small Restaurant Chain
Barcade’s chain of nine restaurants across the U.S. are all Certified Green Restaurants®. With an average of 47 environmental steps and 212 GreenPoints™ per restaurant, this chain is making significant sustainability strides. Barcade requires each of its new locations to open as a Certified Green Restaurant®.
Greenest University
Harvard University has 19 Certified Green Restaurants® located in Cambridge and Boston, MA. Collectively, these Certified Green Restaurants® have implemented more than 960 environmental steps to earn over 3,965 GreenPoints™.
Greenest University Dining Facility
4 Star Certified Green Restaurant® Connecticut Hall at University of Connecticut in Storrs, CT is the 2026 Greenest University Restaurant. Connecticut Hall has implemented 103 environmental steps to earn 412.85 GreenPoints™. Connecticut Hall has installed low-flow aerators on its hand sinks, saving enough water to fill over 18 backyard swimming pools every year. 100 percent of the dining hall’s lights are LEDs, which use significantly less energy and last longer than other bulbs. Connecticut Hall also offers reusable dishware, keeping waste out of landfills.
Greenest Independent Restaurant
4 Star Certified Green Restaurant® Maine Beer Company Tasting Room, located in Freeport, ME, has implemented 65 environmental steps to earn 406.07 GreenPoints™. This Certified Green Restaurant® is making significant strides in the Energy Category, earning over 238 GreenPoints™ for Energy Star appliances, occupancy sensors, 100 percent LED lights, on-site renewable solar energy that generates over 37 percent of its energy usage, and more.
Greenest NYC Restaurant
4 Star Certified Green Restaurant® Well& By Durst, located in New York, NY, has implemented 72 environmental steps to earn 302.11 GreenPoints™. This Certified Green Restaurant® has 100 percent LED lights, Green-e Energy Certified Green Wind Power that offsets 100 percent of energy usage, and BOH and FOH composting.
Greenest Zoo Restaurant
4 Star Certified Green Restaurant® Komodo Kingdom Cafe at Akron Zoo in Akron, OH has implemented 77 environmental steps to earn 366.94 GreenPoints™. This 4 Star Certified Green Restaurant® is significantly reducing its energy usage with a geothermal heat pump, 70 percent LED lighting, restroom occupancy sensors, strip curtains, and an on-site solar array.
Greenest National Park Restaurant
4 Star Certified Green Restaurant® Carvers’ Café at Mt. Rushmore in Keystone, South Dakota, also the winner of the 2026 Greenest Restaurant Award, is the greenest national park restaurant. Carver’s Cafe has implemented 80 environmental steps and earned 477.65 GreenPoints™, the most GreenPoints™ of any national park restaurant.
Greenest Corporate Cafeteria
4 Star Certified Green Restaurant® Mars Wrigley GIC – Better Moments Cafe, located in Chicago, IL, has implemented 90 environmental steps to earn 362.07 GreenPoints™. This café is making significant strides in the Energy Category, earning 130.88 GreenPoints™ for a heat recovery system, Energy-Star appliances, occupancy sensors, and more.
Greenest K-12 School
4 Star Certified Green Restaurant® Westtown School Dining Room, located in West Chester, PA, is the greenest K-12 School Cafeteria in North America. Westtown School Dining Room composts in back and front of house with an on-site composting program. 40 percent of the main meals this location serves are vegetarian, with another 17 percent being vegan. Westtown School Dining Room also sources a selection of food items locally, including milk, onions, pea shoots, and more.
Greenest K-12 Contractor
Flik Hospitality has 26 Certified Green Restaurants® located across the U.S. in K-12 schools. These Certified Green Restaurants® have collectively taken over 1,100 environmental steps to earn more than 4,985 GreenPoints™.
Reusables & Green Disposables Award
4 Star Certified Green Restaurant® Brodhead Dining Hall at Lehigh University in Bethlehem, PA earned 119.50 GreenPoints™ in the Reusables & Disposables category. This restaurant serves all to-go orders in reusables, supplies reusable dishes in-house, uses 100 percent reusables for staff meals, and more.
Energy Conservation & Renewable Energy Award
4 Star Certified Green Restaurant® Carvers’ Café, also the winner of the 2026 Greenest Restaurant Award, earned 339.66 GreenPoints™ in the Energy category. This restaurant has an on-site solar array that generates more than 55 percent of its energy use, 100 percent LED lighting, and three walk-in coolers with strip curtains, each of which saves enough energy to power a residential home for an entire year.
Sustainable Food Award
4 Star Certified Green Restaurant® Fresh Food Company at Western Kentucky University in Bowling Green, KY earned 99.5 GreenPoints™ in the Food category. This dining hall serves 54 percent vegetarian main meals and an additional 26 percent vegan main meals. In addition, Fresh Food Company sources a variety of its food locally including poultry, pork, beef, dairy products, fruit, vegetables, and more. Fresh Food Company also serves 100 percent sustainable seafood.
Chemical & Pollution Reduction Award
4 Star Certified Green Restaurant® Putnam Dining at UConn earned 62.05 GreenPoints™ in the Chemicals & Pollution category. This Certified Green Restaurant® is located in a brownfield redevelopment building. Putnam Dining at UConn also uses green hand soaps and green cleaners.
Waste Reduction Award
4 Star Certified Green Restaurant® Cougar Woods Dining Commons at University of Houston in Houston, TX earned 99 GreenPoints™ in the Waste category by reducing the amount of waste that ends up in a landfill with back and front of house composting, weekly food bank donations, and reusable plates, cutlery, and recycling plastics, glass, aluminum, paper, cardboard, grease, batteries, electronics, appliances, and renovation materials.
Water Conservation Award
4 Star Certified Green Restaurant® Connecticut Hall, also the 2026 Greenest University Restaurant, earned 46.93 GreenPoints™ in the Water category. Connecticut Hall is saving 668,400 gallons of water every year, the equivalent of 61.3 backyard swimming pools. This dining hall reuses greywater for mechanical operations, has a boilerless steamer, and uses high efficiency pre-rinse spray valves.
Sustainable Seafood Award
This year, 4 Star Certified Green Restaurant® Cougar Woods Dining Commons at University of Houston, 4 Star Certified Green Restaurant® Mars Wrigley GIC – Better Moments Cafe in Chicago, IL, and 4 Star Certified Green Restaurant® Fresh Food Company at Western Kentucky University tied for the 2026 Sustainable Seafood Award. These three restaurants each earned 15 GreenPoints™ for serving 100 percent sustainable seafood.
Green Marketing Award
4 Star Certified Green Restaurant® Fresh Food Company at Western Kentucky University in Bowling Green, KY has earned 19.5 GreenPoints™ in the Education & Transparency category. With certification signage, a sustainability event hosted on campus, and more, this Certified Green Restaurant® is implementing creative and effective marketing to be transparent about its sustainability and to educate its students and the public.
Green Social Media Award
Baylor Eats at Baylor University in Waco, TX highlighted their certifications in engaging and creative ways on Instagram and Facebook during Campus Sustainability Week in October, sharing overviews of their certifications and sustainability initiatives. Baylor University is home to three 3 Star Certified Green Restaurants®: Penland Crossroads Dining, 1845 at Memorial, and East Village Dining Commons.
Most Innovative Restaurant
4 Star Certified Green Restaurant® Engrained at Loyola University Chicago in Chicago, IL has implemented a variety of unique and innovative environmental steps. This restaurant has a geothermal heat pump, which can reduce its heating and cooling energy consumption by up to 80 percent. The restaurant's geothermal heating system uses the Earth's temperature to heat and cool the building, significantly reducing greenhouse gas emissions and improving energy efficiency. There is also often excess heat provided by the system that can be used to heat domestic water for handwashing. According to the Department of Energy, the biggest benefit of a geothermal heat pump is that it uses 70 percent to 80 percent less electricity than conventional heating or cooling systems. In addition, Engrained reduces water waste by reusing rainwater to flush all urinals in their restroom.
Green Employee Leader
Kevin Kesterson was recognized as the recipient of the 2026 Green Employee Leader Award. Through his exceptional leadership and dedication, Kevin has played a pivotal role in bringing numerous restaurants into the Green Restaurant Association’s certification program. His passion for sustainability shines through his efforts to guide and encourage restaurants to adopt impactful environmental changes.
Green Leader
Courtney White, Director of Sustainability & Environmental Education at Princeton Day School, is the winner of the 2026 Green Leader Award! Through hands-on-learning, Courtney led her environmental science class in working directly with their GRA Sustainability Consultant to successfully complete the recertification process for Princeton Day School’s cafeteria, maintaining its 4 Star Certified Green Restaurant® status.