MRM Research Roundup: Cautious Optimism, Beyond the Burn, and the Taylor Swift Economy
14 Min Read By MRM Staff
This edition of Modern Restaurant Management (MRM) magazine's Research Roundup features news of how restaurants are a saving grace for malls, the economic impact of Taylor Swift in town, and how influential reviews can be.
Voice of the Restaurant Industry
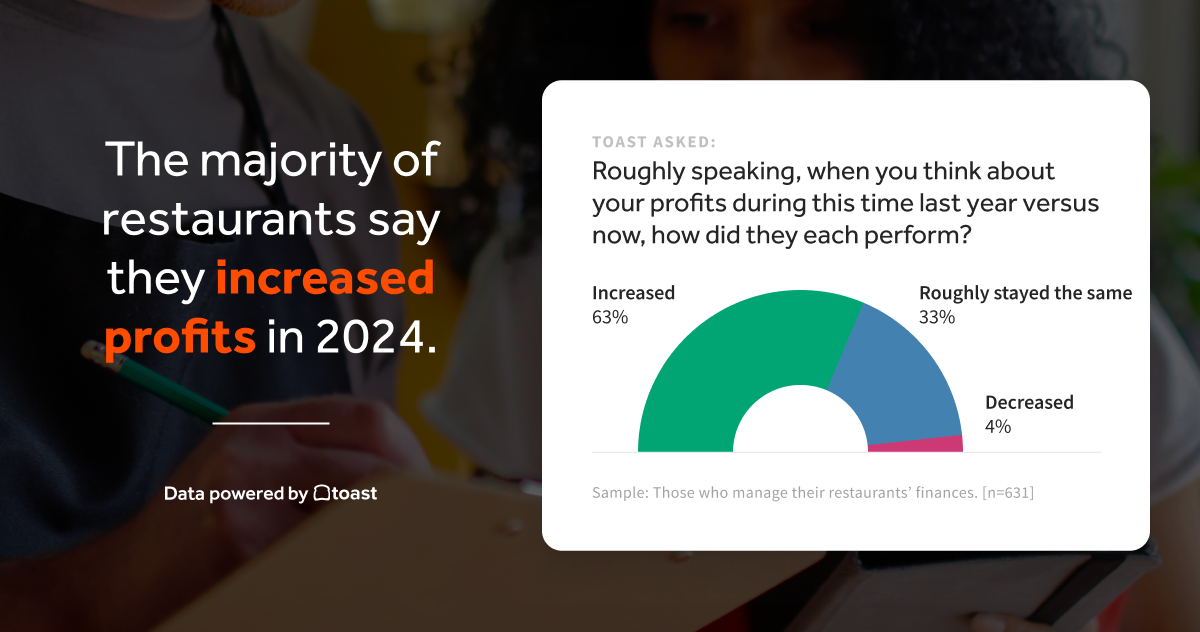
Toast's 2024 Voice of the Restaurant Industry some insights and data suggesting a cautiously optimistic outlook: profits are rising, with 63 percent reporting increased margins compared to last year. The survey, conducted with 755 decision-makers from full-service to quick-service establishments, challenges the narrative of an industry in distress, instead painting a picture of adaptability and resilience. It also zooms in on current challenges faced by owners/operators, menu prices and inflation, and tech/AI implementation.
Most Restaurants Increased Sales in 2024
- Approximately 63 percent of restaurant operators that manage finances said their profits in 2024 increased compared to last year.
- Only four percent of respondents said their profits decreased compared to last year, and 33 percent said their profits stayed the same.
COGS Are Key as Hiring Pressures Decline
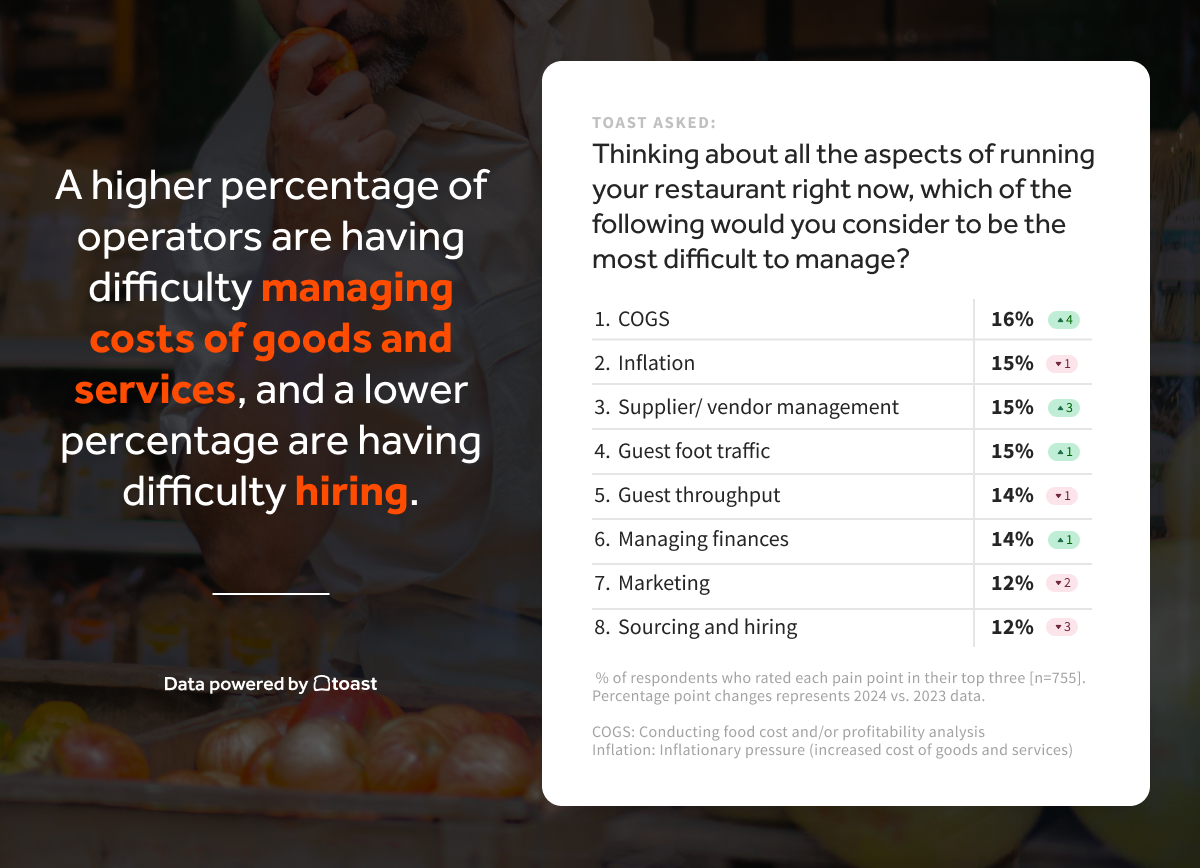
- In 2024, 16 percent of operators say analyzing and managing the cost of goods and services and supplier and vendor management are top pain pointscompared to 12 percent in 2023.
- Inflation (or the increased costs of goods and services) is still a top pain point for operators (15 percent).
- Some good news: A lower percentage of operators found sourcing and hiring a top pain point (12 percent), dropping three percentage points.
Turning Tides: Restaurants Continued Navigativating Inflation
- In response to inflation, operators said they: adjusted food suppliers (37 percent), tracked ingredient prices (36 percent), increased menu prices (34 percent), managed a leaner inventory (32 percent), and reduced their menu sizes (26 percent).
- While guests may still be feeling the pain of rising menu prices at restaurants, fewer restaurants said that they raised prices this year compared to last year.
Restaurants Order Up Tech, AI, and Dynamic Pricing
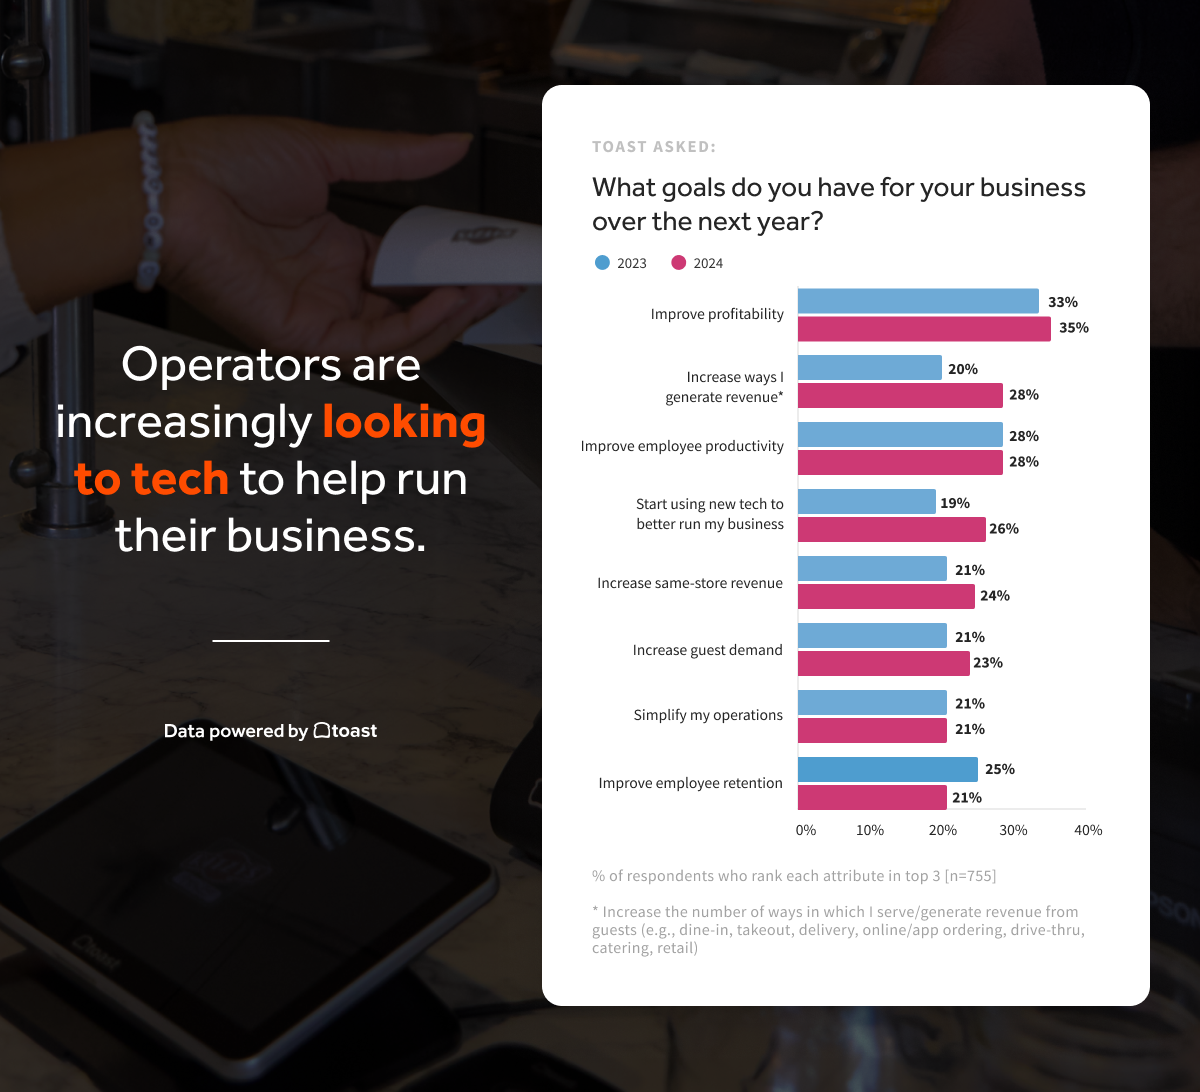
- As far as technology goes, 26 percent of respondents said they’d like to start using new tech to help run their business, which is up seven percentage points from last year.
- Operators are also looking for ways to improve their business using AI (52 percent), which rose by seven percentage points from last year.
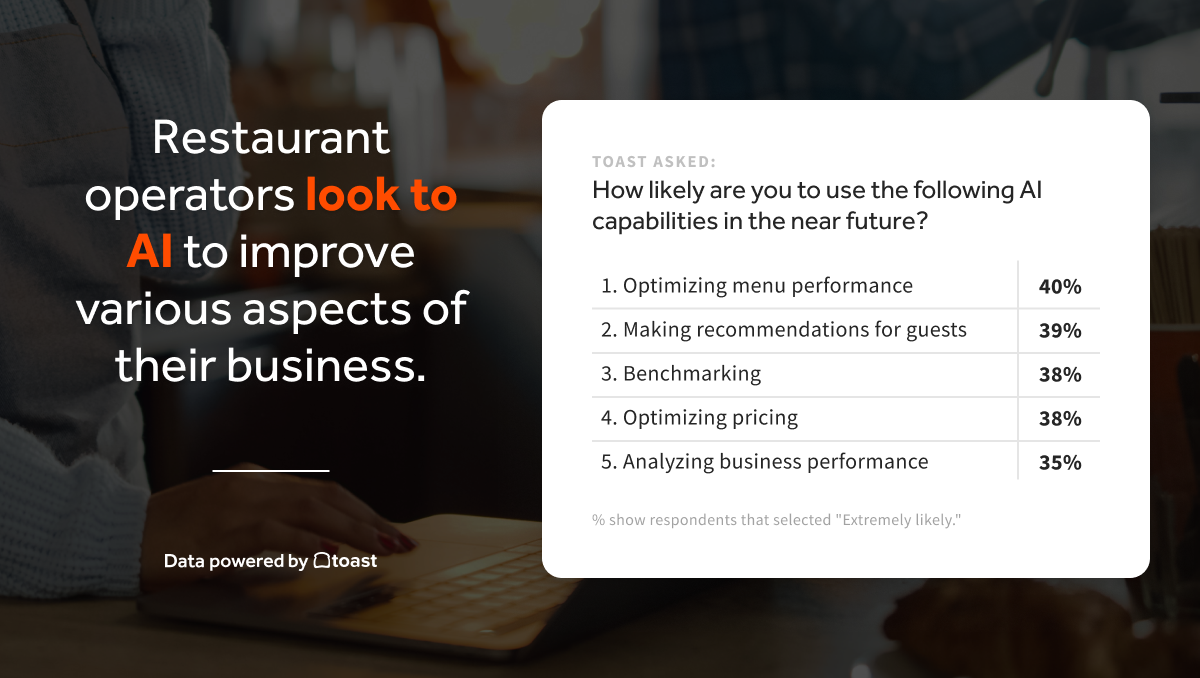
- They hope to implement AI in several ways, including optimizing menu performance (40 percent), making recommendations for guests (39 percent), benchmarking their business performance against their peers (38 percent), optimizing pricing (38 percent), and analyzing their business performance (35 percent).
- They hope to implement AI in several ways, including optimizing menu performance (40 percent), making recommendations for guests (39 percent), benchmarking their business performance against their peers (38 percent), optimizing pricing (38 percent), and analyzing their business performance (35 percent).
Growth & Expansion On The Menu for 2025
- Restaurant operators are feeling similarly confident about opening a new location within the next six to 12 months.
- 24 percent of respondents said they hope to open a location within six months, up two percentage points from last year. 28 percent of respondents said they hope to open a location in the next 12 months, which is similar to what we saw in our 2023 survey.
- As restaurants look to the next 12 months, they anticipate placing a greater emphasis on revenue streams such as on-premise dining, off-premise dining, and catering.
The Restaurant and Mall Connection
Restaurants are breathing new life into malls ahead of this holiday season, according to a new Yelp report analyzing search trends and consumer interest on Yelp.
Despite softer nationwide searches for malls, restaurants/food businesses contribute to many of the top growing categories since 2019, including bubble tea, vegan food, beer bars, waffles and Filipino food, and make up 17 of the top 25 brands seeing the most consumer interest in malls.
The Cheesecake Factory, Din Tai Fung and Macy’s led the top 25 mall brands, which were measured by consumer interest on Yelp.
Key Findings
Yelp analyzed search increases by measuring the frequency of phrases mentioned per million searches, comparing September 2023 – August 2024 vs. 12 months prior, or unless otherwise noted.
-
As consumer searches for malls are declining, restaurants are breathing life back into malls.
-
Consumer searches for malls on Yelp decreased 13 percent year over year. Searches are also down eight percent from 2019.
-
Yelp data shows that the number of food and restaurant businesses in malls is growing, with locations increasing by seven percent from 2019 to 2024.
-
The Northeast is the only region seeing growth in mall searches, up five percent from 2019 (possibly spurred by the American Dream mall).
-
Consumer searches for malls in New York are up 28 percent from 2019.
-
Comparatively, searches in the Midwest were down seven percent from 2019, and California was down 23 percent from 2019.
-
-
Yelp highlights the top categories experiencing new business growth in malls, as they evolve beyond traditional retail hubs into dynamic, experience-first shopping centers.
-
Category growth (2019 v 2024):
-
Bubble tea +113 percent
-
VR centers +79 percent
-
Waffles +77 percent
-
Vegan +54 percent
-
Medical spa +50 percent
-
Beer bar +42 percent
-
Mobile phones +40 percent
-
Filipino food +36 percent
-
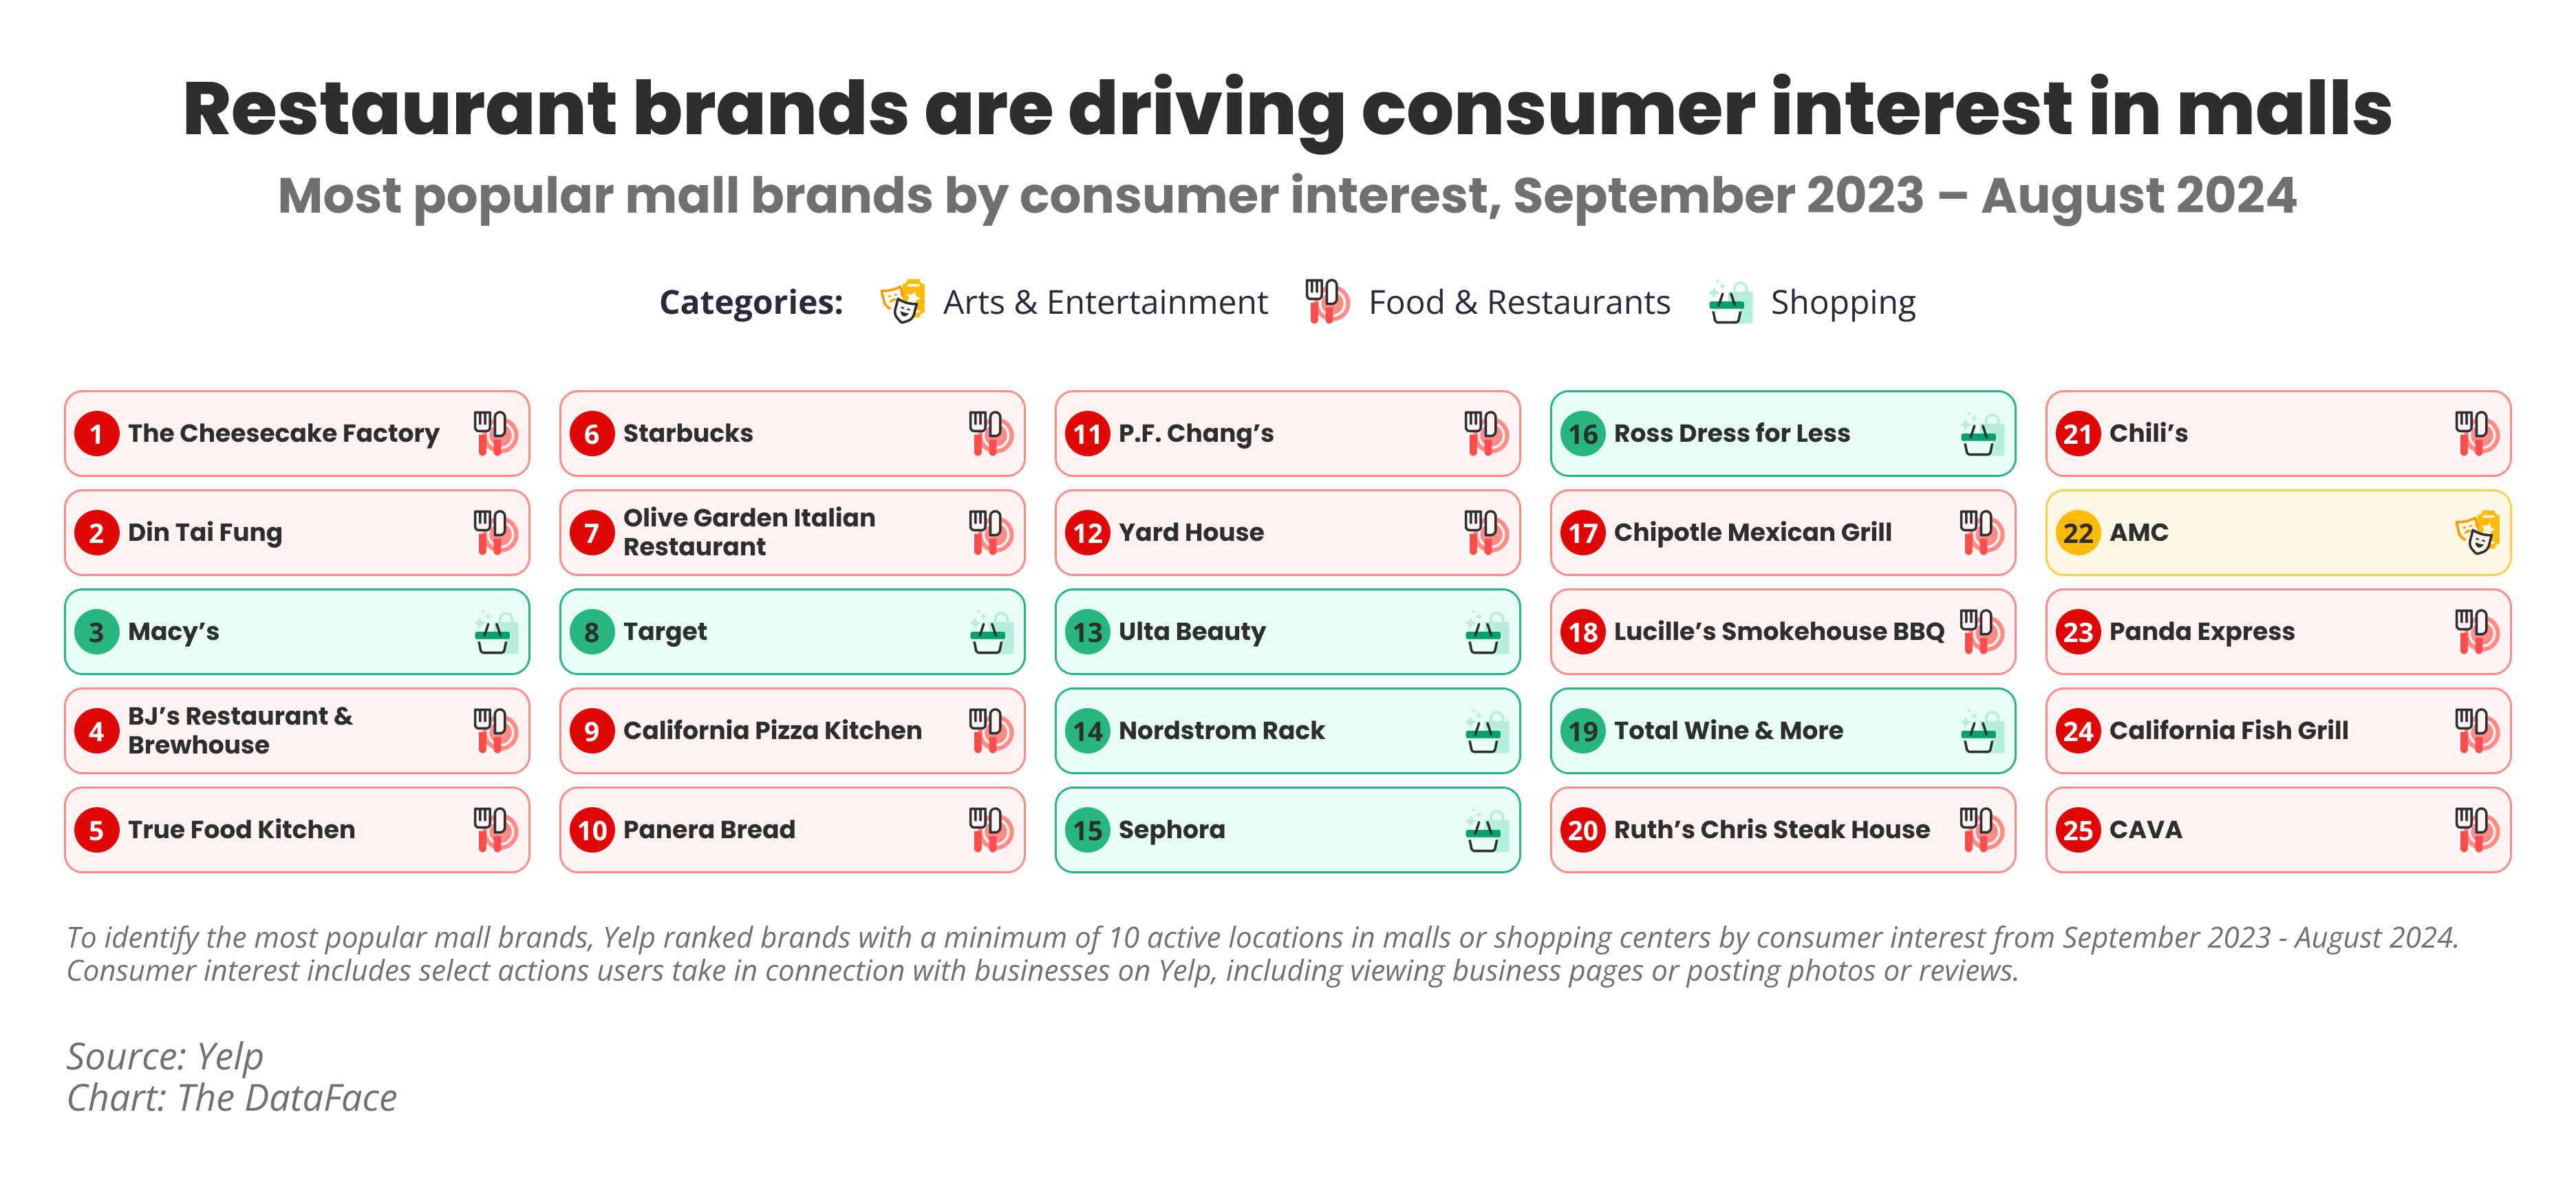
Yelp’s Top 25 Mall Brands highlights the centrality of food and dining in the mall experience.
-
The Cheesecake Factory is the most popular mall brand, followed by Din Tai Fung (#2), Macy’s (#3), BJ's Restaurant & Brewhouse (#4), True Food Kitchen (#5), Starbucks (#6), Olive Garden Italian Restaurant (#7), Target (#8), California Pizza Kitchen (#9), Panera Bread (#10), P.F. Chang's (#11), Yard House (#12), Ulta Beauty (#13), Nordstrom Rack (#14), Sephora (#15), Ross Dress for Less (#16), Chipotle Mexican Grill (#17), Lucille's Smokehouse Bar-B-Que (#18), Total Wine & More (#19), Ruth's Chris Steak House (#20), Chili's (#21), AMC (#22), Panda Express (#23), California Fish Grill #24), and CAVA (#25).
-
Out of 25 brands, 17 are QSR or casual dining restaurants, marking a significant shift in why people are primarily visiting malls – to eat.
-
Anchor retailers like Macy’s, Target and Nordstrom all landed in the top 25.
-
Despite recent challenges, the movie industry is represented by AMC, one of the most popular mall brands of the year.
The Influence of Reviews
HungerRush™ revealed how restaurant reviews significantly influence where people choose to eat. The survey shows that 80 percent of diners are more likely to visit a restaurant with positive reviews about food quality and taste. As restaurant owners work to attract new customers, reviews have become more crucial than ever.
The survey also found that 77 percent of diners prefer restaurants with good service reviews. Customers are increasingly paying attention to the overall experience and sharing their feedback online, whether for dine-in, delivery, or pickup. Restaurant owners that listen to reviews and surveys have an opportunity to improve their operations and meet customer expectations. Ignoring feedback can lead to negative reviews, which may drive customers away—63 percent of diners said they would avoid a restaurant with poor food quality reviews, and 62 percent would steer clear of establishments that aren't clean. Additionally, 51 percent of diners shared a restaurant review in the past year.
Previously, restaurants could only hope satisfied customers would share their experiences online and unhappy customers would refrain. Today, there are many tools available for restaurants to better capture customer feedback. These tools help restaurants capture valuable customer insights and mitigate customer issues. Encouraging diners to give feedback directly to the restaurant as well as encouraging diners to leave online reviews allows them to choose and often gives the restaurants an opportunity to solve customer problems before they are publicly broadcast. In any situation, responding directly and quickly is the best way to rebuild a customer relationship.
The top reasons customers leave negative reviews are poor service (57 percent), low food quality (28 percent), incorrect orders (26 percent), and high prices (20 percent). On the other hand, positive reviews typically mention great service (50 percent), delicious food (33 percent), discounts (31 percent), and consistent quality (22 percent). When restaurants respond to negative reviews, they gain valuable insights to improve their business and rebuild customer relationships, potentially turning negative situations into lasting improvements and loyal customers.
Escoffier Dining Trends Survey
- To find out how Americans spend on restaurants and takeout, Escoffier, analyzed 2024 consumer dining trends by compiling a list of statistics from various sources.
- Fast food dominates takeout, with 60 percent of Americans choosing it as their preferred option for ordering meals at home.
- 64 percent of consumers tip more generously when using digital payment platforms, with tips increasing by an average of 15 percent compared to cash payments.
- 55.7 percent of Americans’ food budgets are now spent on dining out and takeout, marking a record high, while spending on food at home has dropped to 44.3 percent.
Escoffier, analyzed 2024 consumer dining trends based on surveys to find the details behind all that food spending:how much are Americans spending, what types of restaurants, takeout, etc. The data collection process focused on key areas such as dining frequency, spending habits, tipping behavior, preferences for takeout versus dining out, and food delivery services. The analysis adjusted for inflation where necessary to ensure accurate year-over-year comparisons.
|
Insight |
Key Statistic |
|
Americans Spending on Dining Out |
55.7 percent of food budget spent on food away from home |
|
Shift Since 2019 |
FAFH increased by 13.52 percent, while FAH rose by only 3.37 percent |
|
Top Reason for Takeout |
76 percent prefer eating at home for comfort |
|
Most Popular Takeout |
60 percent order from fast food |
|
Top Reason for Dining Out |
63 percent cite atmosphere and change of scenery |
|
Monthly Spend on Dining |
$166 per person |
|
Most Common Per-Meal Cost |
42 percent spend $11-$20 per meal |
|
First Date Preference |
30.3 percent prefer going out for dinner, especially Italian food |
|
Tipping Habits |
18 percent is the average tip, but 64 percent tip higher with digital payments |
|
Delivery Frequency |
4.5 takeout orders per month; 3 times dining out |
|
Preferred Delivery Method |
51 percent use third-party apps like GrubHub and UberEATS |
Dining Out vs. Eating at Home
Americans’ spending on food away from home (FAFH) continues to outpace that of food at home (FAH). In fact, between 2019 and 2023, FAFH spending grew by 13.52 percent, while FAH increased by only 3.37 percent. Even more telling is the shift during the pandemic—2020 saw a rare moment when FAH spending briefly overtook FAFH, reaching 51.7 percent, only to return to pre-pandemic trends by 2023, with Americans prioritizing eating out once again.
The shift back to dining out reflects a growing demand for experiences that go beyond the meal itself. Casual dining remains the most popular category, with 62 percent of Americans frequenting casual restaurants like Applebee’s or Olive Garden. Meanwhile, fast-casual options, such as Chipotle or Panera, continue to attract diners seeking a balance between quality and convenience.
Why Americans Prefer Takeout?
While dining out has its appeal, many Americans prefer takeout, with 57 percent of consumers choosing it over sitting down at a restaurant. The reasons are clear:76 percent of respondents say it’s simply more enjoyable to eat at home, while 75 percent value the convenience it offers. Whether it’s the comfort of watching TV while eating or the ability to enjoy a meal without having to cook, takeout has become a staple for busy households.
Fast food dominates the takeout scene, with 60 percent of Americans ordering from fast-food chains. In contrast, fine dining accounts for only 2 percent of takeout orders, showing that when convenience is the goal, fast food is king.
What Drives Americans to Dine Out?
Though takeout is popular, dining out has its own allure, especially for social occasions. The atmosphere is a significant draw, with 63 percent of respondents citing a change of scenery as the primary reason for eating out. Socializing with friends (48 percent) and enjoying higher-quality food than they can prepare at home (47 percent) also rank highly. Special occasions like birthdays and anniversaries bring many people to restaurants, with the added benefit of no clean-up at home (40 percent).
Spending Habits: How Much Are Americans Shelling Out?
Dining out comes with a price, and Americans spend an average of $166 per month per person on restaurant meals. Most people spend between $11 and $20 per meal, with men spending 19 percent more than women. Interestingly, dining out tends to be pricier than ordering delivery, with the average restaurant meal costing 34.4 percent more than a delivered meal.
First Date Preferences: It’s All About the Experience
When it comes to first dates, dinner remains the top choice for 30.3 percent of Americans, with Italian cuisine reigning as the favorite. Coffee dates come in second (23.7 percent), while other options like getting drinks or going for a walk rank lower. Italian food’s popularity on dates underscores its timeless appeal for creating a comfortable, intimate dining experience.
The Tipping Culture: A Growing Trend
Tipping continues to play an essential role in dining out, with Americans averaging an 18 percent tip on their bills. Yet, with the rise of digital payments, tipping behavior is evolving. More than 64 percent of consumers tip more generously when paying through digital platforms, leaving tips that are 15 percent higher on average than they would with cash. This shift is driven in part by a sense of obligation, with 66 percent of people reporting that they feel pressured to tip when presented with digital payment options.
Delivery Services: A Growing Staple in American Life
Food delivery services have seen explosive growth, becoming a key component of modern dining habits. Millennials and Gen Z are driving this trend, with 52 percent of consumers identifying takeout as essential to their lifestyle. Delivery apps such as GrubHub and UberEATS lead the market, with 51 percent of Americans regularly using third-party apps for delivery.
In 2023, 65 percent of restaurants reported that delivery accounted for a higher percentage of their sales than it did before the pandemic. The ease of ordering via apps, combined with the convenience of staying home, has fueled this rise, with many consumers making repeat orders at least once a week.
Taylor Swift Effect
Taylor Swift’s Eras Tour has not only redefined the concert experience, it has also created an economic surge in every city it touches. The “Taylor Swift economy” recently swept through Miami and spoiler: Swift’s sold-out shows drove record spending.To help prep restaurant owners/operators understand what to expect when T.Swift comes to town, Toast looked at how Taylor Swift’s Eras Tour impacted local Miami restaurants.
Local Sales On The Rise in Miami
Miami restaurants saw a 9.1 percent rise in total transactions, underscoring increased foot traffic and the need for enhanced staffing and inventory levels.
Gross Merchandise Value
(GMV) at local restaurants grew by 12.8 percent, driven by increased spending from Swift’s fans fueling up pre-show.
The average ticket size grew by 2.6 percent, highlighting fans’ readiness to spend more, especially on premium experiences.
Big Day For Brunch
Omelet sales surged by 27.2 percent, revealing that brunch was a fan favorite, especially on concert day.
Breakfast platters (+21.2 percent) and sandwiches (+14.7 percent) also increased the weekend of the Miami shows. Seafood dropped in sales by 1.6 percent and wing sales decreased by 5.8 percent.
Sales peaked at 11 a.m. with a 17 percent increase – emphasizing the need for robust staffing and stock during brunch hours.
Wine Time!
Wine sales rose 12 percent while most other alcoholic beverages saw a decline, suggesting that fans opted for a more relaxed pre-concert vibe.
Vodka held on with a 1.3 percent increase in sales, but beer (-2.2 percent), rum (-9.1 percent), and tequila (-14.2 percent) were all down
Takeaways for restaurants
The significant hourly sales growth leading up to the event–particularly the peak at 11 a.m–highlights the importance of being fully staffed, well-stocked, and prepared during brunch and lunch hours. Given that sales dropped off sharply after the concert began, restaurants should consider focusing on daytime promotions and pre-concert specials to maximize revenue; planning staffing levels and inventory accordingly is crucial.
Swifties span a wide range of ages, from the youngest of Gen Alpha just discovering her music to OG fans who have been with her since her 2006 debut album. However, we found that they have one more thing in common: brunch! By highlighting and promoting your brunch offerings, you can position your restaurant as the pre-show spot for guests looking to start their day before a concert.
Most-Loved Brands
Chick-fil-A is the most loved quick-service restaurant, followed by Carl’s Jr. and Hardee’s in second place and Arby’s in third place according to a new report analyzing customer reviews. Even the top-ranked restaurants aren’t immune to widespread criticism of customer service. As traffic to QSRs continues to decline, reviews mentioning customer service increased by 19 percent YoY, while those mentioning pricing declined slightly.
Among the key findings:
- Customer Service Chaos: Reviews mentioning mistakes were up 6.9 percent, while references to staff attitudes were up 21.8 percent. Mentions of managers increased 14.6 percent YoY, leaning negative.
- Customers regularly report inattentive staff, unprofessional communication, incorrect orders and rude managers.
- Wait Time Woes: Wait time-related reviews increased 8.5 percent Among those reviews, mentions that orders took a “long time” increased 35.7 percent–with many customers reporting it took as long as 30 minutes to an hour to get their food.
- Mobile orders emerge as a potential threat to QSRs, with reviews mentioning mobile orders growing by 52 percent, and skewing negative. Consumers complain that mobile orders are not ready when promised, or deprioritized over walk-in orders.
- Price Sensitivity Persists: While customer service-related issues dominate reviews, pricing remains a problem. The portion of pricing-related reviews describing restaurants as “overpriced” increased by 43.2 percent.
- Customers complain about discrepancies between menu prices and checkout prices, while others compare prices unfavorably to sit-down restaurants.
Chatmeter used its AI-powered sentiment analysis tool, Signals, to analyze Google Reviews from a sample of 100 locations from each restaurant to inform rankings.
Holiday Gift Card Survey
Givex unveiled the results of its 2024 Holiday Gift Card Survey, offering a snapshot of American consumer shopping behaviors ahead of the holiday season. The data comes from a survey commissioned by Givex of over 1,000 Americans, focusing on how inflation, shopping habits and dining trends will shape the holidays this year.
According to the Givex 2024 Holiday Gift Card Survey, inflation remains a significant factor for 70 percent of respondents, though this is a slight decrease from 2023. Credit card gift cards continue to dominate as the most popular gift card choice for the holidays, favored by 70 percent of respondents — up 6 percent from last year—followed by restaurant gift cards at 46 percent.
Key Insights from the Givex 2024 Holiday Gift Card Survey:
- Rising Popularity of Gift Cards: Credit card gift cards remain the top choice for 70 percent of respondents, with restaurant gift cards coming in second at 46 percent.
- Holiday Spending Plans: On average, Americans plan to spend $136 on gift cards this holiday season. Non-essential spending will focus on gifts, with an average spend of $245.
- Inflation's Influence on Shopping: 70 percent of Americans report that inflation will impact their holiday shopping.
- Early Shoppers on the Rise: 44 percent of Americans plan to start their holiday shopping earlier, with only 22 percent intending to complete all their shopping on Black Friday.
- Cautious Dining Trends: With only 39 percent of Americans feeling they're getting good value for dining out, 40 percent plan to dine out less often this holiday season, and 42 percent will seek dining promotions more frequently than last year.
- AI and Loyalty Programs: While 75 percent of Americans are not comfortable using AI to assist with their shopping, 29 percent plan to make more holiday gift-buying decisions based on loyalty programs and reward points.
- Increased Grocery Spending: 58 percent of Americans expect to spend more on groceries this season compared to last year.
Gift Card Sales Data from Givex
- During the 2023 holiday season (Black Friday through Christmas Eve), total gift card value sold was up 12.36 percent from the previous year.
- The total quantity of gift cards sold increased by 8.85 percent.
- 39 percent of all gift card sales for the year occur between Black Friday and Christmas Eve, highlighting the significance of this period for businesses.
Beyond the Burn
Once considered exotic and intimidating, spicy foods have become a mainstream sensation, driven by evolving taste preferences and the allure of intense, flavorful experiences. This and other findings can be found in the latest “Beyond the Burn” report published by natural food and beverage ingredients supplier Kalsec Inc.
The survey was conducted online in September 2024 and captured the viewpoints and preferences of approximately 6,000 consumers. Respondents were not restricted by age, income, sex, ethnicity or education and represented a global market that includes United States, Canada, Brazil, Mexico, United Kingdom, France, Germany, Italy, Australia, China, Thailand and India. This is the fourth Hot & Spicy Survey; previous iterations were published in 2017, 2019 and 2021.
The report indicates that the rise of globalization and ubiquity of social media have made it easier to seek out new sources of heat. Consumers are drawn to the complementary flavors and heat levels offered by different peppers and regional tastes. Understanding these synergies can help manufacturers discover new product innovation opportunities.
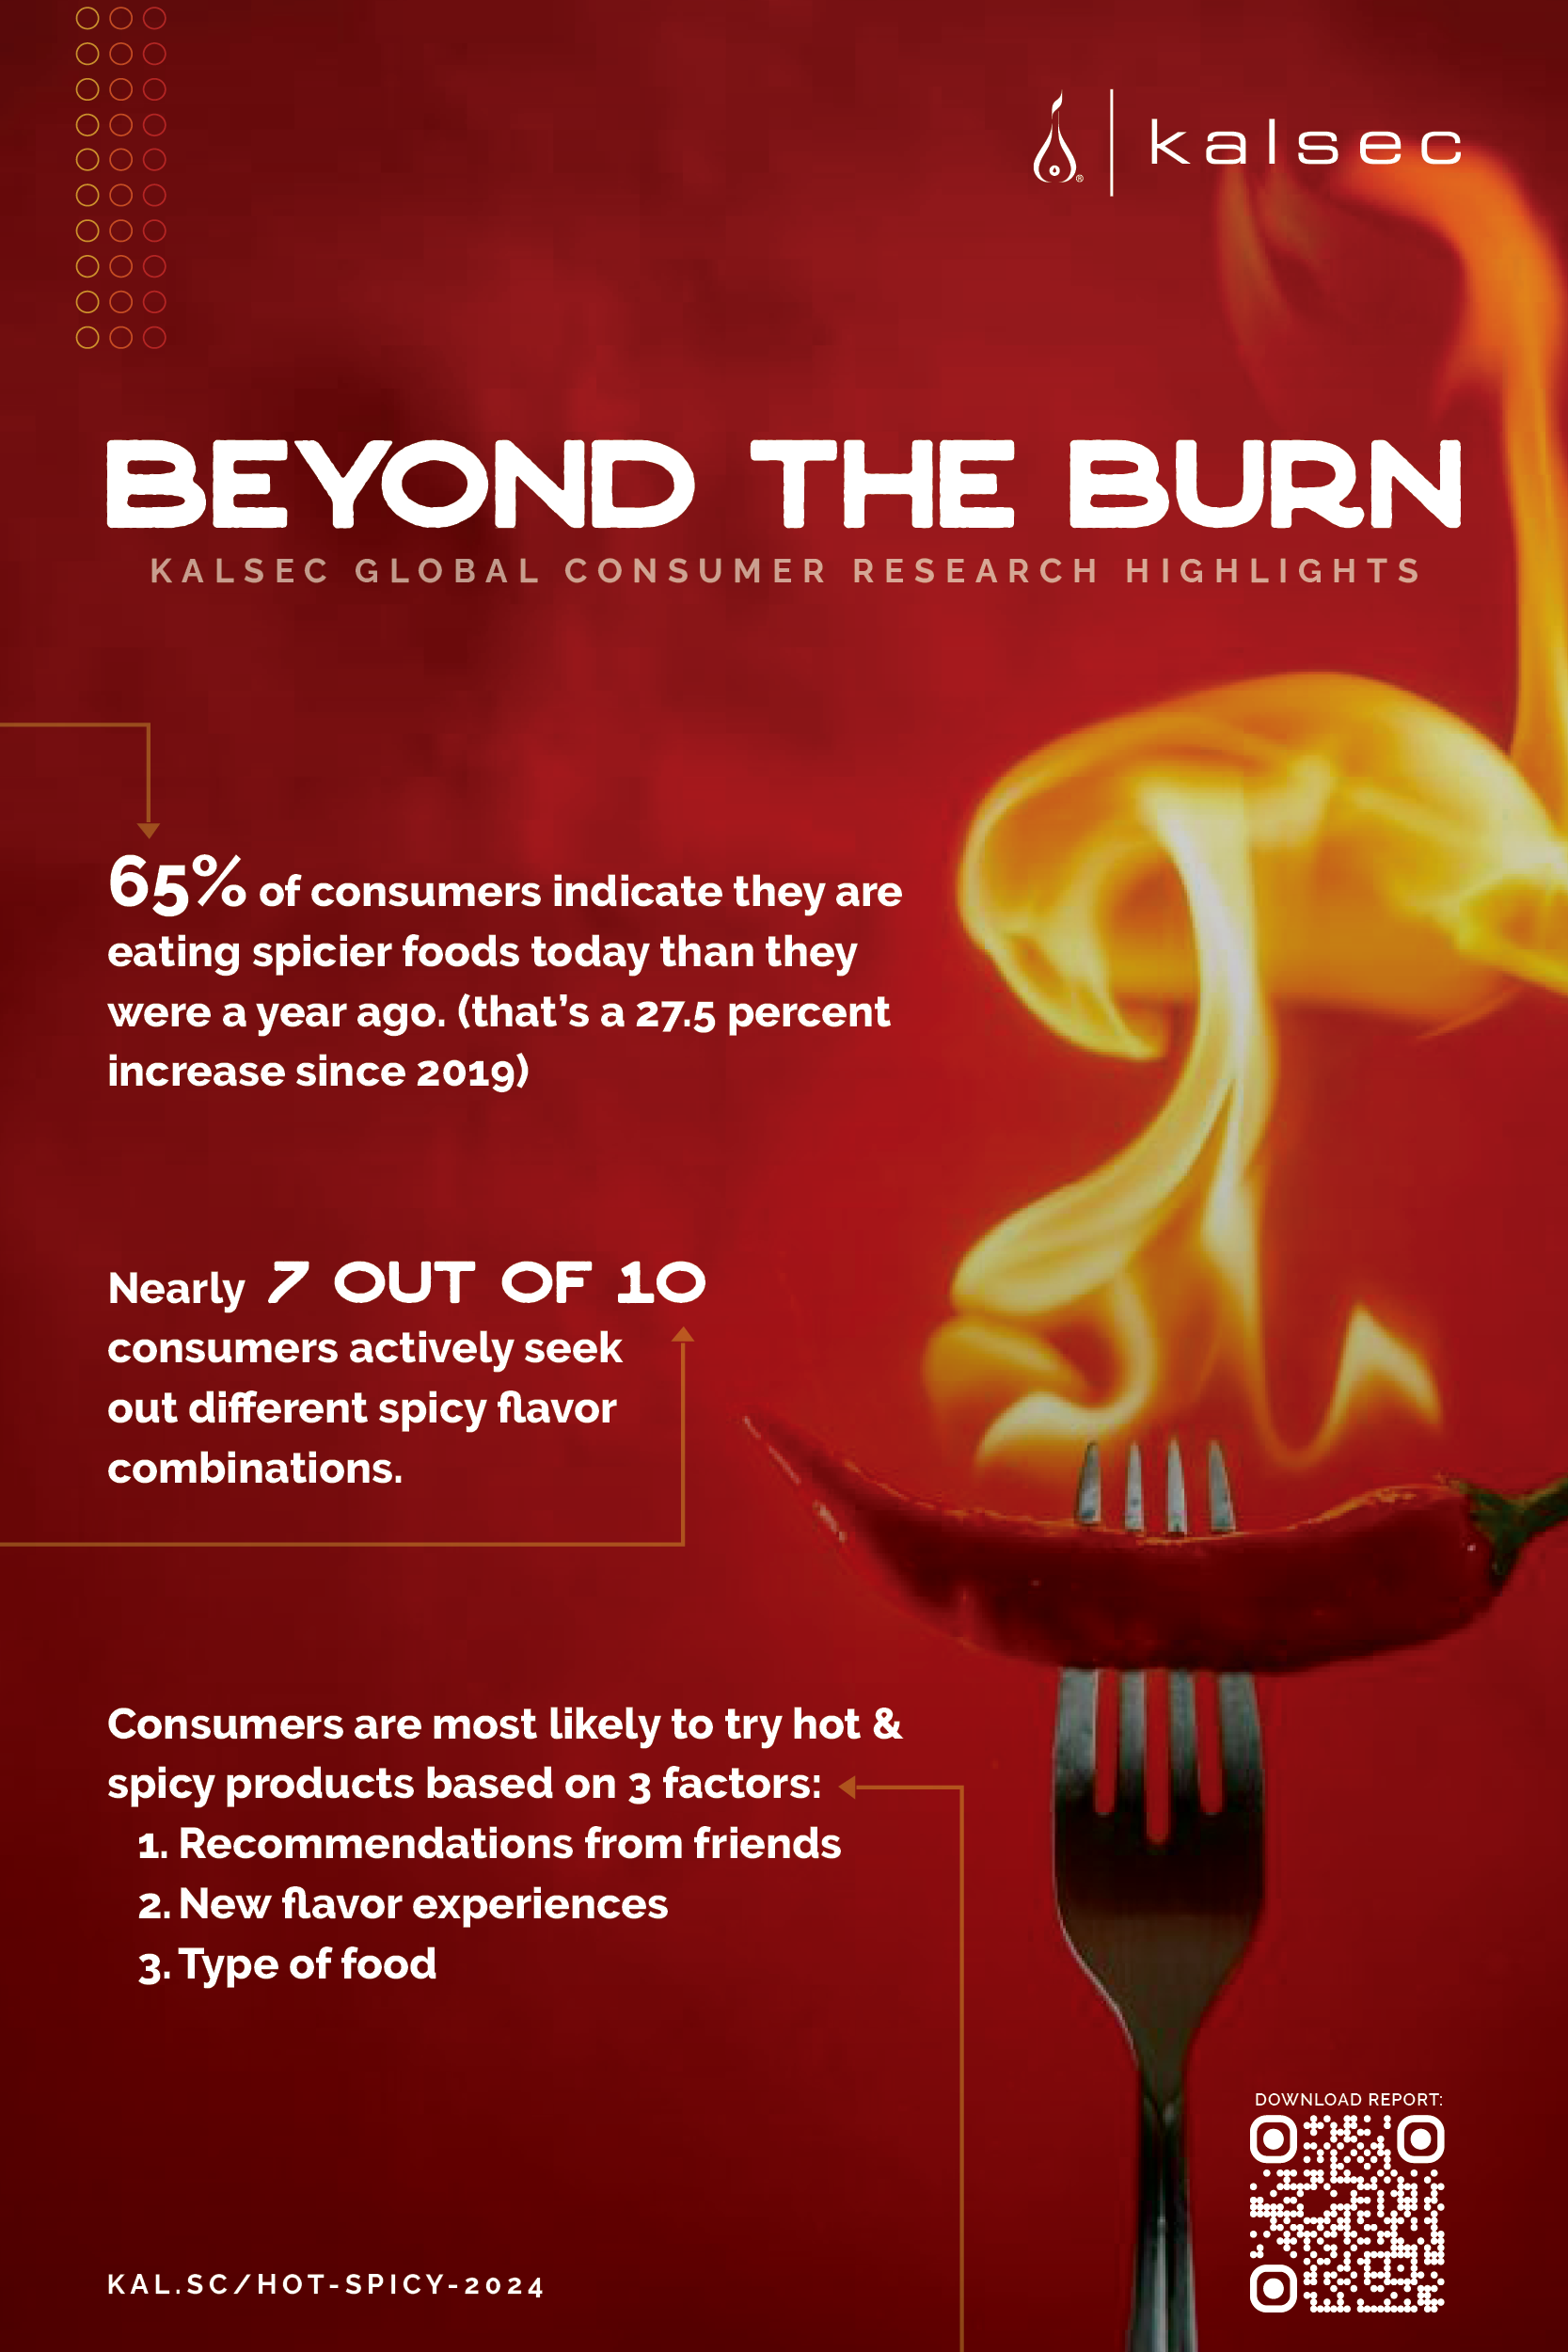
A few of the takeaways from “Beyond the Burn” include:
- Intensifying Heat: Consumers are eating spicy foods more frequently than in the past and seeking higher heat intensities.
- Increasing Experimentation: Consumers are also trying spicy foods both at home and in restaurants, demonstrating a growing appetite for bold flavors and the willingness to experiment with new ingredients.
- Surprising Applications: While most consumers opt for heat in savory dishes, dessert also provides an opening for heat, with almost one-third of respondents saying they prefer “mild” or “some level of heat” in their sweet treats.
- Intriguing Flavor Combinations: “Spicy & Sweet” – or “swicy” – is the flavor combination ranked most desired to try, globally.
The Status of Lunch
ezCater released its third annual Lunch Report, revealing new insights into employees’ lunch habits. Although 98 percent of employees recognize the benefits of lunch breaks on job performance and productivity, nearly half (49 percent) skip lunch altogether at least once a week. Employees cite fear they won’t have enough time to get their work done (23 percent) and having too many meetings to take a break (19 percent) as key reasons they skip the lunch break.
This year, ezCater surveyed 5,000 full-time U.S. employees, uncovering how lunch breaks influence job performance, satisfaction, and well-being across generations and regions. Additional findings from ezCater’s 2024 Lunch Report include:
- Lunch breaks are losing ground: While employees recognize that lunch breaks can enhance job performance (98 percent), happiness (51 percent), and mental clarity (49 percent), only 38 percent take a break away from their desk every day during lunch.
- Gen Z workers are least likely to break for lunch: Despite half (50 percent) considering it the best part of the workday, 47 percent of Gen Zers miss out on lunch twice or more per week. Gen Zers are also four times more likely than Boomers to feel guilty for taking a break from work.
- Inflation bites into lunchtime: 78 percent of employees say inflation has impacted their lunch habits, with 36 percent opting for cheaper alternatives, 31 percent purchasing fewer meals, and 22 percent leveraging value menus, discounts, coupons, or loyalty programs.
- 'Little Treat Culture' sweetens the workday: A trend that gained popularity on TikTok has become an office norm, especially among younger workers. Employees seek out small food treats for energy (53 percent), as a reward (42 percent), or stress relief (38 percent), with 87 percent of Gen Z enjoying treats weekly—the most of any generation.
- Free lunch boosts work attendance: Nearly 6 in 10 hybrid workers (58 percent) would work on-site 3 days a week if their employer provided free lunch.

