MRM Research Roundup: 2022 Restaurant Trends
20 Min Read By MRM Staff
This edition of MRM Research Roundup features evolving guest relationships, views on restauarant tech, employee desires and wedding trends.
The Pandemic Has Permanently Altered the Consumer-Restaurant Relationships
The pandemic has permanently altered the consumer-restaurant relationship with operators investing in technology and real estate to align with changing consumer preferences, according to the 2021 Restaurant Franchise Pulse survey, conducted by TD Bank.
Early in the pandemic, 72 percent of operators invested in delivery and mobile/online ordering to boost revenue during mandated stay-at-home orders according to TD's 2020 survey, and it appears the popularity of these offerings is here to stay.
Investment in delivery and mobile ordering pays off
According to this year's survey, restaurant operators' early investment in delivery and mobile ordering has paid off in a big way.
- 71 percent rely on delivery for 11 percent or more of sales
- 33 percent rely on delivery for more than 20 percent of sales
- 65 percent rely on mobile ordering for 11 percent or more of sales
- 25 percent rely on mobile ordering for more than 20 percent of sales
To keep up with changing consumer preferences, operators noted that their top areas of investment in 2022 include mobile ordering (54 percent); delivery services (47 percent); technology such as new POS digital signage or other in-store tech (45 percent); and alternative payment methods (37 percent).
"Consumers have become accustomed to the speed and convenience of mobile ordering and delivery, which in turn, has changed the restaurant franchise landscape," said Mark Wasilefsky, Head of Restaurant Franchise Finance Group, TD Bank. "Even once there is no longer the active threat of the pandemic, consumers will still turn to these mediums. Mobile ordering and delivery have become a part of everyday life and are no longer nice to have, but expected, and operators need to continue to enhance these offerings to keep up with competitors."
Restaurant real estate changes to align with consumer preference
Along with furthering their technological investments, operators are also altering their physical restaurant locations to cater to delivery. While only 15 percent plan to reduce the number or size of their franchise locations, operators are making other adjustments to their real estate.
- 55 percent plan to add more space for pick-up
- 45 percent plan to provide additional drive thru locations
- 43 percent plan to add an outdoor on-site dining space
"What we are seeing is that the pandemic has permanently altered consumer expectations and behaviors to the point that operators are comfortable enough to make long-term capital investments," Wasilefsky added.
Operator optimism and investment fuels future credit needs
Despite the challenges the restaurant industry has faced since the start of the pandemic, operators have learned to pivot and as a result, 81 percent of respondents feel optimistic about the future. More than half even feel very optimistic and 47 percent believe their revenue will increase significantly. This optimism and operators' planned investment lead to strong credit needs. In fact, 61 percent of respondents plan to apply for a loan or line of credit within the next year.
In Love with Tech, but Impatient
A new survey shows that Americans love new tech-driven options for ordering and retrieving food, but the flipside is that it is making them more impatient. Of those surveyed, 64 percent don’t want to wait more than five minutes to order at the counter or drive-thru window, while 71 percent of in-house diners were upset if they had to wait more than 10 minutes. More than half (55 percent) said they were fed up after five minutes of waiting for food in a drive-thru, and 54 percent were annoyed waiting more than 10 minutes for food while dining at a restaurant.
While consumers mostly dig new digital dining options, they also lament the impact it is having on in-person dining. Nearly half (47 percent) said they feel like all the delivery and take-out orders result in longer waits when they order in-person and 29 percent said the atmosphere of dining-in is hurt by delivery drivers picking up food. But despite these concerns, 46 percent of people noted they will eat out daily to several times a week in coming months and showed a growing loyalty to their favorite brands.
“Online and mobile ordering was a lifeline to restaurants shut-down in the pandemic and continues to provide steady revenue,” said Simon de Montfort Walker, senior vice president and general manager at Oracle Food and Beverage. “As already short-staffed restaurants reopen, they are grappling with how to manage both in-person diners and deliveries, while meeting growing expectations on speed and service. Technology that helps kitchens manage and time orders from multiple channels will be key to keeping pace and ensuring diners stay happy and loyal.”
The results are part of an Oracle Food and Beverage survey conducted by Untold Insights in September 2021. The surveyed polled more than 5,700 global consumers across 11 geographies, including 512 in the Unites States. Download the Restaurant Trends for 2022 report for more details.
Fast is not fast enough
The survey found that consumers have a short window before they get exacerbated with the time it takes to get their order:
- More than half (54 percent) of in-house diners don’t like to wait more than 10 minutes to be served and 76 percent are impatient after 15 minutes
- For those ordering at the counter, 45 percent said they get annoyed if they must wait more than five minutes and 76 percent didn’t want to wait more than 10 minutes to be served
- At the drive-thru, nearly 1 in 5 consumers (19 percent) don’t want to wait more than two minutes to get their food, while more than half (55 percent) said they were fed up after five minutes of waiting
Kicking orders to the curb
Curbside pick-up (or Click-and-collect) continues to be a popular option that both determines where people chose to eat and their loyalty towards a brand:
- 58 percent love this method and or are more apt to choose establishments offering it
- 43 percent say it makes them more loyal to the eatery
- 54 percent say they would spend more because of this service option, with that number jumping to 80 percent for Millennials
Personalized communications aren’t creepy, they’re expected
The survey found that consumers have grown to appreciate, and even expect, proactive recommendations their favorite restaurants, but want to control access to their own data:
- 55 percent love the idea of receiving notifications about personalized offers from restaurants based on their current location
- 45 percent want to be prompted with personalized order suggestions based on their purchase history
- 46 percent would love to manage their dietary preferences with their favorite establishments
- 56 percent would love visibility and control over who has access to the personal data they share with restaurants and delivery drivers
Sustainability and healthy options rising in importance
In addition to offering click and collect, and personalizing offers based on data, consumers are increasingly influenced by a brand’s sustainability, environmental and corporate governance (ESG) initiatives, and healthy meal options:
- 61 percent of Millennials rate efforts to lower food waste (such as donations to food banks) as vital and influential to who they spend money with
- 45 percent rate clear labelling about source of food and ingredients as vital, with a slightly higher percentage of men versus women (48 percent and 42 percent, respectively)
- 58 percent of consumers rate healthy options on menu as important, with families rating this the highest at 74 percent, followed by Millennials at 71 percent
Ordering preference is situational
While mobile ordering continues to gain steam, in certain settings, consumers still prefer human interactions:
- 65 percent prefer to order directly from a server when dining in, while 18 percent would like to order from their mobile device
- When ordering take out, 33 percent would like to order directly from the restaurant on their mobile device, 18 percent from a third-party like UberEats from their mobile device, and 25 percent directly from a server
- 38 percent prefer to order directly from a server when ordering drive-thru, 38 percent prefer to order from their mobile device
- 52 percent of Millennials prefer to order from a server in-person, but that number drops sharply to drive-thru’s, with only 17 percent wanting to deal with a staff member and just 11 percent when ordering take-out
Payment options expanding
While cash is still high on consumers preferred ways to pay (47 percent), restaurants are increasingly adapting to new forms of payments to meet changing expectations:
- 60 percent of consumers like to pay with a credit card
- 25 percent prefer to utilize contactless payment methods such as Apple or Google Pay
- 7 percent are embracing alternative payments such as cryptocurrency
For more information on Oracle Food and Beverage visit: https://www.oracle.com/industries/food-beverage/
Latest Beverage Trends
In the latest BeverageTrak data from CGA’s On Premise Impact Report., Christmas Day delivers second-highest day for check value across 2021.
CGA’s latest BeverageTrak data reveals that seasonal trends over the last weeks of 2021 loosely mirrored those seen in 2019 – with a strong build up to Christmas followed by a decline in the week immediately before December 25. Over the holiday period, 24 percent of outlets remained operational on Christmas Day versus the average day in December, with trends driven by a reduction in foot traffic – with ticket count down -22 percent on Christmas Eve and -48 percent on Christmas Day versus the previous Saturday. Despite this, value velocities on Christmas Eve and Day were up by +37 percent and +42 percent versus 2019.
Across outlets that were trading, BeverageTrak data reveals that the average check value on December 25 was +115 percent higher than the average day across the year – making it the second best day in 2021, beaten only by Thanksgiving. Check values benchmarked strongest against the average day in eating outlets (+122 percent), while drinking outlets also fared well (+54 percent). CGA’s BeverageTrak solution combines powerful datasets to provide an ultra-granular view of how brands and categories are being consumed, when and at what price. Featuring day and daypart tracking, this enables sales and marketing teams to measure performance and activation ROI to develop effective strategies.
Total U.S.
Variable week on week trends saw positive trends in the run up to the holidays (+9 percent December 18 vs December 11) followed by trends of -16 percent in the week to December 25 vs December 18. There was a subsequent recovery of +10 percent in the week to January 1 vs December 25.
Velocity is +44 percent higher in the week to January 1 versus the same week in 2021.
Overall velocity in the latest week is also positive compared to pre-pandemic levels, with Total US up +10 percent versus 2020. This is largely due to an increased number of checks per outlet (+9 percent vs 2020), showing that despite COVID-19 still lingering, consumers are eager to go out in the On Premise.
Florida
In the week to January 1, Florida benchmarked well versus the same week last year – up +11 percent.
Sales velocity is now +4 percent vs January 4, 2020
Sales velocity is now +11 percent year-over-year (comparing the same week one year prior)
Sales velocity is now +20 percent vs December 25, 2021
Illinois
Illinois reports a +85 percent year-over-year increase in sales velocity in the week to January 1, largely due to the stringent COVID-19 restrictions which were in place at the start of 2021.
Sales velocity is now 0 percent vs January 4, 2020
Sales velocity is now +85 percent year-over-year (comparing the same week one year prior)
Sales velocity is now -1 percent vs December 25, 2021
California
In the week to January 1, California’s velocity was +186 percent higher than the same period in 2021.
Sales velocity is now +13 percent vs January 4, 2020
Sales velocity is now +186 percent year-over-year (comparing the same week one year prior)
Sales velocity is now +9 percent vs December 25, 2021
New York
New York experienced some of the greatest differences in the week to January 1 versus the same period in 2021 – up +70 percent.
Sales velocity is now -7 percent vs January 4, 2020
Sales velocity is now +70 percent year-over-year (comparing the same week one year prior)
Sales velocity is now +11 percent vs December 25, 2021
Texas
Texas benchmarked relatively strongly versus the same week last year – up +24 percent.
Sales velocity is now +20 percent vs January 4, 2020
Sales velocity is now +24 percent year-over-year (comparing the same week one year prior)
Sales velocity is now +4 percent vs December 25, 2021
Matthew Crompton, CGA Client Solutions Director, Americas, said: “At CGA, we are confident that 2022 will be a great year for On Premise engagement and visitation. Consumer demand returned strongly in 2021 and has proven to be extremely resilient to short term restrictions and other challenges. The On Premise is an incredibly valuable market, and an important channel for trial, experimentation and building brand equity, and 60 percent of consumers state that On Premise experiences lead them to Off Premise purchases, driving total trade growth for brands and categories at large. There are so many opportunities to engage, win share and drive growth in the On Premise, and at CGA we are working hard to ensure we have the best possible suite of solutions to help our clients lean into the channel and to innovate market-level tactics to drive performance.”
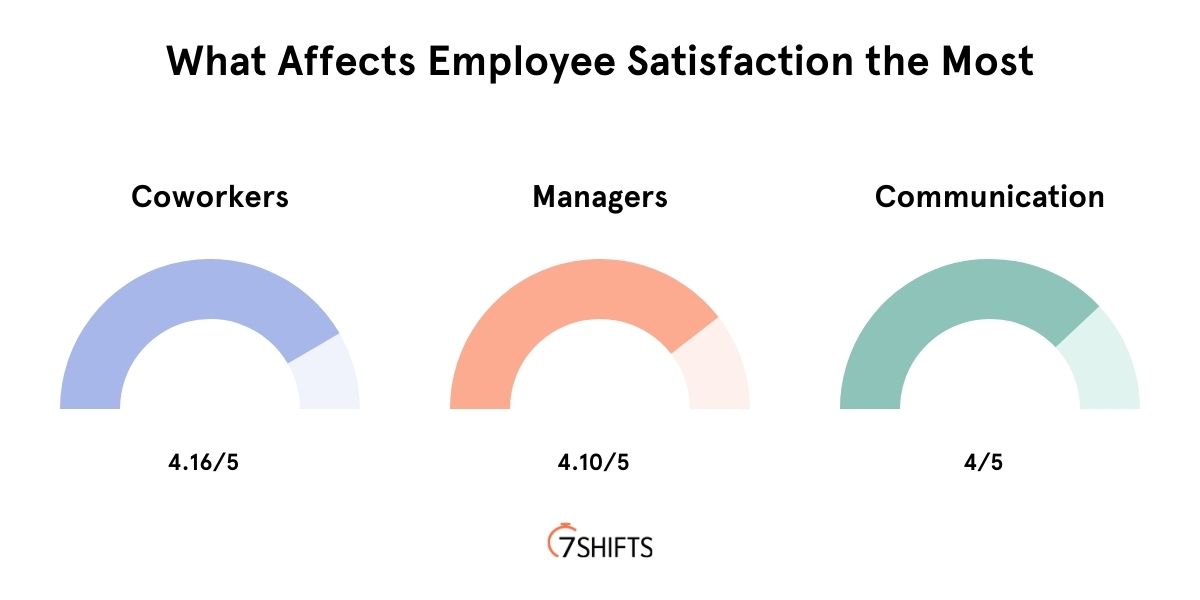
What Restaurant Employees Want at Work
7shifts surveyed over 3,700 restaurant employees at the end of 2021 to see exactly what they want and look for in an engaging restaurant work environment.
Key Takeaways
- Restaurant Workers Say Sanitation Is Important for their Satisfaction
- 46.5 percent rated themselves sanitation efforts of ultra-high importance., with an average score of 4.1 out of 5.
- Employees aren’t satisfied with their current wages
- Nearly half of all restaurant employees are hovering in the range of $11-15/hour (45.8 percent). It’s the main factor behind why restaurant employees quit their jobs, with 34.6 percent citing wages as a reason for leaving a job, or a reason for why they are planning to.
- Employees want schedule flexibility
- 56 percent of employees say that flexible scheduling would greatly affect their happiness at work.
The full study and link is here.
Hot Restaurant Trends to Watch in 2022
Despite continued curveballs, most restaurant owners/operators are feeling either very optimistic (30 percent) or cautiously optimistic (60 percent) about their outlook for 2022 as they implement strategies that will change experiences for both diners and staff. To provide deeper insight into the current and future restaurant landscape, Popmenu conducted a nationwide survey of 415 U.S. restaurant owners/operators in October 2021 and compiled the findings in a new report filled with must-know trends, real-life examples and a few surprises.
Key Findings:
The labor shortage is starving restaurant sales…literally – 71 percent of restaurant owners/operators estimate that they lose $5,000 or more per month due to the hospitality talent deficit; 37 percent lose $10,000 or more per month.
Restaurants will expand operations – 28 percent anticipate opening a new restaurant location or concept in 2022. Diners can also expect to see more ghost kitchens.
Restaurants will show workers the money – 82 percent plan to increase compensation for workers, from raising the minimum wage and offering signing and retention bonuses to implementing a new tipping option for kitchen staff.
Restaurants will up menu prices – 9 in 10 restaurant owners/operators plan to increase menu prices as they grapple with growing supply shortages and costs.
Restaurants will step up their digital game to attract and serve guests – After experiencing increased sales and efficiency through tech usage this year, 51 percent plan to automate more online operations over the next 12 months while 41 percent plan to automate more on-premise operations.
Restaurants will serve up comfort and convenience – Nearly half of restaurant owners/operators will place a greater emphasis on comfort food (and healthy food) while 26 percent say they will offer more alcohol to go and 29 percent will offer outdoor dining year-round.
Restaurants will get more personalized in guest outreach – Leveraging digital data on guests’ preferences and behaviors, nearly 40 percent will boost investments in marketing and loyalty programs and offer more customized ordering experiences.
“Technology became an even more powerful ally to restaurants when COVID hit and seemingly temporary solutions quickly became core to operations,” said Brendan Sweeney, CEO and co-founder of Popmenu. “Our study shows that adoption of automation will accelerate in 2022 as restaurants respond to rising market demand and a taxing labor shortage and position themselves for future growth. Diners can expect more tailored, digitally-enabled experiences built for convenience while restaurant owners and operators can expect competitors to turn up the volume on search engine optimization, data-driven marketing and on-premise tech.”
The Digital Divide
Paytronix Systems, Inc., published the latest report in its ongoing series “The Digital Divide: Delivery Service Aggregators and The Digital Shift,” a PYMNTS and Paytronix collaboration. The report highlights how ease-of-use, convenience are the top drivers when consumers make restaurant purchasing decisions. What’s more, even in on-premises situations, restaurants that offer digital first features, like mobile payments, will appeal to key audiences.
The report notes that consumers flocked to multiplatform aggregators during the pandemic and, even as restaurants have opened up, the time-savings offered by these platforms remains attractive. The same time and convenience factors drive consumers to look for digital-first features, like mobile payments or ordering via QR code, when visiting their local QSR and table service restaurants.
Download the full report, Digital Divide: Delivery Service Aggregators and the Digital Shift
“Convenience has a reputation for impacting consumer choice in restaurant service, but pricing influences all demographics' decision making. Pricing is not a linear concept for many consumers: surcharges and delivery fees appear to be perceived as friction during an order, but they often are overcome by advantages in convenience and user experience. Generations prioritize costs differently as well. Younger consumers are willing to pay a premium to save time, while seniors and baby boomers tend to sacrifice convenience to avoid delivery fees when choosing how to purchase from restaurants.” — The Digital Divide: Delivery Service Aggregators and The Digital Shift
The report findings include:
Multiplatform Users — Since the start of the pandemic, 42 percent of consumers have used at least one aggregator and 15 percent have used three or more, acting as “multiplatform users.” Consumers’ ongoing embrace of multiplatform aggregators stems from a desire for simplicity and convenience. Even as consumers have regained access to their favorite restaurants, multiplatform aggregators still provide the kind of time-saving conveniences many consumers, especially affluent younger adults, have come to rely on.
Demographics — Multiplatform users are more likely to be millennials (34 percent), have high incomes (22 percent earn more than $100,000 per year) and possess a college education (20 percent) than the average restaurant consumer. Consumers who do not use aggregators are more likely to be baby boomers and seniors (87 percent) and have lower incomes (70 percent earn less than $50K per year).
Digital-First Features — Multiplatform aggregator users are digital savants, using available technologies, such as mobile payment and QR code menus, to save time at a rate that is nearly twice that of delivery aggregator nonusers. That means consumers often gain time when they use digital-first tools such as mobile payment apps to make purchases, and this often boosts customer loyalty.
Loyalty Programs Increase — Restaurants have increased their loyalty program offerings, and 48 percent of consumers are using them. Table-service restaurant customers are slightly more likely to use loyalty programs than those of QSRs (45 percent and 42 percent, respectively). This makes sense, as consumers who perceive higher prices when dining in may respond to offers that save them money over time.
Paytronix also released a preliminary analysis of restaurant holiday gift card sales, which suggests a return to normal for some brands and predicts a strong start to 2022. Early indicators show this season finishing slightly ahead of 2019, the last year before the pandemic; but when looking one step deeper, the data suggests a large divide between winners and losers.
Overall, Paytronix numbers indicate a 43 percent increase in the number of cards sold, when comparing the 2021 holiday season (November 1 through December 24) to the 2020 season. When compared with 2019, restaurants sold six percent more cards overall.
In terms of total value added to cards, 2021 numbers were 57 percent ahead of those in 2020 and 4.7 percent larger than in 2019. Numbers were more even when looking at the average amount loaded. Consumers in 2021 loaded an average of $35.34 compared with $32.03 in 2020 and $35.84 in 2019.
The sales numbers exceed the early indications shown when Paytronix examined Black Friday restaurant gift card sales.
“It’s clear that the restaurant industry is starting to recover from the pandemic, but the nature of that recovery will continue to reveal itself as we take a deeper look at the numbers,” said Paytronix CEO Andrew Robbins. “When we look at the median vs. mean sales, we see a divergence, suggesting that some restaurants and restaurant types are getting the bulk of the gains. We also saw an initial surge in fine dining sales on Black Friday that could point to a consumer desire to return to in-person dining. But that early sales spark could have been derailed by the emergence of Omicron during the last few weeks of the season.”
The gift card sales data points to a strong start to 2022. A survey from the National Restaurant Association found that 62 percent of consumers hoped to receive a restaurant gift card as a holiday gift, and 24 percent of respondents said they would spend those cards as soon as possible.
This holiday gift card sales analysis is part of a larger analysis that will be published in 2022. This research will supplement the Paytronix Annual Gift Card Sales Report: 2021, which surveys brands about their annual gift card sales over the course of the year. Paytronix offers an in-depth look into holiday gift card sales, sales by channel and service type, anticipated redemption, and new insights on eGift cards. With the online ordering industry expanding, the report also examines the impact of gift cards redeemed online.
People Want to Eat Healthier
Forty-six percent of consumers indicate they want to eat healthier in 2022, making it the most highly-ranked lifestyle change, followed by working out more often and spending less money, according to a new survey by Nextbite. At the same time, 49 percent of consumers plan to order healthier food for delivery in 2022. In fact, offering healthier food delivery options is the third most motivating way to get consumers to order delivery more often (closely followed by faster delivery times and more food variety).
For all ages, eating healthier in 2022 is a top-ranked resolution, including 48 percent of 18-24 year olds and 45 percent of 25-34 year olds. Eating healthier doesn’t necessarily mean adopting a trendy new diet, as only 6 percent plan on trying the keto or Whole360 diet.
The momentum and demand for delivery food continues in the coming year. Fifty-nine percent of consumers are currently ordering food for delivery once a month or more and 41 percent plan to order it more often in 2022. The survey also reported that 33 percent order food for delivery once a week or more. Consumer delivery demand continues to increase, despite Covid lock-downs disappearing, children returning to school, and adults going back to work in-person. In a Summer 2021 survey, Nextbite found 43 percent were ordering food at least once a month, and 23 percent were ordering weekly.
“Restaurants have a huge opportunity in 2022 to adopt virtual menus to reach new customers for delivery and takeout, but also to offer new healthier options consumers crave,” said Nextbite Vice President of Brand Mickey Citarella. “Delivery and takeout are no longer viewed as unhealthy, and it’s important to focus on supplying consumers with fresh options that are both delicious and nutritious. If we do this, we’ll continue to see delivery orders increase.”
McDonald's Supersized Recovery
McDonald’s started 2021 off in a rut, but by the summer months, it had completely recovered from the pandemic — that’s according to a new report from foot traffic analytics firm Placer.ai, called Placer Bytes: McDonald’s…. The pandemic threw McDonald’s (like most other restaurants) a number of curveballs, but “the fast-food leader saw its traffic increase significantly in July 2021, and visits have stayed in line with 2019 levels ever since,” the report says. Take these data points, for instance: In January 2021, visits to McDonald’s were down 33 percent compared to January 2019. By July, they were up 0.4 percent compared to July 2019.
That’s a supersized comeback if there ever was one.
Report highlights:
Where MCD stands:
As mentioned, McDonald’s saw foot traffic recovery steadily over the course of the year.
In November, visits were down 1.9 percent compared to 2019, however, but in October, they were up 3.8 percent.
Foot traffic patterns still recovering:
Visits are back, but customers aren’t staying as long — the report notes that the median visit length for customers was 26 minutes in 2021, a decrease of more than 10 percent from 2019. New ordering methods and shorter lines may have resulted in those reduced stays, however.
Lunch and breakfast:
The pandemic’s effect on the workforce (fewer workers out and about) may still be hurting visits during breakfast and lunch hours. From the report: “Between July and November 2019, 49.8 percent of daily visits to McDonald’s took place before 3 PM, compared to 46.4 percent of visits that took place between 3 PM and 11 PM. During those same months in 2021, McDonald’s received 50.1 percent of its visits after 3 PM, and only 45.4 percent of its visits before 3 PM.”
Chicken Sandwich Wars Winner
In recent years, fried chicken connoisseurs across the country have been captivated by the ever-evolving Chicken Sandwich Wars and constant tête-à-tête between the nation’s leading chicken chains. Today, leading restaurant review aggregator Merchant Centric is declaring a winner and settling the debate once and for all.
According to thousands of reviews pulled from the web’s top review sites between January 2021 and June 2021, Chick-Fil-A was the clear winner in the eyes of guests, boasting an average star rating of 4.39 compared to Popeye’s 3.39. It’s also worth noting Chick-Fil-A sits more than half-a-star higher than the quick service segment’s average star rating (3.73), while Popeye’s is almost half-a-star under that marker. See chart below for more details.
Flavor of the Year
Monin introduces the 2022 Flavor of the Year: Passion Fruit.
This flavor is on-trend with customers across all segments asking for it. It not only offers a micro escape and is reminiscent of a tropical getaway, but its bright color and tart flavor is the perfect complement to all types of beverages. As operators look to diversify their menu and appeal to the consumer mindset of adventurous without too much of a risk, passion fruit fits right in and hits on all the trends.
“Monin has identified significant consumer and professional interest in our Passion Fruit products, and we expect the flavor to have substantial use in 2022 beverages and foods. Outside of the trends and the growing traction, another reason to be named the Flavor of the Year is because it offers amazing versatility and is both exotic, yet approachable for consumers to enjoy” says Bill Lombardo, CEO of Monin Americas. “The four delicious, natural products in our Passion Fruit portfolio transform everything from teas, sodas, cocktails, milkshakes, sauces, salad dressings and much more, into captivating flavor experiences.”
“Passion Fruit is full of vibrancy, from the color to the refreshing taste, and it allows people to briefly escape from reality,” says Stasha Johnston, senior vice president of marketing. “As we enter a new year, people are craving flavors that deliver safe adventure and provide an enchanting experience, and what better than a bright flavor that makes you think of a tropical vacation?”
Passion Fruit has grown 20 percent over the past four years on U.S. menus and in 2022, Datassentials projects the flavor will be on nearly 15 percent of menus. Monin has seen increasing sales traction for its portfolio of Passion Fruit flavorings and anticipates this momentum to continue in 2022 and beyond.
According to Monin proprietary research, 67 percent of consumers indicated they would like to try a beverage featuring Passion Fruit flavor.
Foodservice Packaging Trends
The Foodservice Packaging Institute’s 13th annual Trends Report shows that industry opinions remain focused on COVID-19 concerns showing that cost, supply, logistical and labor challenges have exceeded the predictions of the past year, along with a large focus on delivery and curbside pick-up.
“We continue to navigate these ongoing effects of the pandemic as only the foodservice packaging industry can,” said Natha Dempsey, president of FPI. “Despite the challenge of rising costs across the board, we’ve proven through these difficult times that our industry is ever-evolving to meet the needs of foodservice operators and their customers — pandemic or not.”
Respondents reveal a major trend is increased business costs. Whether due to logistics, labor shortages, supplier disruptions, rising inflation or all of the above, the continued volatility associated with costs and pricing have affected the entire value chain. Transportation issues ranging from the importing of materials and packaging, to driver shortages and long wait times are commonplace. The availability of materials and products — including raw materials, machinery, foodservice packaging or the food items being served in those packages — have all been held up at one point or another by labor shortages. These shortages are expected to remain for the foreseeable future.
The survey highlights the prevalence of technology in the foodservice arena. There’s new technology specifically for the delivery and takeout space; meals may be delivered over the counter to a customer in minutes, travel in a car, robot or drone for 30 minutes, or it may sit in a heated or cooled locker for an extended period of time.
“Foodservice packaging plays a central role in delivering quality products to customers, especially as more channels involve less human interaction. The package sometimes becomes one of, if not the first and only interaction a customer may have with a particular brand, making it even more important that it has the ability to perform across a number of applications while fulfilling a variety of needs,” Dempsey said.
The first section of the report compiles direct comments and insights by industry respondents. The second section provides high-level trends in the foodservice packaging industry based on FPI staff analysis of member submissions, as well as FPI’s general industry observations.
The Foodservice Packaging Institute’s 2021 Trends Report is available only to FPI members. Non-members may view an executive summary online on FPI’s website.
2022 Wedding Trends
WeddingWire released its 2022 wedding trends report, which finds that couples are putting greater emphasis on personalization and their guest experiences, throwing aside typical tradition. WeddingWire’s 2022 wedding trends are less about specific items and “must-dos,” and more about new ways of thinking about the wedding as a whole and providing options for all couples.
“Couples have waited so long to celebrate with family and friends, they're going to do things their way and not do things just because they're ‘tradition’ or expected by family—whether that means experimenting with bold colors, switching up the traditional wedding-day timeline (cocktail hour first!), or planning with a sustainable mindset,” said Kim Forrest, Senior Editor, WeddingWire. “We're excited to see all the ways couples will express themselves in 2022.”
WeddingWire 2022 Wedding Trends
Guest-Centered Mindset
Weddings in 2022 will see a change in mindset from couple-centered celebrations to guest-centered ones. Knowing their wedding may be the first time guests are returning to parties once again, couples are putting their friend’s and family’s health and safety, comfort and enjoyment first and foremost. This can mean something as simple as changing up the seating arrangements for a circular wedding ceremony with guests seated in a circle around the couple so they can see them and each other from all angles. Serving signature mocktails so guests who aren’t drinking have something to enjoy, or offering vegan expertly crafted dishes where even the carnivores and pescatarians will appreciate the veg as the star of the show – couples are focusing on the guest experience as their main priority.
Switching Up the Timeline
Throughout 2020 and 2021, couples had to get creative with their wedding timeline – expect this to continue throughout 2022. Couples who eloped or hosted a minimony are now ready to celebrate, so guests will skip the formalities and head right to the party. For those hosting a more traditional ceremony and reception on the same day, many are opting for a pre-ceremony cocktail hour, enjoying cocktails, food and greetings up front, followed by the ceremony and reception.
Renewed Focus on the Environment
Throughout the wedding planning process, couples are keeping the environment top of mind and finding ways, big and small, to minimize waste. Whether sourcing sustainable catering, ordering recycled paper invitations, receiving digital RSVPs through their wedding website, or utilizing local vendors, couples are leaning into sustainability. In 2022, dried flowers will make their way into weddings for a stylish and sustainable decor trend. Zero-waste cuisine, a pig-on-a-spit roast or serving unused breads and cheeses from the cocktail hour at brunch the following day, will also gain in popularity. Charitable favors, where couples donate a dollar amount per guest to a non-profit close to their hearts, is a great way to share values with guests and reduce waste.
Bold, Bright Colors and Earthy Neutrals
There’s a dichotomy when it comes to the hottest color schemes of 2022 – some will lean into bold and bright colors while others will embrace earthy neutrals. Couples are choosing a wider more malleable palette of six to 10 hues, rather than picking just two or three, and playing up color like never before. Expect to see bold pinks, purples, reds, and oranges—and lots of mixing and matching— as couples are ready to celebrate. Also present in 2022 will be color palettes in earth tones like nude, beige, soft white, dusty rose and rust due to couples’ increased focus on the environment emerging from the pandemic.
Well-Crafted Food and Beverage Experiences
Couples are increasingly prioritizing a well-crafted food experience within their wedding budget, ensuring their guests dine on cuisine that’s fun, interesting, locally sourced, and above all, completely delicious. Buffets are nothing new, but grazing tables—where guests can pick and choose what they want throughout the night—are becoming the new-new, especially if couples are hosting a less formal affair. Brunch weddings will also be popular in 2022 due to dwindling availability of Saturday nights, with creative food ideas like fried chicken and waffles, biscuit sliders, breakfast tacos, donuts and mimosa bars. The classic cocktail is making a comeback with couples requesting French 75s, Bushwhackers, Palomas, and Old Fashioneds. Champagne towers are also back and are becoming a favorite way to add a vintage touch to a reception.
Mini-Cakes, Bold Statements and Impressionist Details
A great solution with safety in mind, individual mini cakes will continue to be popular in 2022. Not only is it safe for guests, but this trend allows couples to choose a variety of flavors instead of settling on one. Cake hoops made of wood and adorned with pastel petals or gold geometric shapes wrapped in lush greenery will provide a standout way to give a smaller cake a larger presence. Additionally, abstract painterly details using frosting and other sugar adornments to paint the cake and brushstrokes to achieve a three-dimensional look will bring cakes an Impressionist painter look perfect for a garden wedding. Also expect to see bold, bright cakes with rich hues, alternate textures and metallic colors that will make guests do a double take.