Drive-Thru Shake-Up (Infographic)
3 Min Read
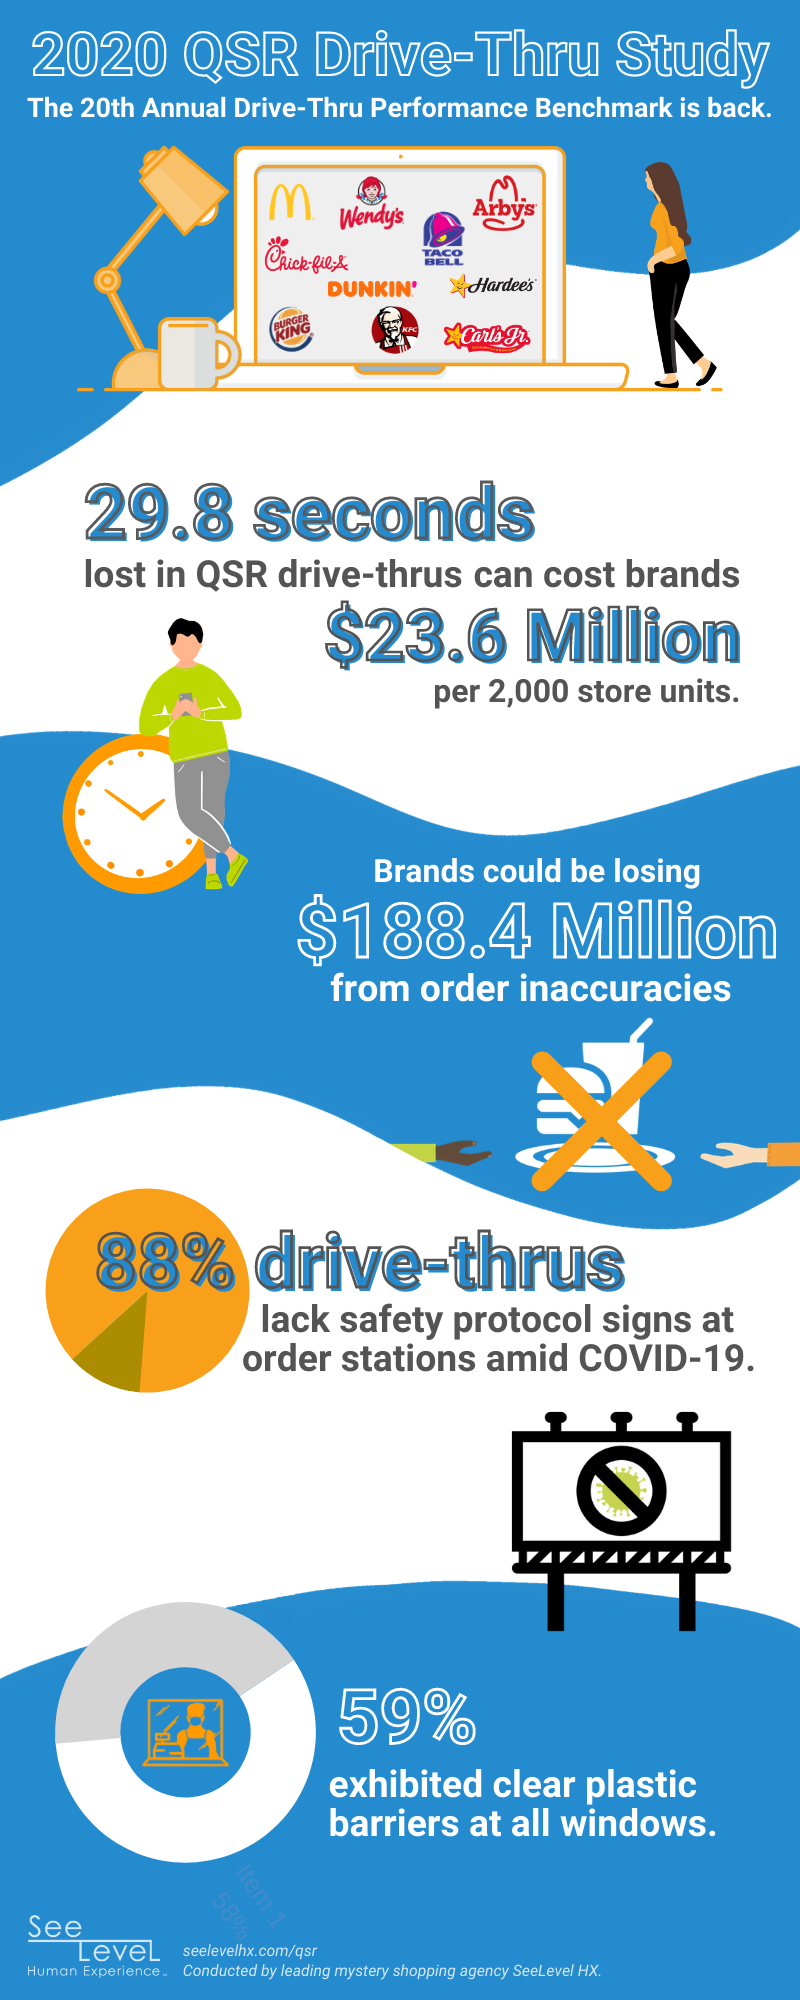
According to data revealed in SeeLevel HX's 2020 QSR Drive-Thru Study, there's been a shake-up among restaurants with the fastest total time, which consists of both service times and wait times with KFC taking the lead followed by Taco Bell, Hardee’s, Carl’s Jr., and Burger King.
The research captures year-over-year drive-thru performance and compares the consumer experience at quick service restaurant (QSR) brands in multiple categories including order accuracy, speed, taste, and service. Ten major brands and 1,490 drive-thru visits were included in the study conducted by the mystery shopping market research agency. The marks the 20th year of the industry benchmark report and the first year it has been issued independently.
The report also uncovered that total times across all brands were 29.8 seconds slower than last year. Surprisingly, service time, the time from placing an order to picking up, was actually 16.9 seconds faster this year at 238.1 seconds compared to 255 seconds in 2019. However, slower wait times in 2020 increased the overall total times down, equating to a substantial loss in revenue opportunities with a typical brand losing up to $64,182,668 annually per 2,000 stores.
This year, the study also explored COVID-19’s impact on the industry, establishing the first and only performance baseline to date. Most surprisingly, 88 percent of drive-thrus visited did not have signs posted at the order station to indicate safety standards such as masks, gloves, and social distancing requirements. Also notable, slightly more than half of the drive-thrus visited (59 percent) displayed plastic barriers separating customers from employees at all windows.
“The pandemic is continuing to have a massive impact on QSRs from a spike in traffic and stricter safety standards and protocols to a substantial increase in staffing turnover and training, so I’m not surprised to see a dip in speed of service,” said Lisa van Kesteren, SeeLevel HX CEO. “Still, every second has a substantial impact on the bottom line. And as more restaurants rely on the drive-thru for the majority of their revenue during this pandemic, and likely long term, it’s never been more critical to focus on improving wait time by investing in technology like menuboards and mobile to stay competitive.”
Here’s how the brands stacked up within the top four categories:
Speed of Service
- 2020: KFC, Taco Bell, Hardees, Carl’s Jr., Burger King
- 2019: Dunkin’, Carl’s Jr., KFC, Burger King, Hardees
Order Accuracy
- 2020: Chick-fil-A, McDonald’s, Arby’s, Burger King, Dunkin’
- 2019: Chick-fil-A, Burger King, Wendy’s, Arby’s McDonald’s
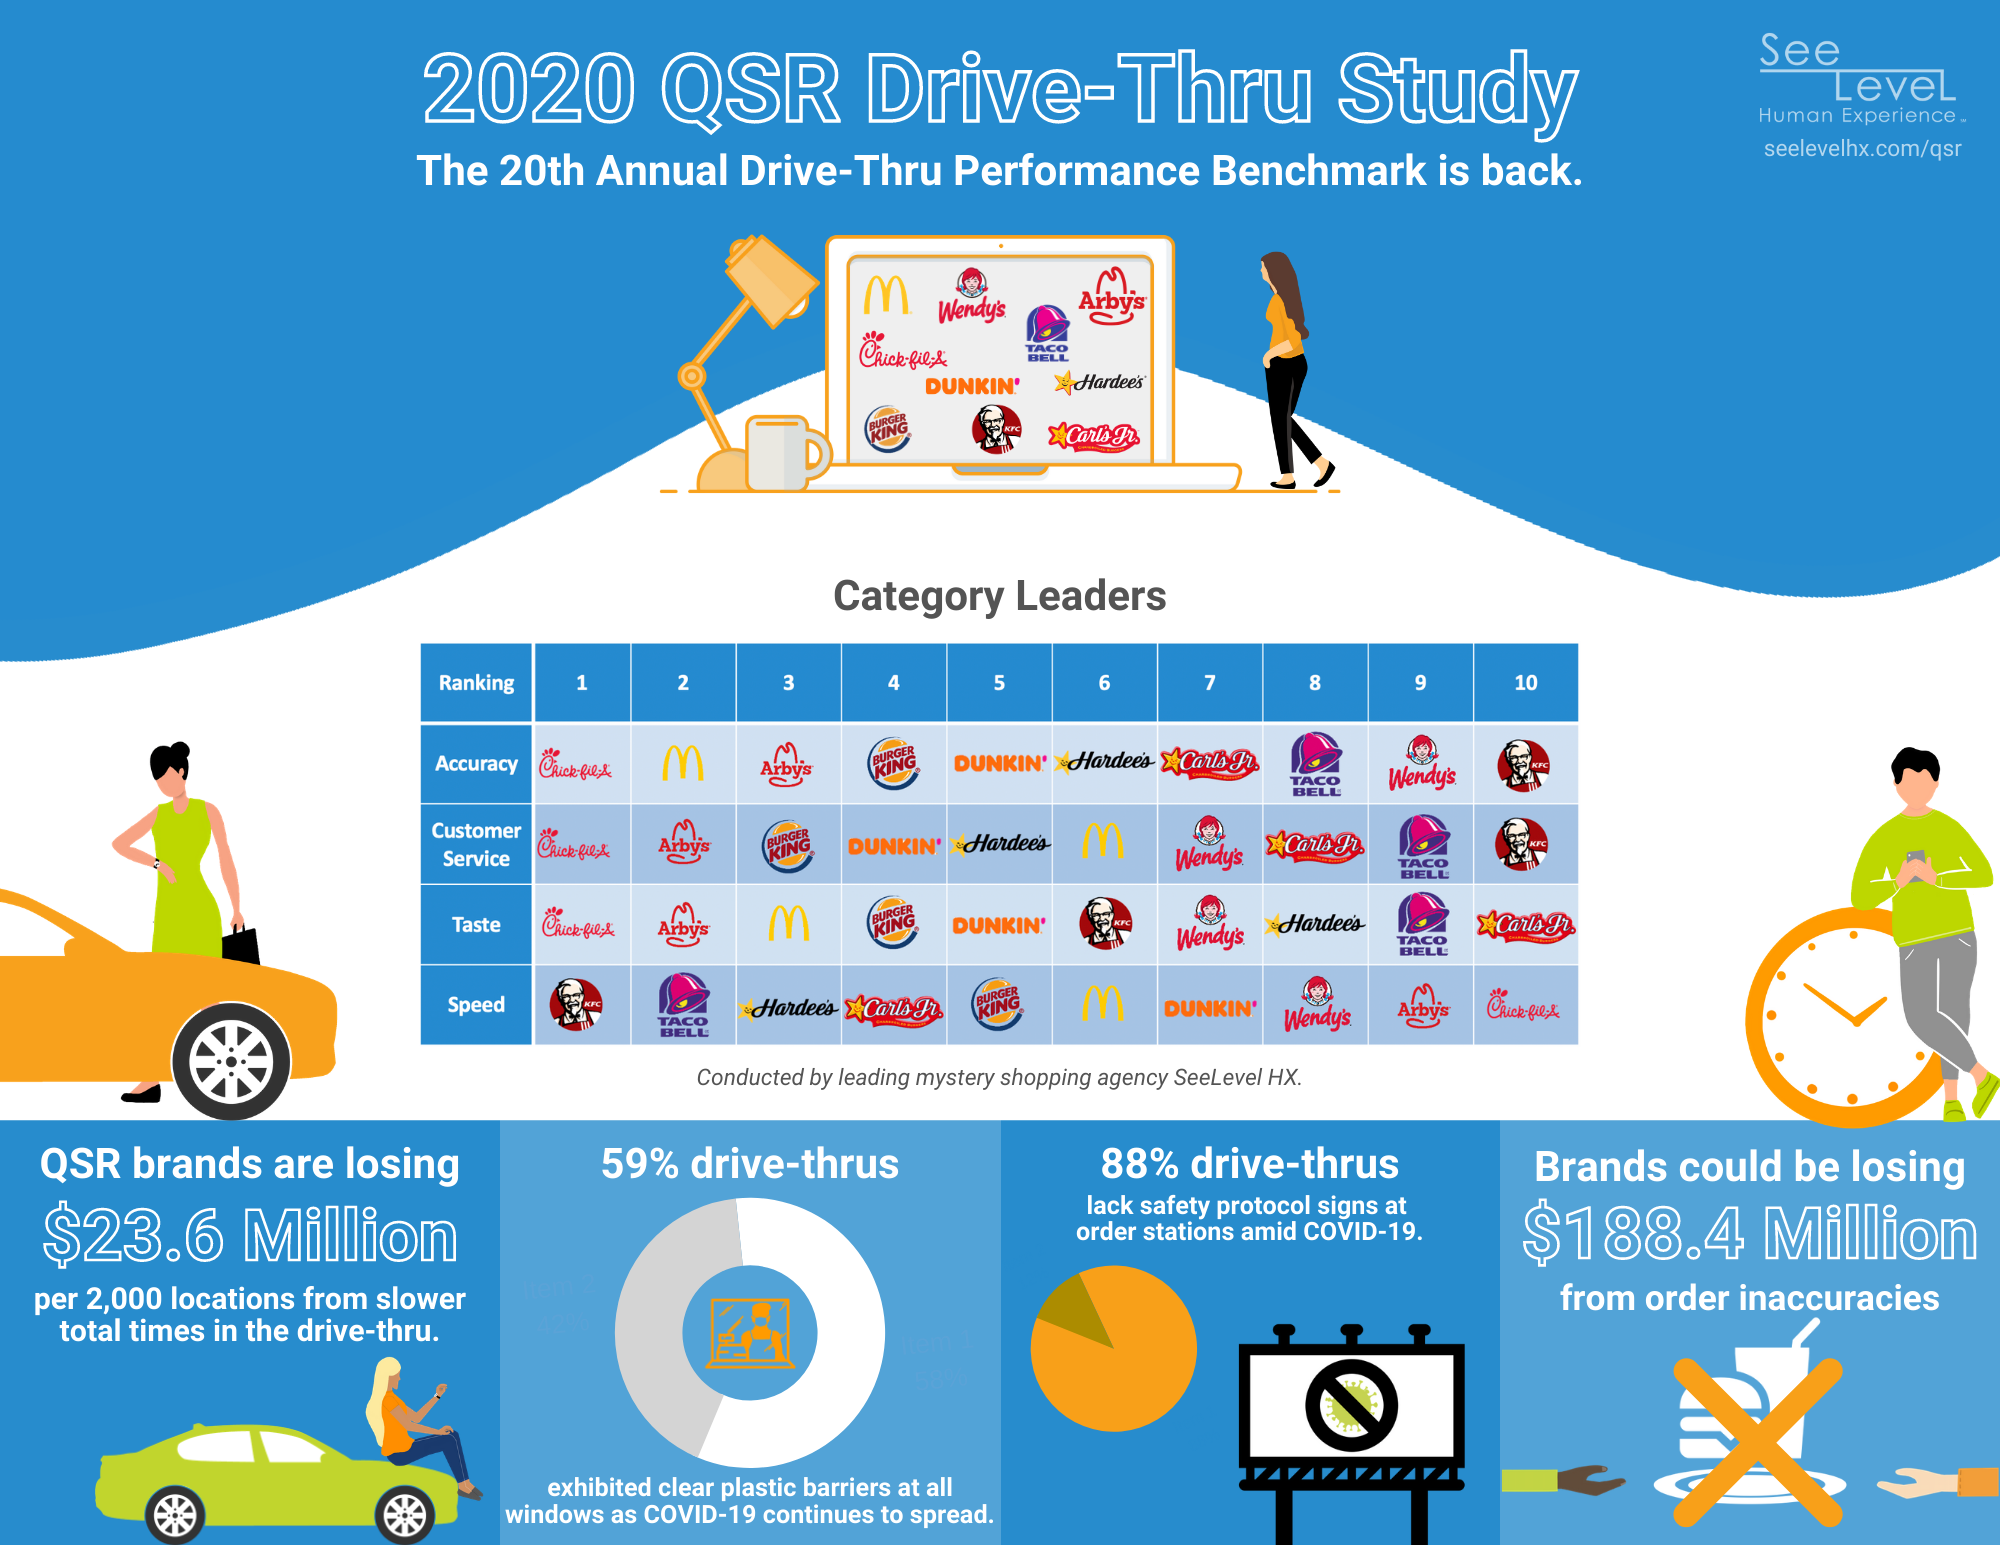
Customer Service
- 2020: Chick-fil-A, Arby’s, Burger King, Dunkin’, Hardees
- 2019: Chick-fil-A, Taco Bell, Wendy's, Arby’s, Dunkin’
Taste
- 2020: Chick-fil-A, Arby’s, McDonald’s, Burger King, Dunkin’
- 2019: Chick-fil-A, Arby’s, Wendy’s, Taco Bell, Burger King
Additional findings include:
QSRs had mixed responses to COVID-19
- 91 percent of employees were wearing masks at the payment and pickup windows.
- The majority of orders (80 percent) were handed directly to customers while only 16 percent were placed on a tray.
- Only nine percent of drive-thrus notified customers of a limited menu.
Order accuracy improved slightly over 2019
- Order accuracy was up to 87 percent after a slight decline in 2019 at 84.4 percent.
- On average, inaccurate orders cost $94,232 per store each year.
Order confirmation boards savings more than doubled in 2020
- Of the 40.8 percent of drive-thrus with order confirmation boards, service times were 17.4 seconds faster than those without.
- Stores more than doubled their potential savings in 2020 with an order confirmation board due to faster service times. In 2020, the potential savings per store is $39,138.95 compared to $14,085.35 in 2019.
Majority of stores lacked suggestive sells
- 72 percent of drive-thrus did not have a suggestive sell, which could potentially cost a store $16,206 annually.
- Service times with a suggestive sell were 7.2 seconds faster than those without.
Number of drive-thrus with digital menuboards is up slightly this year
- 23.2 percent of drive-thrus had a digital menuboard in 2020 compared to 19 percent in 2019.
- Digital menuboards decreased service time by 12.3 seconds.
- On average, one store potentially saves $27,922.50 per year from digital menuboards due to faster service times.
- For the first time since digital menuboards were introduced, brands are finally seeing a ROI this year on reduced total times from digital menuboards.
Pre-sell menuboards contributed to slightly slower speed times
- 54.3 percent of drive-thrus had a pre-sell menuboard in place, which lessened total times by 13.2 seconds.
- The majority of drive-thrus at McDonald’s, Carl’s Jr., Hardee’s, Wendy’s, Arby’s, and Burger King had pre-sell menuboards in place.
“It’s extremely important to keep in mind that the objective performance data consists of averages and varies greatly by brand,” van Kesteren added. “Also, brands don’t need to be first in every category. It’s exceedingly more important to stay true to the brand, invest in what they’re good at and what they are known for, and focus all marketing initiatives there.”
The report is available here.