
According to a Recent Study/Survey … Mid-September 2018 Edition
45 Min Read
This edition of Modern Restaurant Management (MRM) magazine's "According to …" research roundup features the Good Food 100 Restaurants, fast food foot traffic in NYC, the top signs of a foodie, Mexican food trends, how the combination of 5G, AI and IoT is set to change the Americas and the appeal of natural cork.
Best Sales Growth in Nearly Three Years
The restaurant industry continued its recovery in August. Same-store sales were up 1.8 percent, making it the best month since September of 2015. However, Hurricane Harvey hit the Texas coast in August last year, greatly impacting sales in the last week of that month, giving restaurants a built-in advantage. That soft comparison resulted in same-store sales growth of 2.9 percent for the last week of August 2018. These insights come from TDn2K’s Black Box Intelligence™ data, based on weekly sales from over 30,000 locations representing 170+ brands and nearly $70 billion in annual sales. “Regardless of the hurricane impact, it is important to highlight that sales were strong in August,” said Victor Fernandez, vice president of insights and knowledge for TDn2K™. “At the end of July there was concern that restaurant sales might be slowing and the much-awaited recovery might be coming to an end. Nonetheless, sales in the first three weeks of August, which were pre-hurricane, were up 1.5 percent. Had this been the final result for the month, it would still have been the best performance since September of 2015 and it represented a 0.9 percentage point improvement over July’s same-store sales.”
Despite Sales Recovery, Restaurants Continue to Lose Guests
Same-store traffic was down -0.8 percent in August. It is telling that the industry posted the strongest result in the last three years, but it was not enough to escape the continued slide in guest counts. As with sales, traffic comparisons were also aided by the hurricane. Traffic for the first three weeks of August, a reasonable representation of the month’s traffic performance, dipped -1.2 percent. Although not particularly strong (April’s traffic growth was better), this represents a 0.5 percentage point improvement over July.
Economic Growth Robust, But Consumer Spending May Begin to Moderate
“There are few signs that the economic upsurge will slow sharply anytime soon,” predicted Joel Naroff, president of Naroff Economic Advisors and TDn2K economist. “Manufacturing activity is strong and businesses are starting to spend their soaring after-tax profits.” “The measured wage gains remain modest, but that does not mean employees aren’t doing better. Firms are increasing compensation by raising benefits, whether they are health care, retirement or non-traditional perks. That is helping firms capable of paying the higher compensation costs to attract workers. However, these limited wage gains represent a problem for consumer-related businesses. With job growth limited by the lack of workers, total income increases are not expected to accelerate significantly and while demand has increased recently for these businesses, growth is likely to moderate over the next six months.”
Restaurant Staffing Difficulties Continue
With the national unemployment rate average at 3.9 percent over the last four months, it is no surprise that operators struggle to keep restaurants fully staffed. Things are even more difficult in certain parts of the country, with 20 states reporting unemployment of 3.6 percent or less in July. In addition to retention issues, restaurants are dealing with their own expansion and what it means for their recruiting efforts. According to TDn2K’s People Report™ Workforce Index, 43 percent of brands expect to add management staff during the third quarter of 2018, while 49 percent plan to increase their hourly employee staff. Yet restaurants are finding that adding staff in this environment is not easy. According to this report, 59 percent of companies face increasing challenges for recruiting restaurant managers. A substantial 74 percent of brands said recruiting difficulty for hourly employees increased in the latest quarter. Still, there is some good news. The latest People Report metrics indicate turnover rates for both managers and hourly employees dropped slightly in July. Considering the close relationship that exists between employee retention and guest sentiment particularly based on service (as measured by White Box Social Intelligence™) this is cause for cautious optimism going forward. Furthermore, research reveals that top performing brands in sales and traffic (as measured by Black Box Intelligence) are already ahead of the curve in people practices that enable best in class retention and guest satisfaction.
Looking Ahead
Prior year events will have some unsettling effects on sales in the upcoming months. Hurricane Irma, which hit Florida and the southeast in early September 2017, will certainly impact comp sales for those areas, much the same as we reported from the Harvey effect. Other factors aside, we expect strong sales in the southeast in September. Given the magnitude of those economies, same-store sales should get a boost at a national level from the Irma effect. At the same time, the recovery period in Texas following Harvey drove sales as many residents were unable to prepare meals at home. In addition, the influx of people pouring in to provide aid also drove demand. The result is tougher prior-year comps which may impact results in those regions. Overall, given the current relative strength of the industry and September 2017’s soft results, there is room for some continued strong positive growth for the industry as we close the third quarter.
Top 500 Chain Restaurant Report 2018 Forecast
The first-ever Top 500 Chain Restaurant Report 2018 Forecast has been released, with projections revealing that the Top 500 chain sales will grow 3.2 percent by the end of 2018. The full forecast is now available, providing segment- and menu category-level growth along with chain-level sales and unit counts for the leading 100 chains.
"We're seeing some major movement within the top 10 chain rankings based on our 2018 projections," said Joe Pawlak, Technomic managing principal. "Several growth players that we've been watching over the past couple of years are starting to encroach upon chains that are struggling to overcome branding and operational challenges."
Key trends and highlights include:
- After dipping to 3.0 percent in 2017, Technomic forecasts that cumulative sales growth for the Top 500 chains will increase modestly to 3.2 percent in 2018.
- The quick-service segment is forecasted to increase its sales this year, propelled by the impressive sales growth from Taco Bell, Chick-fil-A and Domino's as well as another solid year from McDonald's.
- Growth for the fast-casual segment is forecasted to remain strong but the days of annual double-digit sales growth have likely concluded.
- Sales growth for full-service chains is expected to improve marginally in 2018 after having slowed to 0.9 percent in 2017.
This forecast was developed as an extension of the annual Top 500 Chain Restaurant Report. Technomic leveraged year-to-date performance data from its Transaction Insights product as well as investor releases from publicly held companies. Each chain's growth trajectory from prior Top 500 reports were also considered.
Good Food 100
The Good Food Media Network released its annual Good Food 100 Restaurants list, an annual rating and economic report offering insight into the purchasing practices of chefs and restaurants and their commitment to sustainable sourcing.
Conducted in conjunction with the Business Research Division (BRD) of the Leeds School of Business at the University of Colorado Boulder, an analysis of restaurants’ food purchasing data found that the overall food purchases of the 125 participating restaurants totaled $120.1 million. Of this, restaurants reported domestic spending $80.1 million on good food, which translates to a $255 million economic impact on the national good food economy.

“Food is better when it’s fulfilling, not just filling,” said Sara Brito, co-founder and president, Good Food Media Network. “We know that to be truly good, food has to be good for every link of the food chain. The Good Food 100 Restaurants analysis demonstrates that there is a tangible economic benefit as well. A dollar spent on good food is more than tripled in terms of its economic impact. That’s a profound effect.”
Corresponding with the economic report, the Good Food 100 Restaurants list is carefully curated based on the quantitative measurement of participating restaurants’ self-reported annual food purchasing data. Restaurants are rated with two to six links—symbolizing links in the food chain—based on the percent of total good food purchases. These purchases support state, regional and national good food producers and purveyors.
“Transparency in food sourcing is an increasingly important issue. By offering a snapshot of what happens behind kitchen doors and restaurants’ commitment to sustainable purchasing practices, the Good Food 100 holds chefs accountable and instills consumer confidence so eaters are empowered to make the best possible dining decisions,” added Brito. “Congratulations to all the 2018 Good Food 100 Restaurants. We look forward to continuing our collective mission of creating a good food system for all.”
To read the full economic report and learn more about the list, please visit the Good Food 100 Restaurants website.
What QSRs New Yorkers Prefer
A study conducted by Blis, a global location data solutions provider, tracked unique foot traffic patterns at Burger King, Chipotle, KFC, McDonalds, and Taco Bell locations across New York City’s five boroughs over a two-week period.
Here’s what they found:
Chipotle is NYC’s most popular fast food chain. The people of NYC love this chain regardless of their food poisoning scandals, with an average of 405K unique visitors across all locations and boroughs. Mondays afternoons in Manhattan are the busiest time periods for Chipotle, with almost double the foot traffic of NYC’s second favorite fast food chain, McDonalds.
Media planners: be careful of Staten Island. With the smallest population, the often forgotten borough has the lowest foot traffic of all, which media planners should take into consideration when apportioning budgets per regions and restaurants. Manhattan, which consistently has the highest foot traffic, would be a better bet for your campaign.
No one seems to have tacos for breakfast! Across all locations and boroughs, Taco Bell was the least visited store with 20K unique visitors. During the morning hours, the foot traffic is half of what it typically is during the afternoon hours of 12-5 p.m. Brooklyn showed the most love to the chain, with Manhattan a close second. It seems like Taco Bell will be sharing the love back with their plans to open an additional 125 stores in the area before the end of the year.
Overall foot traffic per location:
- Chipotle- 405k uniques
- McDonalds-274k uniques
- Burger King- 245k uniques
- KFC- 96k uniques
- Taco Bell-20k uniques
Lunch vs Dinner
- Manhattan sells more for lunch than it does for dinner, which is the opposite of BK and Queens.
- BK and Queens sells the same for lunch and dinner
- If getting a QSR (quick serve restaurant) dinner in Manhattan, people are doing it earlier than other boroughs; if going to a McDonalds or Burger King they are doing it straight after work, then it dips, then spikes again 9-10pm.
- If you go straight home, you get to your QSR and dinner a bit later by 6-7pm (which is where the outer boroughs spike in foot traffic)
Locations
- Staten Island lowest foot traffic for all boroughs (smallest population)
- Manhattan has highest
- Media planners beware, when apportioning budget per region/rest, a QSRs in study in Staten Island is going to have less visitors vs Manhattan
Day of Week
- Tuesdays have the lowest foot traffic of the week for all QSRs
Burger King
- Manhattan- bigger spike than other boroughs during lunch, which could imply there is a higher number of people working in Manhattan; office hour break times have a bigger impact of foot traffic than somewhere like Brooklyn.
- Amount of foot traffic increased between 7-8am, then a bigger spike 8-9am in Manhattan, suggesting people don't want to eat breakfast on train; rather, get to work first and then get themselves breakfast (so at a Burger King closest to their office vs their home).
- Most highly visited Burger King is Manhattan on a Monday and majority is at lunchtime
- Foot traffic drops in the time of two hours from 5-6pm vs 8pm; foot traffic in Manhattan pretty much halves (steep drop off)
- Manhattan, BK, Brox, Queens, Staten Island in order of most to least foot traffic
Chipotle
- Sells more at lunch in Manhattan vs dinner
- Manhattan, BK, Queens, Bronx, Staten Island in order of most to least foot traffic
- Dinner is a U shape, same as Burger King
- Monday in Manhattan highest foot traffic
- Queens has more traffic on the weekend compared to other locations that doesn't really have a spike on the weekend
KFC
- Manhattan, Queens, BK, Bronx, Staten Island in order of most to least foot traffic
- Sells more for lunch vs dinner in just Manhattan
McDonalds
- Manhattan, Brooklyn, Queens, Bronx, Staten Island in order of most to least foot traffic
- Busier for lunch vs. dinner in Manhattan
- Breakfast time people are getting to Manhattan first then getting breakfast between 8-9am rather than on way to train station
- Manhattan can expect to serve same number of customers for breakfast as it does for dinner where suburban locations serve more for dinner vs breakfast (don't want to get it on way to work then after get out of office and onto train home)
Taco Bell
- Brooklyn, Manhattan, Queens Bronx, Staten Island in order of most to least foot traffic
- Most traffic'd day is Manhattan on a Wednesday
- Manhattan busier for lunch vs other locations
- No one seems to have tacos for breakfast!
Capitalizing on Visual Effect in Social Media
As millennials continue to lead trends in consumer habits, foodservice operators should capitalize on the visual trend through social media to reach out to this segment, says leading data and analytics company GlobalData.
In a bid to tap into this trend, Japanese sauce maker Kenko Mayo has rolled out a blue-colored salad sauce with spirulina extracts and collagen. The product’s electric blue color is due to spirulina content.Kenko Mayo added collagen and focused on its visual properties. This innovation resulted in an unusually specific healthy sauce, capitalizing on the visual trend that grips young, health conscious women.
Global sentiment shows that consumers are open to trying new concepts. This still holds true for the reserved Japanese consumer; as 51 percent of Japanese women aged 25 to 34 prefer trying new products over experiences, according to GlobalData’s 2018 Q3 consumer survey.
The company identified two trends that will drive the future of foodservice products. These are the trends to be connected globally via social media, and the increasingly popular trend of making products specified to consumer niches.
Cassius Prempeh, Consumer Analyst at GlobalData, says: “Kenko Mayo exceeded sales expectations and its success demonstrates a shift within Asia-Pacific. Rather than companies being the first movers when it comes to trend-setting, it is the consumer needs communicated on social media that dictate the direction in which companies take their products.
“Millennials are increasingly aware of the fuller visual experience. They pay more attention to the visual qualities of the food that they consume and share experiences with the world on social media, including Instagram.”
Indeed, according to GlobalData’s 2017 primary research, 49 percent of Japanese female consumers aged 25 to 34, share pictures of the food or drinks they consume on social media a few times a month or more, giving credibility to Kenko Mayo’s decision to target young health conscious women.
Prempeh concludes: “Whether this Instagrammable food trend can fully transform the eating habits of consumers or not, what we can see is vibrant – even artificial colors – paired with natural ingredients such as spirulina becoming a key purchase driver with consumers in Asia-Pacific. Kenko Mayo blue salad sauce’s success indicates that as long as there is a platform to post pictures, consumers will continue to pay more attention to the visual qualities of the food that they consume.
Who's a Foodie?
If you like to snack on prosciutto and parmesan cheese with your glass of prosecco, you might be one of the 74 percent of Americans that claim to have a sophisticated palate.
A new study of 2,000 Americans found that over half (56 percent) would even go so far as to consider themselves a “foodie.” Being a self-described “foodie” means that you like to try new foods (56 percent), want to learn more about the origins of foods (47 percent), and, of course, can cook a quality meal (42 percent).
You also might be a “foodie” if you have an understanding about food pairings, and even able to pronounce words like prosciutto (prō-ˈshü-tō) and bruschetta (brü-ˈske-tə).The new survey, conducted by the Consorzio del Prosciutto di Parma, also found that the average American will have their “taste awakening” at age 31, the age they feel their palate has fully matured.
Interestingly, only 14 percent of those aged 55 or older reported that they feel they have a very sophisticated palate. That same group was also least likely to describe themselves as a foodie. Compare that to the 36 percent of survey respondents aged 18-24 who said they have a very sophisticated palate.
Finding yourself bored with the food you eat? Try learning some history about it. 56 percent of Americans reported that learning about the history and origins of certain foods actually helps them enjoy it more.
“It’s not surprising that history holds a particular significance in consumer food choice. We’re proud of our history and origin, and being able to deliver an authentic, quality product to generation after generation,” says Chiara Iasiuolo of the Consorzio del Prosciutto di Parma. “Producing Prosciutto di Parma is an age-old tradition, as is the beauty of the perfect slice of prosciutto. It’s a delicious product that withstands the test of time in the kitchen.”
Cooking is also an integral aspect of discovering one’s food passion, with 92 percent of respondents saying good cooking is its own art form. But what inspires us to finally pick up the pots and pans and get cooking? Well, according to the results, our biggest influence is our parents, with 41 percent saying they first got inspired to cook watching their parents cook growing up.
Desiring to recreate an old family recipe was a reason 29 percent of Americans have felt inspired to cook.Dinner parties are also a fun way to share your food passion with friends as your palate matures, and, according to the results, Americans will host their first dinner party at age 26. And with the average American hosting four dinner parties every year, impressing your guests with what you bring to the table is a must.
But no need to go overboard, as adding something simple to the event can go a long way, with nearly half of Americans (43 percent) saying they would be impressed by the host at the sight of a charcuterie board at a party.
“We’re continuing to see a growing trend among U.S. food enthusiasts in which Prosciutto di Parma is considered a go-to food to include in special occasions,” said Jason Stemm of the Consorzio del Prosciutto di Parma.“It’s a food item that consumers are purchasing to elevate a meal and impress friends or family during a summer dinner party or holiday meal.”
Top Signs of a Foodie
Frequently trying new foods: 56 percent
Being interested in food origins: 47 percent
Being able to cook a quality meal: 42 percent
Having an awareness of what foods are in season: 32 percent
Knows how to pair cured meats with cheeses, wine and beer: 30 percent
Always have a restaurant you should try: 24 percent
Being able to pronounce difficult food names: 19 percent
Eating healthy: 19 percent
Having traveled to a country to try their food: 17 percent
The Future of Dinner
There was a time when Millennials were referred to as one big generational group and their behaviors were attributed to their generation versus their age or life stage. Much like Gen Zs are currently being described. Now that Millennials are older and vary in their life stages — single, married, parents — some of their behaviors when it comes to dinner planning are similar to when the generations that preceded them were in that life stage and other behaviors are based on their generational attitudes and values, finds recent food market research by The NPD Group.
Parents with children in the household, whether Millennials or Gen Xers, invest more time in preparing the dinner meal. The majority of meals are prepared and consumed in-home and it takes between 10 and 59 minutes to prepare and cook a family dinner. These types of invested dinners are forecast to grow over the next five years, according to NPD’s recent Future of Dinner study.
An example of a generational trait that sets Millennials apart from Gen Xers is that they believe that as long as they play a part in the meal preparation process, they made it. They don’t have to literally make the whole thing from scratch for it to be homemade in their eyes. Gen Xers, on the other hand, having grown up exposed to in-home cooking from scratch, acknowledge the difference between a homemade and a partially prepared meal.
And now a new generation is being examined and observed, Generation Z, those born 1997 to present and a larger group than Millennials. Many Gen Zs, a cohort NPD recently studied for its Make It Happen for Gen Zs report — were raised by Gen X parents who taught them to understand the purpose of food and how it fits into a well-lived life. As a result, this generational cohort has set expectations that food and food brands will follow their needs and not the other way around. When older Gen Zs, now young adults, plan their dinner they exhibit the same life stage behaviors that Millennials and other generations did as young adults. They are constantly blurring the line between access (how fast it gets to them) and convenience (how easy it is to use). Where the Gen Z generation differs from other generations is that they are growing up in a globally connected and fast-paced world and they expect flavors of the world to be available. This is a generational behavior trait that will most likely follow them through their life stages.
“It’s a common oversight not to age generations or recognize how life stage can impact behavior,” says David Portalatin, NPD Food Industry Advisor. “To understand the difference between generational and life stage behaviors enables food companies and foodservice operators to develop products, menus, and marketing messages that are more relevant to their target consumer audiences.”
What Tech Consumers Want
Hospitality Technology’s 7th annual Customer Engagement Technology Study finds that mobile, social and consumerization of technology continues to dominate technological change and the CET landscape within the hospitality industry.
The 2018 Customer Engagement Technology Study surveyed hotel and restaurant executives in addition to consumers to determine how tech deployments stack up against what guests really want and will influence decisions.
Key findings for restaurants:
- The top six restaurant mobile features currently available to consumers are related to commerce and include: restaurant search with location-based integration (74 percent), mobile payments (63 percent), receive and redeem coupons and deals (61 percent), mobile ordering (56 percent), loyalty program management (56 percent), and gift card purchases and redemption (54 percent).
- With the rise of voice controlled devices (such as Amazon’s Alexa and Google’s Home), HT expects to see significant growth next year among restaurants offering the capability to order food through these devices. Currently only 7 percent of restaurants offer this capability, however, 28 percent of guests say they want it.
Key findings for hotels:
-Mobile app use is also becoming ubiquitous. For those that offer a mobile app to guests, the most common features include room reservations (80 percent), loyalty program management (57 percent) and a calendar of events (50 percent) for on property activities, and check-in and -out capabilities (48 percent).
-Gaps exist between what consumers want from a hotel's mobile app and what is currently offered. Top functionalities and features guests want on a mobile app include: room reservations (68 percent), ability to change/manage reservations (65 percent), ability to receive and redeem coupons or other promotions (63 percent), ability to book award travel (54 percent), and the ability to control guestroom atmospherics such as lighting and temperature (55 percent) as top priorities.
- The average gap between top customer demands and hotels’ offered capabilities is between 35 to 40 percent. It will be important for hoteliers to address such key gap areas to empower their guests, create friction-free service, and provide the ultimate in guest convenience.
Technology is disrupting the hospitality industry and redefining how services are delivered and the very essence of the guest experience. While the technology capabilities today are impressive, they will be even more so in the future. Customers want service delivery choices, speed, convenience, empowerment, and value in addition to technology. Brands that master this will create outstanding, memorable guest experiences, generate loyalty, and win competitive advantage.
To download the 2018 Customer Engagement Technology Study, click here.
U.S. Wine Market Increase
The U.S. wine market reached 344.7 million nine-liter cases in 2017, an increase of 1 percent, according to the Beverage Information Group's 2018 Wine Handbook. That's down from a 2.4 percent gain in 2016, perhaps a sign of the category's struggle to compete with spirits and beer for share of beverage alcohol occasions.
As with the previous year, sparkling wines—up 5.8 percent in 2017—drove the growth. This marked the 16th consecutive year of increases for the total sparkling category. Strong sales of rosé and wines in the $15+ per-bottle price points also contributed: Consumers have discovered that sparkling wines are not just for special occasions and rosés are not just for warm weather.
Table wine saw modest growth of 0.8 percent to 311.8 million cases sold in 2017, led by a 1.2 percent increase of imported wines. This amount represents 90.5 percent of the total U.S. wine category, the Wine Handbooknotes, although some of the major table wine brands are struggling to capture consumer attention that's been lost to other products such as bourbon and craft beer.
Millennials are more interested in trying new flavors than adhering to one style or one brand, so they buy across different categories, countries and varietals of wine. These consumers are interested in specific wine varietals and drawn to eye-catching label art and a strong brand story.
Higher quality boxed/canned wines are changing consumers' negative perceptions of this wine packaging. Two of the major boxed wine brands posted double-digit growth in 2017, according to the Wine Handbook.
Red wine blends have also increased in popularity. Consumers no longer look at the term "blend" as a negative but rather a sign that a wine is fine-tuned and flavorful.
Sales Increase for Plant-Based Food
New data released today by The Good Food Institute (GFI) shows that U.S. retail sales of plant-based food sales grew an impressive 17 percent in the past 12 months, with total sales now topping $3.7 billion. Comparatively, total U.S. retail food sales grew just 2 percent during the same time period.
Plant-based meat sales alone have increased 23 percent in the past year, with the U.S. retail market now worth $684 million. The top five plant-based meat brands by total sales are Morningstar Farms, Gardein, Lightlife, Beyond Meat, and Boca. The fastest growing plant-based meat brand is Beyond Meat with sales up 70 percent, followed by Field Roast (+68 percent), Gardein (+51 percent), Dr. Praeger’s (+44 percent), and Quorn (+31 percent).
The data reveals a nationwide shift, with sales of plant-based meat growing double-digits across all nine U.S. census regions, particularly in the country’s center. Refrigerated plant-based meat sales are growing fastest in the Mountain region, while frozen plant-based meat sales are growing fastest in the West South Central region, which includes Texas.
“As consumers look to decrease their meat consumption, more and more people are choosing plant-based meats,” notes Alison Rabschnuk, GFI’s Director of Corporate Engagement. “In fact, 12 percent of households across the U.S. now purchase plant-based meat. That’s an estimated 14.7 million households, which is a significant increase from last year, and I expect we’ll see that trend continue.”
Plant-based milk is now sold in 89 percent of all retail outlets and commands 13 percent of total retail milk sales nationally. Following in the footsteps of the now nearly ubiquitous plant-based milk category, the fastest growing plant-based products are “other dairy alternatives,” including creamers with sales up 62 percent followed by yogurt (+54 percent), cheese (+41 percent), and ice-cream (+40 percent).
“The plant-based meat category today is reminiscent of the plant-based milk category about 10 years ago, when growth began to really take off,” observes Caroline Bushnell, Senior Marketing Manager at GFI. ”As it follows that trajectory, reaching share of market parity with plant-based milk would make the retail plant-based meat category worth almost $10 billion.
The custom data set represents retail sales of plant-based foods that directly replace animal products, including meat, seafood, eggs, and dairy, as well as meals that contain direct animal ingredient replacements. Milk is defined as ready-to-drink liquid milk products, and excludes condensed, evaporated, and canned milk products. This data was obtained over the 52-week period ending August 11, 2018 from Nielsen’s Expanded All Outlets Combined Channel channel – which includes grocery stores, drug stores, mass merchandisers, club stores, dollar stores, and military stores – plus Whole Foods Market.
What's Next in Mexican Cuisine
In honor of National Hispanic Heritage Month, Cacique, Inc. partnered with a panel of the world's top culinary talent to release predictions for What's Next in Mexican Cuisine. As an authority in Mexican food, Cacique curated a group of the world's top Mexican and Mexican-American chefs to share their takes on what will impact the culinary world in the coming year and develop custom trend-forward recipes that can be recreated by anyone at home.
Led by Cacique's long-term partner, award-winning chef and TV personality Aarón Sánchez, the panel consists of Chef Bricia Lopez of Guelaguetza in Los Angeles, Chef Richard Ampudia of La Esquina in New York City, Chef Santiago Gomez of Cantina La Veinte and Tacology in Miami, and Chef Wes Avilaof Guerrilla Tacos in Los Angeles. With Mexican eateries spanning the United States – from casual taquerias to fine-dining restaurants – the trend forecasters offer a carefully curated range of expert perspectives.
The top trends for Mexican food in 2019 include:
- A localized understanding and appreciation of Mexican cuisine will become even more prevalent, from single-origin ingredients like poblanos from Puebla to regional dishes like Chihuahua-style Pozole
- Open-fire cooking will rise to the top as a preparation style, with smoky flavors reigning supreme
- Asian and European techniques and presentation will be more frequently applied to traditional Mexican ingredients and dishes
- From vegan makeovers to Keto Diet-friendly versions, mainstream dieting food trends will influence lighter spins on Mexican classics
- Baja California will heat up as a culinary destination and region of Mexico that will influence the overall U.S. food scene
- Los Angeles and Chicago will continue to grow as hotspots for Mexican food in the United States
- The misconception that Mexican food is cheap street food will be replaced with a greater appreciation for the diverse, sophisticated cuisine that it actually is
- Aguachile and ceviche – fresh raw seafood dishes cured in citrus juices – will stand out as trending dishes
The Choice is Cork
A recent study published in the International Journal of Hospitality Management found that wine drinkers in a blind taste test rated the same wine 10 – 13 points higher for appearance, taste, aroma, and overall quality, when they were led to believe by visual cues that the wine was closed with a natural cork as opposed to a screw cap or a synthetic cork. The 310 participants did not know they were actually tasting the exact same wine. The aim of the study was to investigate the association between wine bottle closure type and consumer perceptions of intrinsic wine attributes.
"This research project proved statistically true as participants rated wines that they were told came from bottles with natural cork as superior when in reality both wines used in the experiment were dispensed from wine kegs," says Dr. Dennis Reynolds, Dean of the University of Houston Conrad N. Hilton College of Hotel and Restaurant Management and author of the study.
The study concluded that restaurants, bars, wineries, and cellars can “better please customers” by serving wines with natural corks instead of screw caps or synthetic corks closures because “closure type can influence perceptions of taste, bouquet, appearance, and overall quality.” Moreover, the researchers suggest that wine manufacturers should “resist shifting to alternatives to natural corks.”
“It’s no coincidence that 70 percent of all wine stoppers are made of cork, including the overwhelming majority of the world's best wines,” says João Rui Ferreira, President of The Portuguese Cork Association (APCOR). “The study’s findings are in line with what we’ve been seeing for many years. This natural, sustainable, and recyclable product is not just superior in terms of its environmental aspects and its ability to preserve wine and aid in its development, but superior in terms of consumer perception as well.”
Participants were given a written survey which asked questions related to experience with wine, consumption habits and wine preferences. The tasting included two wines that were disguised as four wines. The wines used in the study were Bordeaux blends.
The survey results mirrored the results of a blind taste test conducted in 2017 by Oxford University Professor of Experimental Psychology Dr. Charles Spence, in which participants rated the same wine after hearing the sound of a bottle being opened – either the twist of a screw cap or the pop of a cork. In that study, the perception that the wine was closed with a cork led participants to rate the wine 8 percent to 15 percent higher. While the Oxford study was funded by the Portuguese Cork Association, the current study was independent of any connection to the cork industry.
This 2018 study was co-authored by Dennis Reynolds of the Conrad N. Hilton College of Hotel and Restaurant Management, University of Houston, USA, Imran Rahman and Shaniel Bernard of the Department of Nutrition, Dietetics, and Hospitality Management at Auburn University, USA, and Amy Holbrook of The Boeing Company, USA.
Baking Ingredients Market
The global Baking Ingredients Market size is expected to value at USD 19.4 billion by 2025. The market is subject to witness a substantial growth due to the varying food preferences and increasing consummation of packaged and processed food. Additionally, factors such as growing need for longer shelf life of food product, and rising need for organic ingredients in the final baked product is anticipated to boost the market growth over the forecast period. Baking ingredients are considered as a vital part of baking industry. Globally, the baking ingredients market is predicted to grow at a CAGR of 5.8 percent in forecast period, providing numerous opportunities for market players to invest in research and development in the market.
Baking ingredients like enzymes, additives, softening agents, and baking powders are increasingly utilized for the processing of baked goods similar to bread, patties, muffins, rolls, tartlets, and tarts. Growing demand for superior quality bakery products with the enhanced flavor, texture, taste and odor are estimated to complement the growth of the market in upcoming years. Additionally, increasing contribution from end-user sector involving bread, cookies, biscuits, muffins, rolls, tartlets and tarts are further expanding market reach of the baking ingredients industry.
The rise in end user's inclination towards bakery products and increasing concern among general population for healthy dietary supplements is anticipated to drive the market demand during the forecast period. Recent developments in baking ingredients industry and introduction of innovative products are spurring the demand for bakery products in both developed and developing economies across the globe in near future.
However, inflation, health consciousness among young population, and stringent laws & regulation regarding excessive use of artificial flavors are negatively affecting market growth, in the recent years. Yet, rapid urbanization and increasing per capita income in developing economies across the globe are leading to the rise in consumption of baked food.
Rise in production and large consumer base in developing countries is expected to propel the overall market growth. On-the-go food lifestyle and need for convenience food in developed economies is boosting the demand over the forecast period. Varying food patterns and rise in personal expenditure majorly in the developing economies are some of the key factors responsible for boosting the growth of the baking ingredients market in coming years.
Bread is considered as one of the fastest growing segment in the market with substantial revenue generation in the last couple of years. Growing consummation of bread is credited to high nutritional content and affordability to the price sensitive customers in the developing economies. Baking ingredients in the cakes & pastries segment has also witnessed significant growth owing to the increased consumption of snack items and availability of freezers in retail stores.
In addition, numerous initiatives and growing advertisement by industry players to include the bakery ingredients in the packaged food products and other applications are substantially contributing to the advancement of baking ingredients industry over the forecast period. Furthermore, major emphasis on the consummation of food products with high nutritional value by consumers in developed economies are propelling the growth of yeast ingredients market during the forecast period.
The market is divided by region as North America, Europe, Asia-Pacific, Latin America and Africa. European region has shown major growth in recent years owing to the changing food habits, increasing demand for demand for packaged and processed food, and existence of prominent industry players in the region.
Asia-Pacific region is predicted to hold major market share in the baking ingredients market with massive growth in forecast period. Countries such as India, China and Japan are leading the Asia-Pacific market with shifting preference towards western style food, rise in per capita income and significant investment by leading industry players considering potential growth opportunities in the region.
The Obstacle of Cheap Junk Food
The globalized food system is not delivering the diets that people need for a healthy life, but instead contributes to obesity and overweight especially in countries that are importing most of their food, FAO Director-General, José Graziano da Silva said today.
"Unfortunately, commodities and industrialized cheap food are much easier for international trade," Graziano da Silva said, addressing participants of a technical workshop on food safety and healthy diets organized by the Vatican's Pontifical Academy of Sciences.
The problem is rife in the small island developing states in the Pacific, which have to import most of their food, with obesity rates ranging from more than 30 percent in Fiji to 80 percent among women in American Samoa. In at least 10 Pacific Island countries, more than 50 percent (and in some up to 90 percent) of the population is overweight. The overconsumption of imported industrialized food high in salt, sodium, sugar and trans fats is the major driver behind this situation.
Estimates indicate that today 2.6 billion are overweight and that the prevalence of obesity in the global population has increased from 11.7 percent in 2012 to 13.2 percent in 2016.
"If we do not adopt urgent actions to halt the increasing obesity rates, we soon may have more obese people than undernourished people in the world," Graziano da Silva said. "There are several underlying factors driving the global pandemic of obesity. Unhealthy diets are the most significant one."
He pointed to the increased availability and accessibility of food types that are very energy-dense, high in fat, sugar and salt, whose sales have been spurred on by intense marketing and advertising.
"Fast and junk food is the best example of that. This kind of food is cheaper, and easier to access and prepare than fresh food, particularly for poor people in urban areas," Graziano said, noting that when resources for food become scarce, people choose less expensive foods that are often high in caloric density and low in nutrients.
The consumption of these cheap foods comes however, at a high cost to society with obesity a risk factor for many non-communicable diseases such as heart disease, stroke, diabetes and some cancers.
Public action, consumer behavior
"Countries should have in place laws that protect healthy and local diets, and encourage the private sector to produce healthier food," Graziano da Silva said. These could include taxes on unhealthy food products; clear and informative labelling of products; restrictions of advertising for junk food to children; and, a reduction in the levels of salt and sugar used to produce food, or even banning the use of some ingredients such as trans fats.
Governments should also encourage food diversification, and facilitate market access for local products from family farming, for example, school feeding programmes that link local production to school meals, thus boosting the local economy while promoting healthy diets for children.
The FAO Director-General also said trade agreements must be designed in ways that make local nutritious food cheaper to produce, while restricting the influx of imported cheap food that are high in fat, sugar and salt.
He also stressed the importance of education, including school curricula that teach children about healthy cooking and healthy food choices, and greater access to information for consumers to promote awareness and healthier dietary choices.
Meat Substitutes Market
The global meat substitutes market size is expected to reach USD 5.81 billion by 2022, according to a new report by Grand View Research, Inc. The market is expected to witness a healthy CAGR of 7.5 percent during the forecast period. Growing preference for vegan diet coupled with rising health awareness is expected to fuel market demand in the near future.
Soy-based meat substitutes led the global market in the past. Wheat-based raw materials are expected to register the highest CAGR from 2015 to 2022, followed by mycoprotein and soy-based meat substitutes. Textured Vegetable Protein (TVP) is the most popular meat substitute, which led the market. However, wheat-based meat substitutes, such as seitan, are expected to experience the maximum CAGR through 2022.
Among the multiple applications, seitan is presumed to witness the fastest growth over the forecast period. The Asia Pacific and Central & South America regions are slated to see strong demand over the next seven years. Europe has been the dominant market for meat substitutes and is presumed to maintain the trend over the forecast years.
On the other hand, regulations and directives related to meat substitute composition and specifications are anticipated to impact the market growth to some extent. Variations and complexities in the regional rules are presumed to have a negative impact on the global, as well as regional markets. However, regulations issued by agencies, such as FDA and FSIS, are anticipated to play a vital role in shaping the global meat substitutes market over the forecast period.
Further Key Findings From the Report Suggest:
- Europe emerged as the largest market and generated revenue of USD 1.40 billion in 2014. It is anticipated to expand at a CAGR of 7.5 percent over the forecast period
- Wheat-based protein is forecast to reach USD 308.3 million by 2022 with a CAGR of 9.9 percent from 2015 to 2022
- Seitan is anticipated to emerge as the fastest-growing segment and is likely to register a CAGR of 10.2 percent over the forecast years
- Industry rivalry is bound to remain medium over the forecast period owing to a handful of market participants. Some of the market participants are Amy's Kitchen, Inc.; Beyond Meat; Vbites Foods Ltd.; Blue Chip Group; MorningStar Farms; Cauldron Foods; and MGP Ingredients, Inc.
Breakfast Trends
Breakfast in America is full of familiar comfort foods. Yet with each passing year our concept of comfort food becomes increasingly artisanal and international. Breakfast trends at both retail and foodservice are adapting to these evolving tastes, requiring food industry players to adjust to satisfy consumers, according to Packaged Facts in Bundle: Breakfast Trends and Opportunities, a new three report collection of market research studies on breakfast retail, foodservice, and culinary trends.
"Now more than ever, success as a marketer and manufacturer in the breakfast food industry requires understanding that breakfast trends at both retail and foodservice reflect a growing consumer state of mind that the most important meal of the day is one that can be experienced in a multitude of ways," says David Sprinkle, research director for Packaged Facts.
In the report Packaged Facts reveals that more than half of U.S. households agree that breakfast is more important than lunch or dinner. Consumers who believe in the superiority of breakfast above all other meal times are dubbed "breakfast believers" by Packaged Facts. The market research firm found that women, adults over age 65, African Americans, and Hispanics emerge as demographics with greater propensity to be breakfast believers.
Based on a variety of factors and trends, Hispanics are positioned to be among the most influential "breakfast believers". Accounting for more than 60 million in 2018, Hispanics represent almost 19 percent of the U.S. population and are expected to grow 9 percent through 2020. This growing presence combined with an impressive collective buying power requires marketers to leverage strategies in order to appeal to the respective traditional and cultural values of Hispanics and other multicultural consumers. Packaged Facts points to the growing popularity of breakfast bowls and breakfast hash as culinary trends that have gained prominence on restaurant menus in part because they are formats that welcome all kinds of global flavor influences, such as Asian and Hispanic ingredients.
"Race and ethnicity emerge as distinguishing characteristics in breakfast usage and habits. With an increasingly diverse population, it's prudent for breakfast marketers and restaurateurs to understand the importance of targeting households across the cultural spectrum," says Sprinkle.
Foodservice is arguably leading the charge in catering to consumer demand for globally inspired and authentic breakfast foods that extend beyond breakfast bowls. For example, there's the burgeoning Asian breakfast trend, where thrill-seeking chefs and customers look eastward in the morning to breakfast banh mi, congee (savory rice porridge), a.m. fried rice, bao, the crepe-like Chinese jianbing, and other Asian inspirations. And don't forget breakfast specialties with Hispanic sabor that have gone next-generation, including chilaquiles and migas, which target not just Hispanics, but all the ravenous Millennials looking for what's next.
Whether it's the slurp of a honey banana smoothie or the crackle of fresh bacon, breakfast is what gets many of us out of bed in the morning. A new survey conducted by the National Honey Board highlights how the U.S. does breakfast, just in time for both National Honey Month and Better Breakfast Month in September.
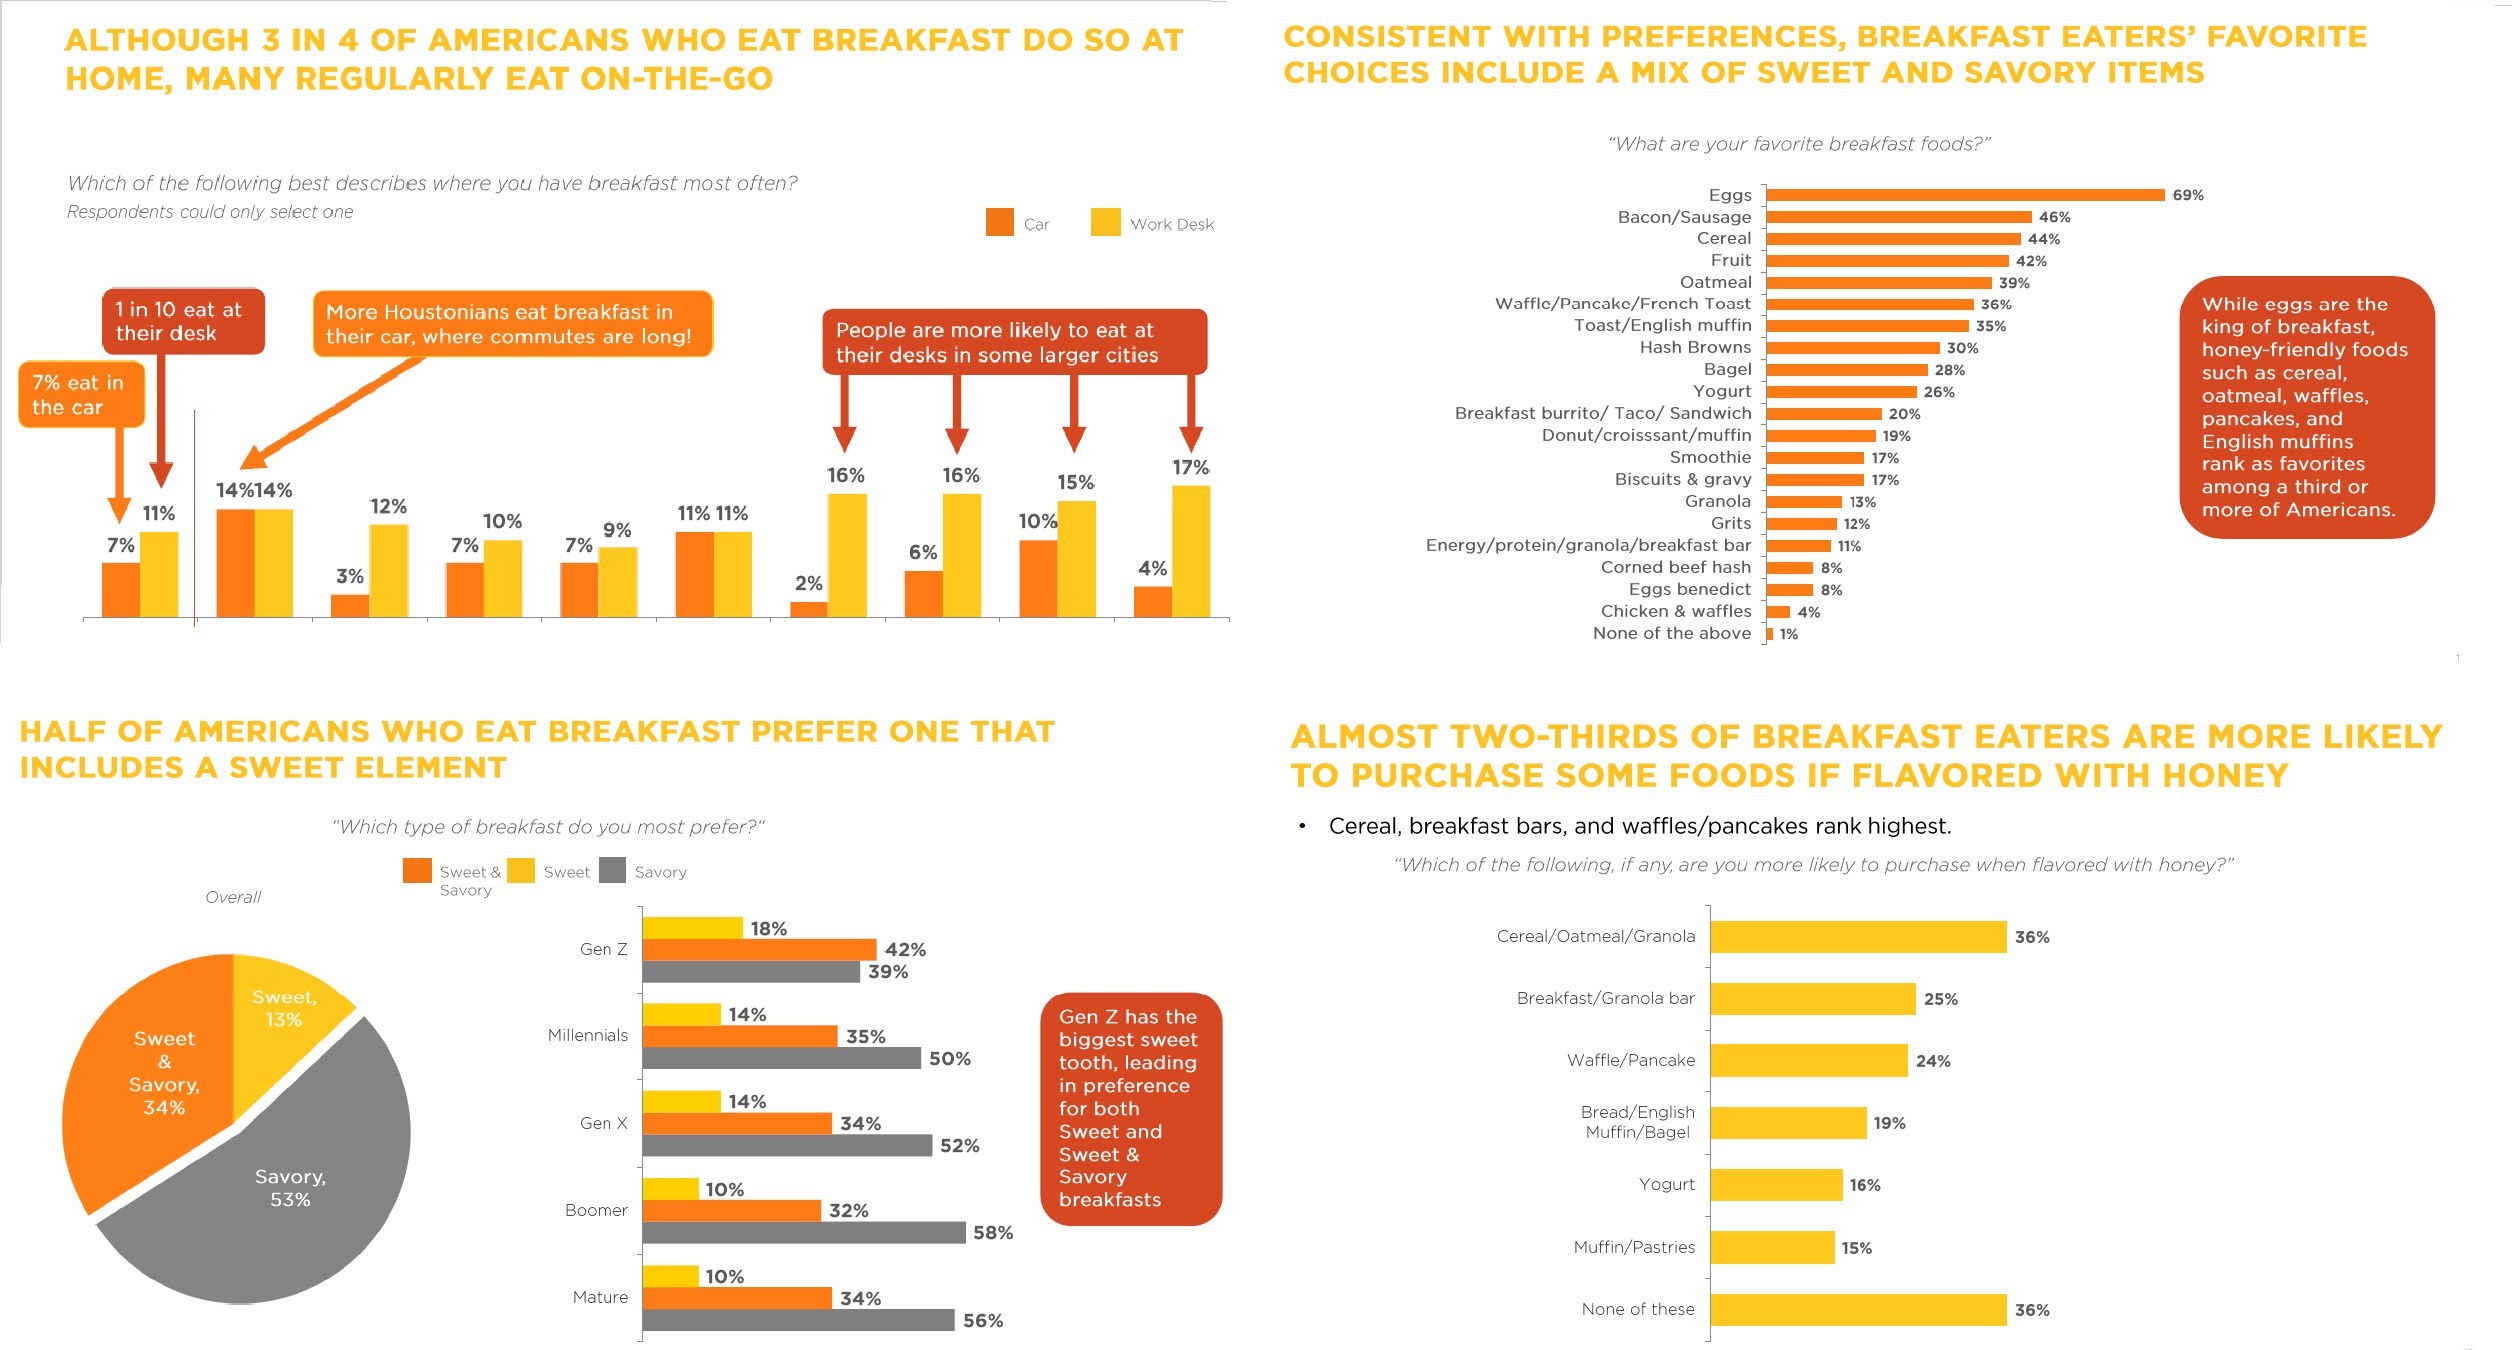
Of the 92 percent of Americans who enjoy breakfast at least once a week, 69 percent choose eggs as their favorite breakfast food while 46 percent of respondents choose either bacon or sausage. U.S. breakfast lovers are also enjoying their morning meal overwhelmingly at home, though 18 percent of respondents are munching either in the car or at their desk. Additionally, 36 percent of Americans are more likely to reach for oatmeal, granola or cereal as a breakfast option if flavored with honey. Though it isn't surprising that Americans prefer hearty breakfasts at home, there are a few interesting twists in the survey data:
- Americans in the Northeast are twice as likely to love bagels. According to survey data, those in Philadelphia, New York, and Boston are much more likely to indicate bagels as a breakfast favorite (39-43 percent) compared to Southern cities such as Atlanta, Houston, and Dallas (13-19 percent).
- Those that consider themselves environmentally-friendly are more inclined to favor toast and fruit for breakfast as well as hot tea with honey. According to the survey, 47 percent of environmentally-friendly individuals choose fruit, 40 percent choose toast, and 48 percent choose tea with honey.
- About half of Americans who eat breakfast prefer one that includes a sweet element. Gen Z is the most likely to enjoy a sweet breakfast, with 60 percent reaching for something with a sweet element versus 47 percent overall.
- The city most likely to grab for granola is Seattle. The survey shows that one in four Seattleites enjoy the crunchy breakfast treat, which was higher than any other city.
- One in three Americans who eat breakfast would be more likely to eat healthier foods when flavored with honey.
Gluten-Free Market
According to the new market research report "Gluten-free Products Market by Type (Bakery Products, Snacks & RTE Products, Pizzas & Pastas, Condiments & Dressings), Distribution Channel (Conventional Stores, Specialty Stores, Drugstores & Pharmacies), and Region – Global Forecast to 2023", published by MarketsandMarkets™, the market is estimated to be valued at USD 4.48 billion in 2018 and is projected to reach USD 6.47 billion by 2023, at a CAGR of 7.6 percent. The market is driven by an increased diagnosis and awareness of celiac disease and other food allergies as well as health benefits associated with the adoption of special dietary lifestyles.
The Gluten-free Products Market, by type, is estimated to be dominated by the bakery products segment. This is mainly due to increasing preference for the bakery products, which are staple foods in North America and Europe; countries in these regions are also known to have the highest number of gluten-intolerant population in the world. However, the awareness among the general population in these regions of celiac disease and health benefits associated with the consumption of gluten-free products is high, which has translated into increasing demand for gluten-free bakery products.
Of the various distribution channels, the conventional stores segment is projected to witness the fastest growth during the forecast period. The conventional stores segment includes various subsegments such as grocery stores, mass merchandisers, warehouse clubs, and online retailers. Conventional stores are an economical alternative and have become a popular choice for consumers who prefer gluten-free products.
The European market is projected to grow at the highest CAGR from 2018 to 2023. Increasing incidences of celiac diseases and gluten sensitivities have led to high demand for gluten-free products in the region. Additionally, a majority of the region's populace has also been adopting gluten-free diets owing to the various health benefits associated with them, despite not being gluten-intolerant. Growing preference for gluten-free diets has widened market opportunities for numerous global gluten-free product brands to enter the region and many local patisseries, bakeries, and confectioneries brands to be able to tap into this consumer space.
Market for Seaweed
The global commercial seaweed market size is anticipated to reach USD 22.13 billion by 2024, according to a new report by Grand View Research, Inc. The global market is estimated to witness a healthy CAGR of 8.9 percent during the forecast period. Rising demand for seaweed-derived food products is estimated to boost the industry growth over the next few years. Growing product application scope in fertilizers, animal feed, and healthcare and medical sectors is also boosting the market demand. Furthermore, growing popularity of seaweed extracts such as agar, carrageenan, and alginate is also likely to drive the commercial seaweed market.
Increasing product application scope in the pharmaceutical sector is projected to boost the market growth. Various properties of commercial seaweeds such as thickening and gelling, which are applicable in hydrocolloid industries, is expected to drive the market further. Regulations regarding the production and harvesting of seaweeds concerning human consumption, animal feed, and agricultural use is expected to augment the market. Seaweeds serve as a major food product in Asia Pacific region. Increased consumption of organic foods is expected to fuel the product demand in the coming years.
Further Key Findings From the Report Suggest:
- The global commercial seaweed market is projected to witness strong demand over the coming years owing to rising awareness regarding the benefits of seaweeds
- Majority of the commercial seaweeds are consumed in liquid form due to ease of application and growing industrial demand
- Red seaweed emerged as the fastest-growing product segment in 2015 and accounted for more than 52 percent of the global market
- Human consumption emerged as the largest application segment in 2015 accounting for more than 80 percent of the overall share
- Rising awareness regarding healthier eating habits and lifestyle along with increased disposable income are the key growth-driving factors
- Some of the prominent companies operating in this industry include E.I. DuPont Nemours and Company; Cargill, Inc.; Roullier Group; Compo GmbH & Co.; and Biostadt India Ltd.
Pea Protein Forecast
Global Pea Protein Market is expected to reach USD 313.5 billion by 2025. Peas are the seeds from pod fruit pisum sativum, rich in protein that plays important role in animal feed and human food. It has a great amino acid profile. It is obtained by refining proteins in yellow peas. It helps to reduce cholesterol, increase muscle, lower blood pressure, and improve satiety. Moreover, 55-65 percent pea proteins are globulins and 18-25 percent albumins and the pea plant improves soil fertility.
About 22-23 percent, proteins are found in pea seeds. Main pea storing proteins, convicilin, legumin, and vicilin are globulins and represent 65-85 percent of total proteins. The Pea Protein Market is estimated to grow at a significant CAGR of 17.4 percent over the forecast period as the scope and its applications are rising enormously across the globe.
Changing lifestyle by accepting healthier lifestyle, rising anxiety towards lactose intolerance, expansion of nutraceutical industries, and high demand for gluten free products are documented as major factors of Pea Protein industry that are estimated to enhance the growth in the years to come. However, lack of awareness among populace regarding pea protein may restrain overall market growth in the coming years. Pea Protein Market is segmented based on type, form, application, and region.
Textured, isolates, concentrates, and other types could be explored in Pea Protein industry in the forecast period. Isolates sector estimated to lead the overall market with substantial market share in the coming years. This may be because of its use as texturizing agents in meat goods as it has good water-binding characteristics, high amino acid content, high solubility, and extraordinary emulsification.
The two main forms of Pea Protein are wet textured and dry textured that could be explored in the forecast period. Dry textured pea protein sector accounted for the substantial market share of Pea Protein and is estimated to lead the overall market in the coming years. This may be because of rising use in bakery products, nutritional health supplements, and meat. In addition, liquid textured sector is estimated to grow at fastest pace in the years to come.
The market may be categorized based on applications like snacks & bakery products, beverages, dietary supplements, meat extenders & analogs, and others like confectionery & meat enhancers could be explored in the forecast period. Dietary supplements sector accounted for the substantial market share of Pea Protein in terms of volume and is estimated to continue its dominance in the coming years.
This may be because of expansion of nutraceutical industry in developing countries, growing awareness among populace regarding nutritious and healthy diet, and rising domestic consumption of nutritional supplements. Also, bakery sector is estimated to grow at fastest pace in the coming years.
Globally, North America accounted for the substantial market share of Pea Protein in terms of volume and value and is estimated to lead the overall market in the coming years. The reason behind the overall market growth could be high demand for gluten free products in the United States, increasing concern regarding cardiovascular diseases, and growing sports nutrition industry.
Instead, Europe and the Asia Pacific are also estimated to have a positive influence on the future growth. Europe is the second largest region with significant market share. However, Asia Pacific is estimated to grow at fastest pace with the highest CAGR in the foremost period. The aspects that may be ascribed to the growth comprise rising awareness among food & beverage producers and high demand in developing countries like India and China as pea protein have high nutritional value.
The key players of Pea Protein Market are Sotexpro, A&B Ingredients, Nutri-Pea Ltd., Farbest Brands, Axiom Foods Inc., Roquette Freres, and The Scoular Company. These players are concentrating on inorganic growth to sustain themselves amongst fierce competition. As companies all over the world have to believe that alliance with a market would permit them proportional market existence and authority to declare the leadership position.
How the Combination of 5G, AI and IoT Is Set to Change the Americas
At the 2018 Mobile World Congress Americas, the GSMA issued a new report, ‘Intelligent Connectivity: How the Combination of 5G, AI and IoT Is Set to Change the Americas,’ highlighting how the region is set to benefit from the age of ‘intelligent connectivity’ or the fusion of high-speed 5G networks, artificial intelligence (AI) and the Internet of Things (IoT). The in-depth report, which draws on interviews with senior representatives from mobile operators including AT&T, Rogers and Sprint, outlines the key sectors that will benefit most from intelligent connectivity, including entertainment, transportation and manufacturing.
GSMA Intelligence forecasts that the number of 5G connections globally will reach 1.3 billion by 2025, covering 40 percent of the world’s population or approximately 2.7 billion people. At that time, the Americas region is expected to account for over 260 million 5G connections or 20 percent of the global market.
“Intelligent connectivity will have a significant and positive impact on individuals, industry and society, marking the beginning of a new era defined by highly contextualised and personalised experiences,” commented Mats Granryd, Director General, GSMA. “Augmented and virtual reality will change the way we watch live sports and music concerts, drones will deliver packages to our homes, while virtual personal assistants will manage our lives for us. New 5G networks, AI and the upscaling of the Internet of Things will change the world, intelligently connecting everyone and everything to a better future.”
Intelligent Transportation
The new report highlights how intelligent connectivity will impact the future of transportation, enabling safer and smoother travel. It outlines how 5G networks and AI systems will communicate the location of vehicles, bicycles and people in real time, reducing the chance of accidents or collisions. Data on the weather, surface conditions, road works or congestion can be relayed in real time from a cyclist’s helmet and, when combined with AI, could help road users plot better routes. 5G enabled systems will also enhance driving by monitoring the behaviour of adjacent vehicles and responding accordingly, such as applying the brakes, as well as automatically calling for assistance in the event of accidents. 5G will also usher in an era of reliable self-driving vehicles, such as autonomous trucks that travel in convoys or platoons and taxis to take you safely home.
“IoT is helping to pave the way towards 5G, with deployments of Low-Power Wide-Area networks on the road to massive IoT. Advances with 5G critical communications and enhanced mobile broadband will bring increasing opportunity in the IoT, including connected cars, smart homes and cities, connected health and more. Intelligent connectivity technology will transform the way we live and work every day,” says Susan A. Johnson, executive vice president, Global Connections & Supply Chain, AT&T.
Seamless Entertainment
5G promises to fundamentally change the way we consume entertainment, delivering 4K and 8K ultra-high-definition video, 3D video, holograms, augmented reality (AR) and virtual reality (VR) applications for gaming and immersive TV, as well as digital services and content for connected stadia. Music or live sports events could be broadcast from an athlete’s or artist’s point of view with spectators able to access multiple camera angles or replays on different screens or see overlayed information on VR headsets – all from the comfort of their home. Video games will become more immersive and realistic through virtual reality and HD graphics and access to super-fast internet speeds will allow gamers to play in any location without the cost or inconvenience of carrying specialised hardware. AI gaming platforms will also tailor games by making them more engaging and player relevant.
“Over the next few years, there’s going to be a huge increase in mobile data traffic, an explosion of devices connected to mobile networks, along with even more demand from consumers and businesses for wireless connectivity and better performance,” said Kevin Crull, Chief Strategy Officer at Sprint. “The investment made by the U.S. telecom industry in delivering the world’s best 5G networks is going to be key in helping to drive innovation, entrepreneurship, and future economic growth and is why we must work rapidly to support the growing demand.”
Drone Delivery
The report highlights how 5G networks will enable UAVs (Unmanned Aerial Vehicles) or drones to provide fast, low-cost, secure delivery straight to customers’ homes. The network will help to coordinate large fleets so that they fly safely, automatically avoiding collisions with buildings and other drones as well as provide secure connections, authentication and smart autonomous navigation with high-definition video backup and recovery location in case of emergencies.
The Role of the Operator in the Americas
Mobile operators across the Americas are already making great strides in the rollout and delivery of 5G networks. The US is set to be one of the first countries in the world to launch 5G commercial services. with all four US national mobile operators having announced their first deployment plans. Mobile 5G services are expected to launch later this year by AT&T and Verizon, with AT&T targeting twelve markets and Verizon four. Sprint plans to launch its mobile 5G service in the first half of 2019, with nine markets announced already.
Download the report at www.gsma.com/IC/report/.
The Appeal of Digital Marketing
Almost half of businesses invest at least $500,000 in digital marketing every year, according to a new survey from The Manifest, a business news and how-to website. Forty-one percent (41 percent) of businesses spend at least $500,000 on digital marketing annually, and 81 percent spend at least $50,000. Investment in digital marketing is likely to increase every year, experts say.
“There’s been a significant uptick in digital marketing spend because it’s where consumers are,” said Flynn Zaiger, CEO of Online Optimism, a digital marketing agency in New Orleans. “If you’re trying to be in front of your customers, the screen is the place to be.”
Almost every business plans to invest more time and money in digital marketing. Among businesses that use digital marketing, nearly all (99 percent) plan to increase their investment in at least one channel in the next year. Businesses place considerable value in digital marketing and want to invest more in it because customers spend much of their time online.
“Everyone is online, all the time, and digital marketing is crucial in reaching this huge audience where they are,” said Aylin Cook, head of content marketing at digital marketing agency Single Grain.
Most businesses plan to increase their investment in a combination of digital marketing channels, with social media (64 percent) and websites (55 percent) topping the list. Experts say both channels are easy investments for businesses and deliver clear returns.
“[Social media marketing and websites are] the strategies that business owners are most comfortable with,” Zaiger said. “If you’re trying to make a decision that will at least guarantee some sort of results, chucking money at social media or your web designer will make something happen.”
Businesses want to invest more in social media and a website because they are easy investments with measurable results. Among businesses that rely solely on in-house staff and software for digital marketing, nearly one-third (32 percent) plan to outsource their digital marketing within the next year. Outsourcing digital marketing can help a business receive essential external perspective, experts say.
“[Companies] should be getting an outside perspective because sometimes extra minds can be a really big bolt to someone’s system,” Zaiger said.
Overall, the survey indicates that businesses across all industries value digital marketing and will continue to spend more on it every year.
The Manifest’s 2018 Digital Marketing Survey included 501 digital marketers from U.S. companies with more than 100 employees. Read the full report here.
French Fries are Top Veggie
More than a quarter (27 percent) of young children do not consume a single discrete serving of vegetables on a given day, according to the latest findings from the landmark Feeding Infants and Toddlers Study (FITS). Among the toddlers who do, French Fries are the No. 1 vegetable consumed, show the FITS findings, which have just been published in a series of eight papers in the Journal of Nutrition, a publication of the American Society for Nutrition.
According to FITS, food choices tend to change and more nutrient gaps appear after a child's first birthday, when most begin eating more family foods. By age two, many children have established taste preferences and eating habits that will last a lifetime, which is why pediatricians and public health experts urge parents to help their children set healthy eating behaviors early.
"Good nutrition during a child's early years is particularly critical because it sets the stage for healthy eating throughout life," said Wendy Johnson, Ph.D., M.P.H., R.D., Vice President, Nutrition, Health and Wellness for Nestlé USA. "Exposing young children to a rainbow of fruits and vegetables, and a variety of foods and flavors, is important as children are forming their tastes and eating habits for life."
FITS is the largest dietary intake study in the United States focused on infants, toddlers and preschoolers. Nearly 10,000 parents and caregivers of children under age four have been surveyed over three FITS studies, which Gerber began in 2002. FITS is now conducted by Nestlé Research in Lausanne, Switzerland with a team of leading independent pediatric experts and nutrition scientists from academic, medical, government and research institutions. As part of the company's Nestlé for Healthier Kids initiative to help 50 million children lead healthier lives by 2030, FITS helps to build, share and apply nutritional knowledge.
"The latest FITS data confirm that more work is needed to improve the diets of young children, and gives us insight into areas we must focus on to foster healthy eating habits," said Johnson.
Other new FITS findings reveal that troubling nutrient shortfalls start early and many young children consume sweets and excess sodium:
- Iron: The percentage of infants between 6 and 12 months old who do not consume the recommended amount of iron has increased from 7.5 percent in 2002 to 18 percent in 2016. Iron is a critical nutrient to support learning ability and brain development. Beef and iron-fortified cereal are excellent sources of iron.
- Vitamin D: Fewer than 25 percent of infants get the recommended amount of vitamin D, which the body needs for strong bones and teeth. The American Academy of Pediatrics recommends a daily vitamin D supplement for infants who are exclusively breastfed or receive less than a liter of infant formula per day. Similarly, about 80 percent of 1- to 3-year-olds fall short on vitamin D. Milk and yogurt are good food sources of vitamin D.
- Fiber: Fewer than 10 percent of children 12 to 48 months old get adequate amounts of dietary fiber. Fiber is found in whole grains, fruits, vegetables, lentils and beans.
- Sodium: Forty percent of 1-year-olds and 70-75 percent of 2- to 3-year-olds exceed the upper limit for sodium. Processed meats like hot dogs, lunch meat, sausage and bacon are leading sources of sodium among young children. These foods also contribute saturated fat to their diets.
- Sugar-sweetened beverages: About 10 percent of infants 6-12 months, 30 percent of 1-year-olds and 45 percent of 2- to 3-year-olds drink sugar-sweetened beverages on a given day, with fruit flavored drinks being the most common.
Help kids eat more veggies and fruit
Parents should keep in mind that it might take several tries – in fact up to 10 or more – for kids to accept a new food. Keep offering veggies and fruit, and try these ideas.
Offer a rainbow of veggies
- For infants: include pureed or mashed peas, sweet potatoes, carrots, butternut squash, and green beans.
- For toddlers and preschoolers: consider mashed or small, soft cooked dices of sweet potatoes, peas, green beans, carrots, red peppers or zucchini.
- At mealtime, finger foods including red/green pepper slices, cooked broccoli pieces and cucumber slices can spark some kid-friendly creativity.
- Need some new side dishes they'll love? Bake "fries" from a variety of vegetables including zucchini, eggplant, carrots and butternut squash.
- Try double dipping at snack time – dip small bite sized veggies in veggies – like mild salsas, or try a bean dip, guacamole or hummus.
Increase children's fruit consumption to get important nutrients they need
- Offer fruit at meals and snack time, including fresh, frozen, jarred and canned versions.
- Try mixing fruit into your child's yogurt or whole grain cereal.
- Get creative with a fruit smoothie for a refreshing treat on a hot day.
Enhancing food policy discussions with FITS data
The latest FITS findings are well-timed to inform food policy discussions, including the development of the Dietary Guidelines for Americans 2020-2025, which will include comprehensive dietary guidance for infants and toddlers (from birth to age 24 months) for the first time ever, as well as women who are pregnant. They will also help inform reconsideration of the benefits offered in the Special Supplemental Nutrition Program for Women, Infants and Children (WIC) food package, which was last revised in 2009.
"While academic organizations and the public health community have invested significantly in improving children's food choices amidst the obesity epidemic, the conversation needs to start earlier, with focused efforts on infants and toddlers through education and interventions with proven benefits," said Dr. Ryan Carvalho, M.D., Medical Director at Gerber. "Now is the time to halt the rise of childhood overweight and obesity by supporting healthy behaviors in our youngest children as their eating habits and food preferences are being formed."
Hunger on the Rise
New evidence continues to signal that the number of hungry people in the world is growing, reaching 821 million in 2017 or one in every nine people, according to The State of Food Security and Nutrition in the World 2018 released today. Limited progress is also being made in addressing the multiple forms of malnutrition, ranging from child stunting to adult obesity, putting the health of hundreds of millions of people at risk.
Hunger has been on the rise over the past three years, returning to levels from a decade ago. This reversal in progress sends a clear warning that more must be done and urgently if the Sustainable Development Goal of Zero Hunger is to be achieved by 2030.
The situation is worsening in South America and most regions of Africa, while the decreasing trend in undernourishment that characterized Asia seems to be slowing down significantly.
The annual UN report found that climate variability affecting rainfall patterns and agricultural seasons, and climate extremes such as droughts and floods, are among the key drivers behind the rise in hunger, together with conflict and economic slowdowns.
"The alarming signs of increasing food insecurity and high levels of different forms of malnutrition are a clear warning that there is considerable work to be done to make sure we ‘leave no one behind' on the road towards achieving the SDG goals on food security and improved nutrition," the heads of the UN Food and Agriculture Organization (FAO), the International Fund for Agricultural Development (IFAD), the UN Children's Fund (UNICEF), the World Food Programme (WFP) and the World Health Organization (WHO) warned in their joint foreword to the report.
"If we are to achieve a world without hunger and malnutrition in all its forms by 2030, it is imperative that we accelerate and scale up actions to strengthen the resilience and adaptive capacity of food systems and people's livelihoods in response to climate variability and extremes," the leaders said.
The impact of climate variability and extremes on hunger
Changes in climate are already undermining production of major crops such as wheat, rice and maize in tropical and temperate regions and, without building climate resilience, this is expected to worsen as temperatures increase and become more extreme.
Analysis in the report shows that the prevalence and number of undernourished people tend to be higher in countries highly exposed to climate extremes. Undernourishment is higher again when exposure to climate extremes is compounded by a high proportion of the population depending on agricultural systems that are highly sensitive to rainfall and temperature variability.
Temperature anomalies over agricultural cropping areas continued to be higher than the long-term mean throughout 2011-2016, leading to more frequent spells of extreme heat in the last five years. The nature of rainfall seasons is also changing, such as the late or early start of rainy seasons and the unequal distribution of rainfall within a season.
The harm to agricultural production contributes to shortfalls in food availability, with knock-on effects causing food price hikes and income losses that reduce people's access to food.
Slow progress on ending all forms of malnutrition
Poor progress has been made in reducing child stunting, the report says, with nearly 151 million children aged under five too short for their age due to malnutrition in 2017, compared to 165 million in 2012. Globally, Africa and Asia accounted for 39 percent and 55 percent of all stunted children, respectively.
Prevalence of child wasting remains extremely high in Asia where almost one in 10 children under five has low weight for their height, compared to just one in 100 in Latin America and the Caribbean.
The report describes as "shameful" the fact that one in three women of reproductive age globally is affected by anaemia, which has significant health and development consequences for both women and their children. No region has shown a decline in anaemia among women of reproductive age, and the prevalence in Africa and Asia is nearly three times higher than in North America.
Rates of exclusive breastfeeding in Africa and Asia are 1.5 times higher than those in North Americawhere only 26 percent of infants under six months receive breastmilk exclusively.
The other side of hunger: obesity on the rise
Adult obesity is worsening, and more than one in eight adults in the world is obese. The problem is most significant in North America, but Africa and Asia are also experiencing an upward trend, the report shows.
Undernutrition and obesity coexist in many countries, and can even be seen side by side in the same household. Poor access to nutritious food due to its higher cost, the stress of living with food insecurity, and physiological adaptations to food deprivation help explain why food-insecure families may have a higher risk of overweight and obesity.
Call for action
The report calls for implementing and scaling up interventions aimed at guaranteeing access to nutritious foods and breaking the intergenerational cycle of malnutrition. Policies must pay special attention to groups who are the most vulnerable to the harmful consequences of poor food access: infants, children aged under five, school-aged children, adolescent girls, and women.
At the same time, a sustainable shift must be made towards nutrition-sensitive agriculture and food systems that can provide safe and high-quality food for all.
The report also calls for greater efforts to build climate resilience through policies that promote climate change adaptation and mitigation, and disaster risk reduction.
Struggle to Provide Food
A new report released today by the United States Department of Agriculture (USDA) found that 1 in 8 households (11.8 percent) in the United States encountered difficulty at some time during 2017 in providing enough food for all their members. This represents a decline of 0.5 percentage points from the previous year's data. Still, the improvements are not enough to overcome the effects of the Great Recession as there are still more households experiencing hunger now than in 2007.
According to USDA, 40 million Americans face hunger, including 12.5 million children. Some of the groups experiencing the highest rates of food insecurity include households with children led by single women (30.3 percent) and people living below the poverty level (36.8 percent).
"We are pleased to see that food insecurity rates have decreased in recent years, but still 40 million Americans facing hunger is a statistic that no one should be comfortable with," said Matt Knott, president of Feeding America. "As policy makers debate legislation that could impact millions of households, we urge Congress to protect SNAP and increase TEFAP funding, programs that are critical to our work to address hunger, in the farm bill."
Additionally, the report looked at the variety of methods households employ to meet their food needs. For instance, more than half (58.4 percent) of food-insecure households below 185 percent of the federal poverty line reported participating in one or more of the three largest federal food and nutrition assistance programs (SNAP, NSLP, and WIC) in the previous 30 days.
The report, Household Food Security in the United States in 2017, is published by USDA's Economic Research Service and reports on data collected in December 2017. The report also presents statistics on how much households spent on food, and the extent to which food-insecure households participated in federal and community food assistance programs for 2017.
To see the full report, click here.