
According to a Recent Study/Survey … Mid-September 2016 Edition
19 Min Read By MRM Staff
As part of our mission to be the go-to resource for on-the-go restaurant industry professionals, Modern Restaurant Management magazine (MRM) offers highlights of recent research. This mid-September edition features news about sales declines, dining and dashing, craft coffee, grocerants and food safety, the popularity of apples, burrito love and why having a first job in the restaurant industry is a key to success in any career.
Dine and Dash
More than one in 10 of consumers admit to having left a restaurant, café or bar without paying, according to a survey about customer service in the hospitality sector conducted by QikServe, the mobile order and payment specialist. The survey also found that 90 percent had withheld a tip for a variety of reasons, with 12 percent reporting skipped out on paying a bill completely.
More than 50 percent of those who admitted to leaving without paying gave the reason as either waiting too long for the bill or being unable to find staff to take payment.
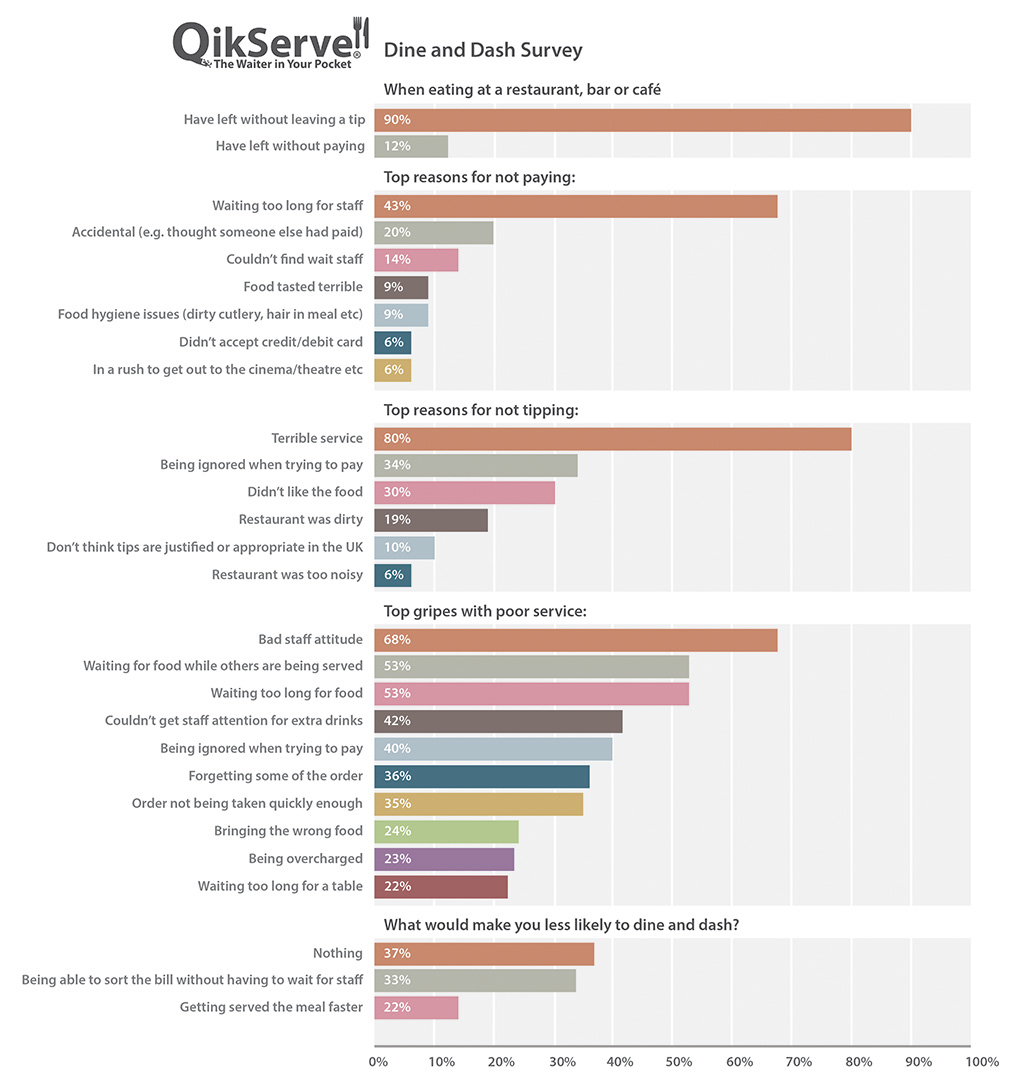
The main reason given for not tipping was “terrible” service, with 80 percent of respondents admitting to withholding a tip for this reason, although more than one in three also admitted to not tipping for “being ignored when trying to pay.”
The survey also explored the public’s main gripes with customer service in general. As expected, the primary cause for concern was “Bad staff attitude,” which resonated with 68 percent of respondents, but more than half of those surveyed also selected “Waiting too long for food” as a significant factor.
Other factors relating to waiting were also a key concern, with more than one in three respondents choosing “Couldn’t get staff attention,” “Being ignored when trying to pay” and “Not getting our order taken quickly enough” as leading poor service factors.
“We were surprised to learn that so many people admitted to skipping out on a bill, but we believe this higher than expected number is a sign of the times,” said Daniel Rodgers, Chief Executive Officer, QikServe. “We live in an age of instant gratification, driven in part by the ubiquity of mobile devices and apps, where consumers are becoming increasingly less tolerant towards waiting. This really brings home how important it is for hospitality operators to make sure that they don’t leave their customers hanging when it comes to payment. In fact, waiting was one of the most significant consumer concerns throughout the survey, whether waiting for food, service or the bill.”
Next-Gen Customer Experience
A new Deloitte study finds that 40 percent of frequent restaurant visitors prefer to order online, and spend 26 percent more per online order at quick service restaurants (QSRs) and 13 percent more in casual and fast casual establishments. The report uncovers the options that surveyed restaurant customers want most – such as online ordering, payment flexibility and customization – and how these increase dining frequency, check size, customer conversion and loyalty.
The restaurant menu is still the most important factor when choosing a restaurant for the first time.
“People have come to expect certain conveniences when they shop, travel and handle their finances – such as mobile access, personalization, loyalty tracking and no-touch transactions,” said Andrew Feinberg, principal, Deloitte Consulting LLP and U.S. consulting restaurants and food service leader. “More and more, they want their restaurant experiences to feel the same way. The true restaurants of the future will likely be the ones that engage people in a personalized way, even as interactions become more omni-channel.”
Restaurant Menu is Still King
The restaurant menu is still the most important factor when choosing a restaurant for the first time, and 85 percent of survey respondents said they will view the menu on the restaurant’s own website when making that decision. If a QSR location lets them use technology customers will come back 6 percent more often, and spend 20 percent more each time. Also, when they order, the most important element of the menu is the ability to customize the order.
More Ways to Pay
Payment flexibility – such as splitting checks – is common practice in a traditional restaurant experience, and more than half of diners surveyed expect the same payment flexibility with take-out (54 percent) and drive-thru (53 percent) orders. Many guests on-the-go also want the option to pay by phone: nearly half of drive-thru (48 percent) and takeout (46 percent) guests want to pay by phone, compared with 31 percent of dine-in customers. Among those who want to pay by phone, half (50 percent) prefer to use the restaurant’s app.
Connections that Count
While technology facilitates guest interactions, people still want to be recognized. In the survey, 70 percent of respondents said they look for apps that deliver personalized offers and convey the sense that a restaurant “knows them.” Additionally, 84 percent of respondents said that they will return if a restaurant responds directly to their feedback. And while many use their devices to collect and curate information on their own, 80 percent want to hear about discounts and special deals, with email (64 percent) as the most-preferred channel.
In 2016, Deloitte surveyed 3,000 Millennial and 1,500 general population high-frequency (two or more visits per week) guests who visited quick service restaurant, fast casual and casual dining locations. In a separate part of the same fact-finding process, Deloitte carried out over 20 interviews with restaurant industry executives to discuss their organizations’ current and desired levels of digital technology strategy, adoption and plans ahead.
Sales Downturn Continues
The downturn in restaurant sales continued during August as the industry faced its third consecutive month of negative same-store sales growth and the sixth month since the beginning of the year with declining year-over-year sales. Despite the -0.6 percent same-store sales growth posted during August, there was some good news in the fact that this result represented an improvement of 0.8 percentage points from the July result and is the second best month since April based on sales growth. This insight comes from data reported by TDn2K’s™ Black Box Intelligence™ through The Restaurant Industry Snapshot™, based on weekly sales from nearly 25,000 restaurant units, 130+ brands, representing $64 billion dollars in annual revenue.
Same-store traffic was -2.7 percent during August, a slight improvement from -3.9 percent in July. Furthermore, that increase in traffic growth is the biggest move recorded in consecutive months since February of this year. Average guest checks increased by 2.3 percent in August, a 0.5 percentage point decrease from July and the lowest year-over-year change recorded since March of this year.
“The data from August again shows the relationship between average guest checks, sales and traffic, which we’ve studied in recent quarters,” said Victor Fernandez, Executive Director of Insights and Knowledge for TDn2K. “Given the current environment, characterized by a continued decline in traffic, drops in average guest check growth have been associated with a boost in traffic, but the impact on incremental sales is usually underwhelming.”
During August, those industry segments that experienced a drop in their average guest check growth rate from July to August (Fast Casual, Family Dining and Casual Dining) all improved their traffic growth by more than 1.0 percentage points over their July results. Meanwhile, segments that experienced an increase in their average guest check growth from July to August posted an improvement in traffic growth of less than 1.0 percentage points over their July rate. The only exception was Fine Dining, which posted a robust improvement in traffic while slightly accelerating their growth in guest checks. However, the segments that saw the biggest improvements in their sales growth rates during the month were those that also experienced an acceleration in their average guest check growth.
Based on same-store sales, Quick Service was the best performing segment during August for the seventh consecutive month.
Based on same-store sales, Quick Service was the best performing segment during August for the seventh consecutive month. Upscale Casual and Family Dining were the only other segments that achieved positive (albeit very small) positive sales growth. Fine Dining, Fast Casual, and Casual Dining all experienced negative same-store sales growth during August.
From a regional perspective, California was again the best performing region of the country based on same-store sales growth. It has been the top performing region during five of the last six months. The Southwest has been the worst performing region during the last six consecutive months. The improvement in sales was also perceived at the local level, with 74 (or 38 percent) of the 195 DMAs tracked posting positive same-store sales during August. In comparison, only 46 of those DMAs reported positive sales growth during the previous two months.
While the industry encounters challenges to its topline results as sales slow down, the bottom line is also being challenged in the form of rising labor costs. According to TDn2K’s People Report™annual Corporate Compensation and Benefits Survey, labor costs for restaurant employees as a percentage of restaurant chain revenues increased from an average 29 percent in 2010 to 32 percent on average for 2016. Labor costs in these estimates include salaries, bonuses, benefits, and labor related taxes for restaurant hourly employees and managers.
Significant costs continue to be incurred through having to hire new employees to fill the vacancies from new jobs being created by the industry but mainly due to the rising turnover levels. The number of chain restaurant jobs grew by 1.8 percent year-over-year during July. Although a significant drop from the over 3.0 percent growth rates reported over the last year, the latest growth still represents a large number of people that have to be recruited, onboarded and trained. Furthermore, turnover continues rising and is a major concern for restaurant operators. Restaurant management turnover, which remains at levels higher than those tracked before the recession is especially troublesome, given its impact on hourly employee retention and its correlation to restaurant sales and traffic. With the latest results reported, restaurant hourly employee turnover has now increased for almost three consecutive years. As a result of the rising turnover rates and new jobs, the number of new hires during the second quarter of 2016 represented between 30 and 33 percent of total workforce for the median company operating in Quick Service, Fast Casual, Family Dining, and Casual Dining.
Flat Quarterly Results
Total foodservice industry traffic was flat in the first quarter and remains flat in the second quarter, reports The NPD Group. Quick service restaurant (QSR) visits, which make up 80 percent of total industry traffic, were also flat in the second quarter after being up one percent in the first quarter, according to NPD Group’s ongoing foodservice market research.
“Contributing to the stalled visit growth are consumers’ uncertainties about current and future economic conditions,” says Bonnie Riggs, NPD Group’s restaurant industry analyst. “These uncertainties have put a damper on overall consumer spending. Compounding the situation for the restaurant industry is the decline in food at home inflation while at the same time restaurant operators have been increasing menu prices.”
Even the fast casual QSR category, which experienced strong traffic growth for the last several years, saw visit growth slow in the last two quarters. Fast casual traffic was flat in the quarter ending June 2016 compared to same quarter year ago with a large share of the visit losses attributable to Chipotle and its food safety issues. With Chipotle taken out of the equation, fast casual visits were up 2 percent in the second quarter, which is considerably less than the 11 percent growth the category had in the same quarter last year. The ongoing visit losses in casual dining and midscale/family dining full service segments for the last several years continued in the second quarter.
Dinner represents 30 percent of daypart visits and declined by 1 percent, which is an improvement over the 3 percent decline in the first quarter of this year. Morning meal traffic, which represents 22 percent of daypart visits and has had a long run of traffic growth, increased by one percent.
“The good news in all of this is that consumers made 61.3 billion restaurant visits this past year,” says Riggs. “They are not giving up dining out at restaurants and other foodservice outlets. It’s true that in this flat market it’s a battle for visit share but there are restaurants that are winning. The winning operators focus on their customers’ needs and deliver on them.”
Foodservice Lunch Declines
Foodservice lunch, which accounts for a third of all foodservice traffic, has posted consecutively steeper declines over the past six months. Dinner represents 30 percent of daypart visits and declined by 1 percent, which is an improvement over the 3 percent decline in the first quarter of this year. Morning meal traffic, which represents 22 percent of daypart visits and has had a long run of traffic growth, increased by one percent.
In the quarter ending June 2016, lunch visits declined by four percent compared to same quarter year ago, the steepest decline of all main meal dayparts, according to NPD Group’s ongoing foodservice market research. The rise in employees working at home and more shopping online, which cuts down on foodservice meal and snack breaks, have been contributors to the softening of lunch traffic and recent menu price hikes have steepened lunch visit declines.
All restaurant segments, with the exception of traditional quick service restaurants (QSRs), are losing visits, finds NPD Group. This is particularly true of casual dining and fast casual (a quick service category) restaurants where traffic was down in the quarter ending June compared to same quarter last year by 6 percent and 9 percent respectively. Weekday foodservice lunch visits declined by 7 percent.
Foodservice lunch, especially weekday visits, has already been negatively impacted by a 24 percent increase over the last decade in the number of people working from home and an eight percent increase over the last year in online shopping. Relatively recent menu price hikes have only worsened the situation. A pricing analysis done by NPD Group finds that the price point at which consumers are most satisfied and most likely to visit is when they feel it is “affordable to eat there often,” and “good value for the money.” Average lunch eater checks in the quarter ending June 2016, which at some restaurant segments have increased by as much as five percent compared to the same quarter year ago, have moved upward beyond consumers’ “sweet spot” price, diminishing customer satisfaction and their intent to visit.
There has been aggressive dealing, like combo and value meal offerings at quick service hamburger restaurants, and the dealing has prevented steeper lunch visit declines; however, NPD Group’s foodservice market research shows that only about a fourth of lunch customers took advantage of the deals. With deal traffic removed from the lunch check, consumers are paying, on average, $8 dollars for lunch, which is higher than most want to pay for a quick service lunch.
“Simply said, who can afford to go out lunch on a regular basis when checks have risen for some as much as they have recently,” says Bonnie Riggs, NPD Group, restaurant industry analyst. “Historically, foodservice lunch has been the occasion where consumers didn’t want to invest a lot time, money, or energy into this meal. It’s apparent by the drop in lunch traffic that the current value proposition isn’t meeting these needs.”
Restaurant Jobs are Foundation Builders
One in three Americans gain their first work experience in a restaurant and three fourths of restaurant employees believe they have the opportunity for career advancement in the industry. The Who Works in the U.S. Restaurant Industry report by the National Restaurant Association Educational Foundation shows that first jobs in the restaurant sector help people learn and develop crucial skills and attributes necessary to be successful in the workforce – regardless of industry.
Some of these skills include:
- Dependability & reliability
- Teamwork
- Willingness & ability to learn
- Professionalism
- Motivation
- Initiative
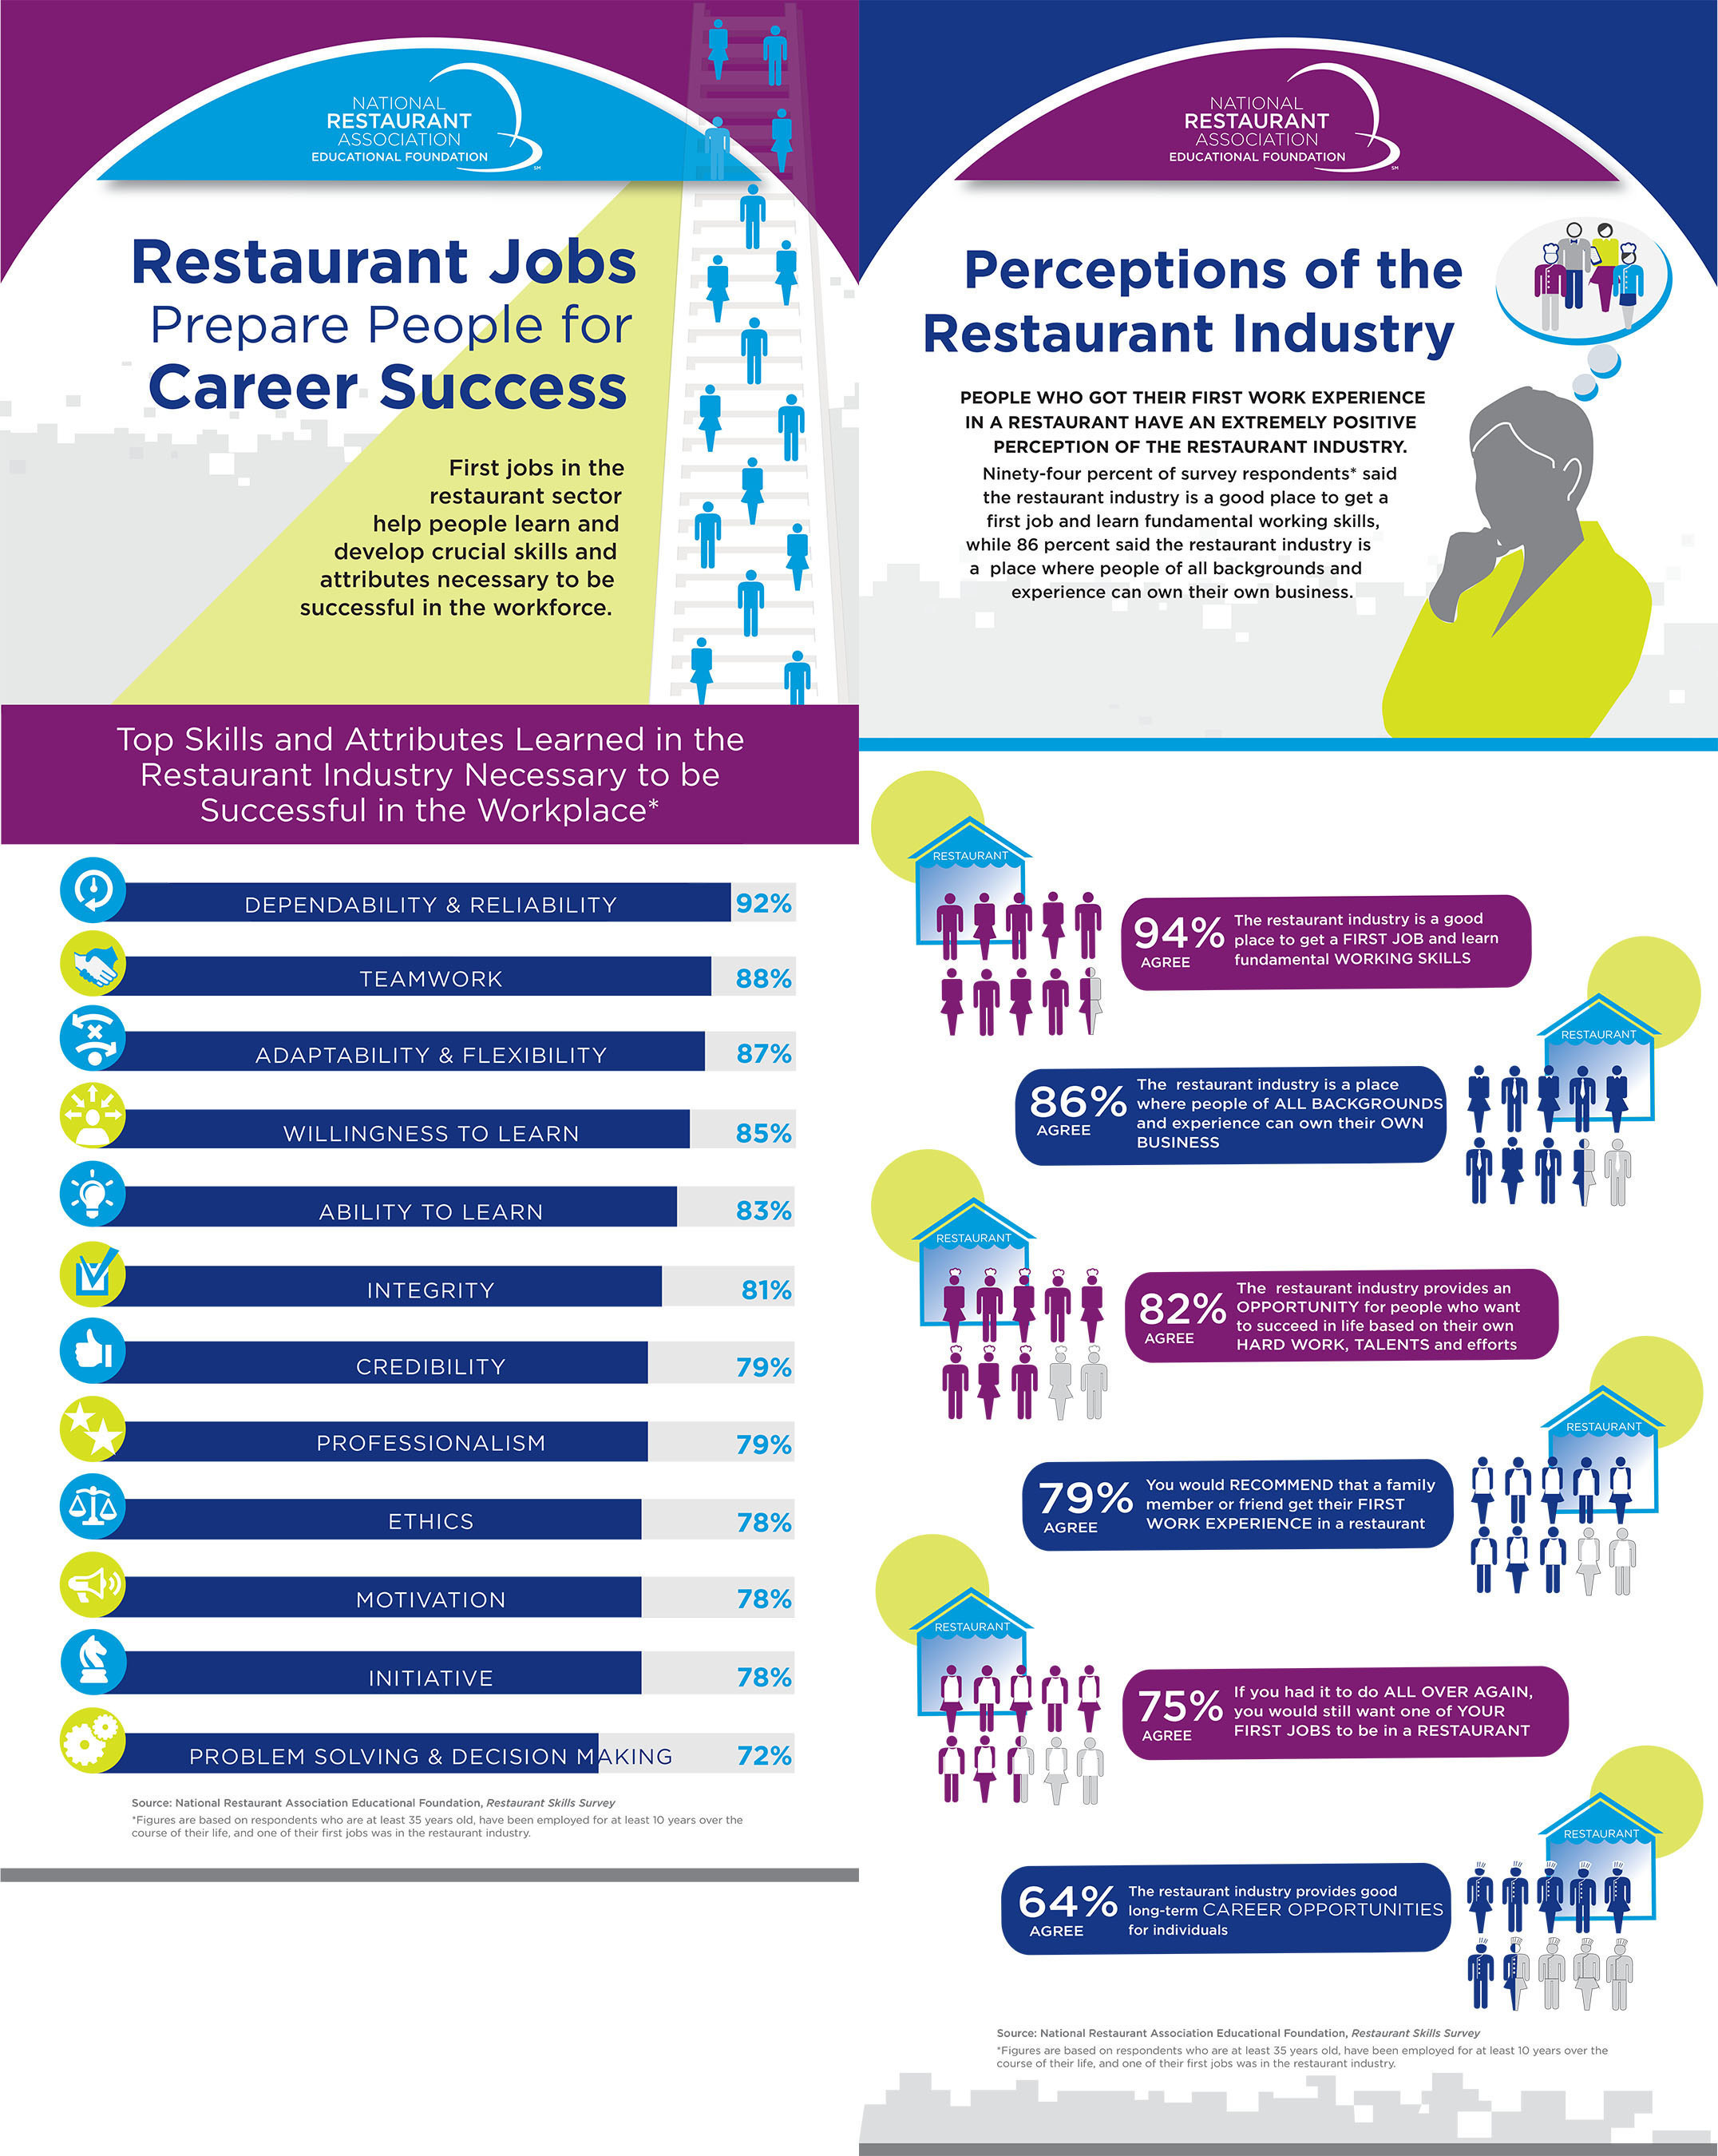
According to information from the National Restaurant Association, the restaurant industry remains the nation’s second-largest private sector employer this year, with a workforce of 14.4 million. Jobs in the industry represent an excellent way for people to gain valuable career-building knowledge and skills, as well as explore the diverse array of career opportunities in food service.
Boomers Still Eat
While it seems all you read about is Millennial this and that and their impact on food and nutrition, Boomers have their own set of unique ideas about what they want on their plate. The International Food Information Council (IFIC) Foundation dug deep into what Boomers think about food and nutrition in the 2016 Food and Health Survey. According to the survey, perceptions of the healthfulness of certain foods vary dramatically between generations, especially Boomers versus Millennials. Boomers are more likely than Millennials to rate whole grains (80 percent vs. 70 percent), protein from plant sources (75 percent vs. 63 percent), and omega-3 fatty acids (71 percent vs. 59 percent) as healthy.
Boomers are also looking for different health benefits from their food compared to other generations, particularly Millennials. Boomers are more likely than Millennials to be interested in health benefits associated with foods such as weight management, cardiovascular health and digestive health. Millennials are more likely to be interested in benefits such as mental health, muscle health and immunity associated with foods. Boomers have a distinct definition of a healthy eating style compared to other generations. Boomers (32 percent) are more likely than the general population (22 percent) to define a healthy eating style by moderation/serving size and portions. Additionally, Boomers (30 percent) are more likely than Millennials (17 percent) to define a healthy eating style as including certain foods they define as healthy.
Boomers’ are also reporting that their opinions on sweeteners are changing. Almost four in ten Boomers (37 percent) believe “added” sugars are less healthful than they used to believe, with nine in ten of those who have recently changed their opinion on added sugars reporting they are now consuming less. Of those who report changing their opinion of added sugars within the last year, Boomers are more likely than Millennials (37 percent vs. 29 percent) to view them as less healthful than they used too. Additionally, Boomers are more likely to agree that low-calorie sweeteners can play a role in weight management (31 percent) than Millennials (14 percent) and the general population (18 percent).
Grocerants and Food Safety
With the rise of the grocerant — supermarkets that offer prepared, restaurant-style foods — comes consumer concerns regarding food safety. Although the majority of U.S. consumers feel that foods in supermarkets are safe, the percentage who feels this way has decreased over the last ten years as grocery stores have increased prepared food offerings, according to The NPD Group. NPD, which has tracked food safety concerns in the U.S. since 2001, indicates that in 2006, 66 percent agreed with the statement that foods sold in supermarkets are safe, and in 2016 (thru August) only 58 percent of adults agree with the statement.
In-store dining and take-out of prepared foods from grocers has grown nearly 30 percent since 2008, and accounted for 2.4 billion foodservice visits and $10 billion of consumer spending in 2015, based on NPD Group’s ongoing foodservice market research. Over 40 percent of the U.S. population purchases prepared foods from grocery stores. Grocerants have even garnered the attention of the coveted Millennials, who use grocery stores less than other generational groups, but are increasing their use of prepared foods at supermarkets.
Historically, based on NPD Group’s Food Safety Monitor, consumers have had a greater concern about the safety of foods served at restaurants than at supermarkets. However, the percentage of consumers who feel that foods served at restaurants are safe has remained, on average, between 47 and 49 percent since 2006.
Restaurant Flaws Stop Return Visits
A new survey commissioned by Cintas Corporation and conducted by Harris Poll identifies common issues that would keep Americans from returning to restaurants. Conducted online among 2,034 U.S. adults ages 18 and older, the study found that 97 percent of U.S. adults would be influenced to not return to a restaurant if they experienced some type of issue related to the facility.
The top five factors that would turn diners away from a restaurant include:
- Dirty surfaces (e.g., tables, chairs, booths, dust on decor, dust bunnies on floors) – 86 percent
- General bad odor – 85 percent
- Dirty restrooms (e.g., floors, stalls, mirrors, odor) – 80 percent
- Dirty/slippery floors (e.g., wetness, dirt/dust) – 72 percent
- Entryway cleanliness (e.g., cigarette butts, overflowing trash cans, unkempt appearance) – 70 percent
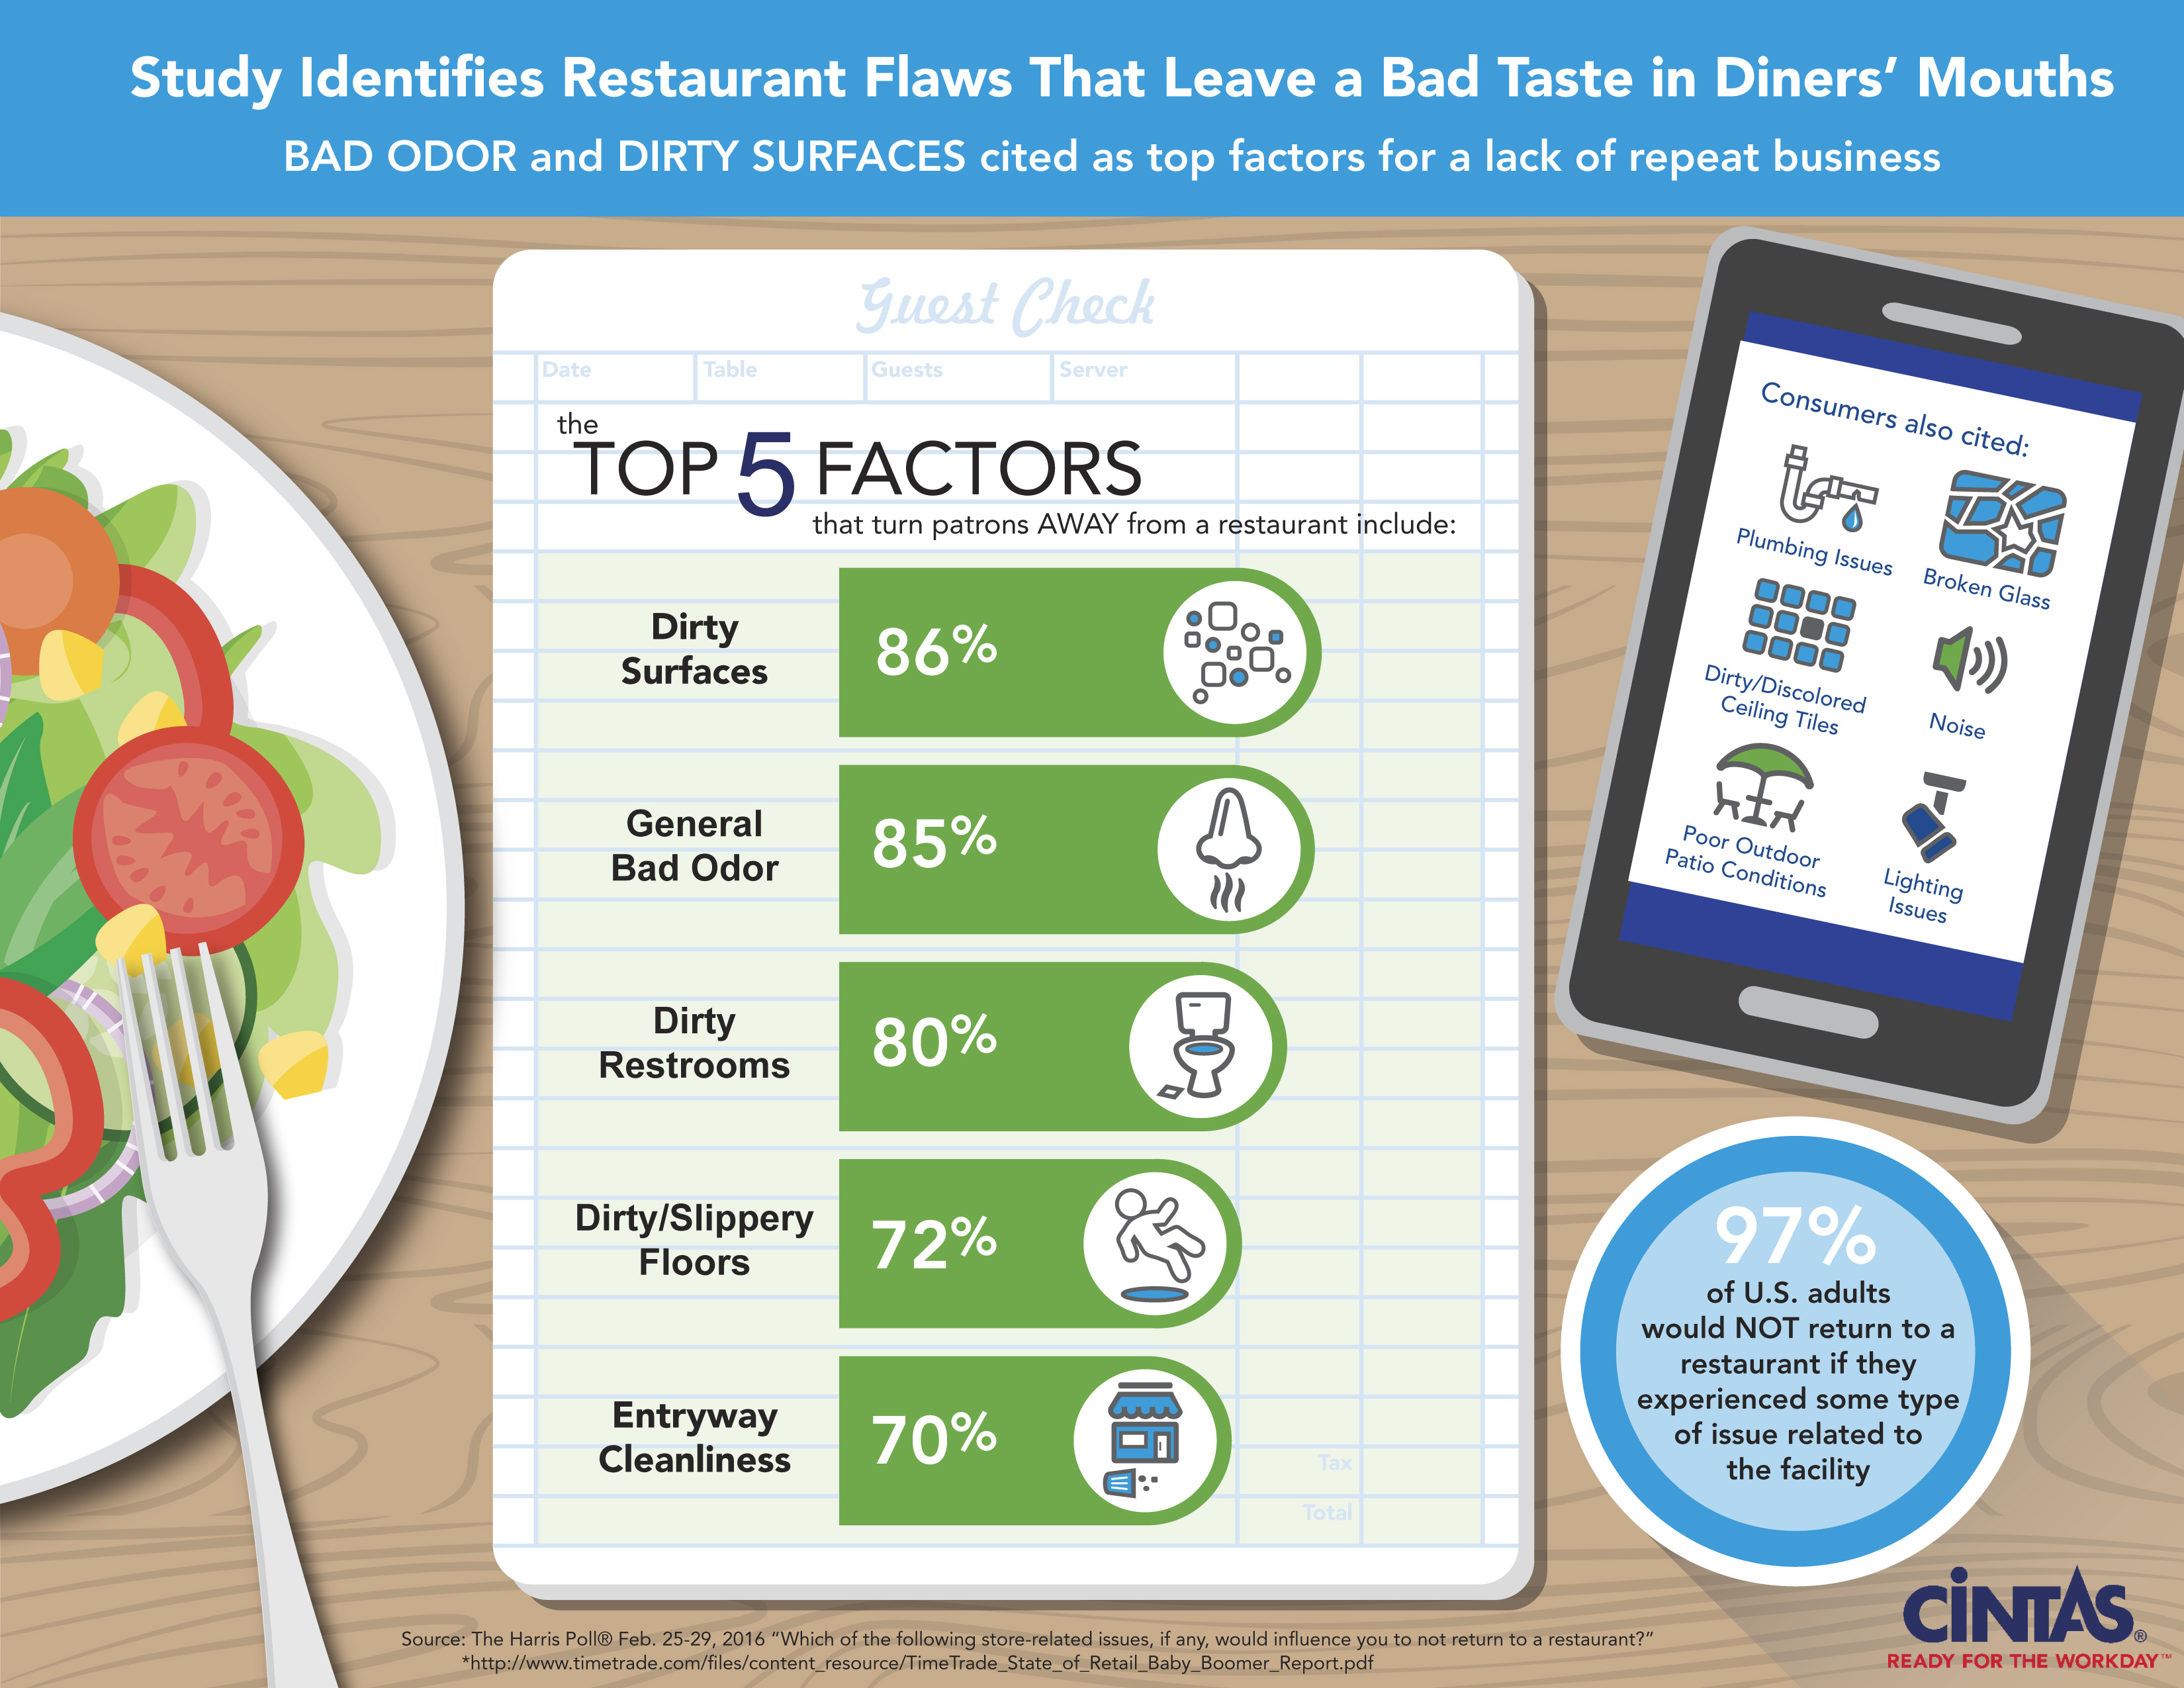
Consumers also cited plumbing issues (e.g., toilets and/or sinks not working) (68 percent), broken or cracked glass (e.g., counters, windows) (53 percent), noise (e.g., loud music, loud employees, phones ringing) (47 percent), dirty/discolored ceiling tiles (47 percent), poor outdoor patio conditions (37 percent), lighting issues (e.g., light fixtures out, not working properly, poor lighting) (36 percent) and other issues (21%) as factors that would influence them in choosing to not return to a restaurant.
The study also found that gender plays a role in which factors influence a customer to avoid a restaurant. Women are less likely to return to a facility with a dirty entryway (75 percent) than males (64 percent). More women (72 percent) also said a plumbing issue would prevent them from returning to a restaurant, compared to 63 percent of men. Older Americans, ages 65 and older, said that dirty/slippery floors would influence their decision to return to a restaurant (88 percent vs. 61 percent ages, 18-34.)
Consumers Demand Product Transparency
Consumer demand for product transparency is on the rise, and brands that fulfill this demand by providing comprehensive product information are poised to grow market share and revenue. In fact, Label Insight’s 2016 Transparency ROI Study reveals that nearly nine in ten consumers say transparency is important to them across every food product category, and 40 percent say they would switch to a new brand if it offered full product transparency.
The study examines the specific information consumers seek from brands, how they want to access that information, and how that information affects purchase behavior and brand loyalty. The study surveyed more than 2,000 consumers and reveals an overall desire for more product information, as well as an inclination to be more loyal to brands that provide more detailed insights.
The report addresses the impact of transparency on consumer loyalty and purchase behavior, and provides guidelines for brands on how to develop trust among consumers. Key findings include:
Portfolio Potential: 81 percent of consumers say they would consider a brand’s entire portfolio of products if they switched to that brand as a result of increased transparency.
Brand Trust: 56 percent report that additional product information about how food is produced, handled or sourced would make them trust that brand more.
Transparency and Revenue: 73 percent say they would be willing to pay more for a product that offers complete transparency in all attributes.
Transparency Fosters Brand Loyalty: 94 percent of respondents say they are likely to be loyal to a brand that offers complete transparency.
Millennial Moms Spend: 86 percent of 18 to 34-year-old women with children say they would pay more for food products with completely transparent information.
SmartLabel Adoption and Trust: 79 percent say they are very likely or somewhat likely to use SmartLabel technology and 44 percent say they would trust a brand more if it participated in the SmartLabel initiative.
Growing Demand for Delivery
Technavio has announced the top five leading vendors in their recent global delivery and takeaway food market report. The global delivery and takeaway food market is led by the Americas in terms of geography. The fast-paced lifestyle, the growing demand for customization in the food menu, and the rising consumer preference for delivery and takeaway food are the key driving factors for the market in this region. The trend of dining out and ordering food online is on the rise, resulting in less grocery shopping. Technology innovation such as online ordering platforms and payments are boosting the growth of the delivery and takeaway food market.
Corrugated packaging has been successful in generating curiosity among the foodservice companies as well as customers. Corrugated packaging has many environmental accreditations. Its thermal properties keep food hot. Its boxes are intended for heat maintenance for food on-the-go and the protected fluting material keeps food fresh for a long time. Corrugated packaging also protects from spills and releases. The recyclable corrugated layered board trays are gaining popularity for fish sticks and French fries. Restaurant operators globally have now moved toward sustainable sourcing of packaging materials for takeaway food to comply with the demands for sustainability and strengthen their brand image in the market. The supply chain plays a crucial role in the delivery and takeaway food market. Foodservice operators and online food aggregators are increasing their man power and creating a strong supply chain to tap potential customers.
Top five delivery and takeaway food market vendors
- Delivery Hero
- Just Eat
- foodpanda
- Takeaway.com
- Grubhub
Other prominent vendors are:
- Domino’s
- Delivery.com
- Foodler
- Olo
- Pizza Hut
- Snapfinger
- Yemeksepeti
- Zomato
Craft Coffee
Millennials are at the center of the niche segment of consumers embracing craft coffee brewing methods at home, according to the new Craft Coffee at Home report from The NPD Group. Craft coffee brewing, like using pour over cones, French presses, and vacuum brewers, is how 11 percent of U.S. young adults, ages 18 and over, brew their coffee at home.
The new report, based on survey developed with NPD partner, CivicScience, found that Millennials are twice as likely as their Boomer parents to use craft brewers at home. These younger consumers represent 44 percent of at-home craft coffee brewers, and more than a third live in urban areas. Consumers living in major cities are influenced by the prevalence of coffee bars and shops and, as a result, have discerning tastes when it comes to coffee. Craft brewing at home enables them to personalize coffee to their individual tastes and get the same quality and flavor of the coffee they buy away from home. An extra benefit of at-home craft coffee is that the small size of the brewers accommodates the space constraints of city living spaces.
Millennials, who are driven by creativity and the desire for personalization, are attracted to craft coffee brewing because of the skill and challenge involved.
“Millennials, who are driven by creativity and the desire for personalization, are attracted to craft coffee brewing because of the skill and challenge involved,” said Joe Derochowski, executive director and home industry analyst at NPD. “Craft coffee brewing enables them to participate in the experience of creating a perfect cup of coffee.”
NPD’s Craft Coffee at Home study reveals lifestyle, shopping and media consumption habits of these early adopters of the craft movement, including that they are more likely to regularly exercise at a gym, buy locally grown or organic food, donate to environmental charities, and be engaged in politics. Craft coffee consumers are social by nature, and are engaged in their surroundings.
“While sales of automatic coffee appliances have declined, in-home consumption of coffee has grown to a new normal compared to a decade ago, and NPD is forecasting 9 percent growth in coffee consumption by 2024,” added Derochowski. “The craft coffee movement, which is already embraced by the country’s largest generational group, Millennials, is well-positioned to capitalize on future industry growth.”
Demand Rising for Hemp-Based Foods
The global hemp-based foods market is expected to post a compound annual growth rate (CAGR) of more than 20 percent during the period 2016-2020, according to Technavio’s latest report. The report also presents the market segmentation based on the type of ingredient used for manufacturing hemp-based food and beverages into three main categories which are hemp seed, hemp protein, and hemp oil.
“The demand for hemp-based foods is rising, primarily due to the emergence of hemp as a superfood owing to high content of the two essential fatty acids (EFAs), omega-3 and omega-6. These fatty acids are essential for tissue growth and metabolism. These essential EFAs cannot be produced by the body and must be obtained through diet,” says Manjunath Reddy, a lead food research expert from Technavio. Nowadays, doctors and dieticians are recommending hemp-based food and beverages to their protein-deficient patients. Asia-Pacific (APAC) is anticipated to emerge as a lucrative market for hemp-based foods during the forecast period owing to the growing consumer preference for non-meat sources of protein. Specialists are also recommending hemp oil as it aids in curing terminal cancer, depression, and anxiety.
The market in North America is expected to post a CAGR of over 18 percent during the forecast period. The market is driven by growing consumer preference for better-for-you food products due to the rise in the number of people suffering from food allergies, including gluten and lactose intolerances. According to Technavio analysis, North America dominated the global gluten-free food market accounting for a market share of approximately 55 percent in 2014. The demand for hemp-based foods will rise consistently in North America as hemp-based foods are gluten-free and the number of people switching to gluten-free diet owing to gluten sensitivity in this region is comparatively higher than in other regions.
The market in Europe is expected to post a CAGR of over 23 percent during the forecast period. Owing to increasing customer preference for healthier and nutritious food, food manufacturers in Europe are expanding their product lines with hemp-based foods. Hemp based foods are believed to have allergen-free and gluten-free qualities along with a high nutritional profile.
The market in ROW is expected to post a CAGR of over 23 percent during the forecast period. In ROW, APAC is expected to emerge as the leading market for hemp-based foods during the forecast period. South Korea, Japan, China, Taiwan, Indonesia, and Malaysia are expected to emerge as the target markets in this region.
The Big Apple
The U.S. Apple Association, which represents the U.S. apple industry from growers to juice makers – is forecasting a stronger-than-average harvest this year.
“Apple season begins in August and continues into the early months of 2017, and we are already predicting that apple lovers will be finding a healthy bounty of fresh apples at their supermarkets, farmers’ markets and U-picks this year,” said Wendy Brannen, USApple’s Director of Consumer Health & Public Relations. “With this year’s apple crop expected to be three percent above the five-year average, it will be a great time to enjoy your favorite varieties, plus explore new ones you’ve either wanted to try—or are just now seeing for the first time.”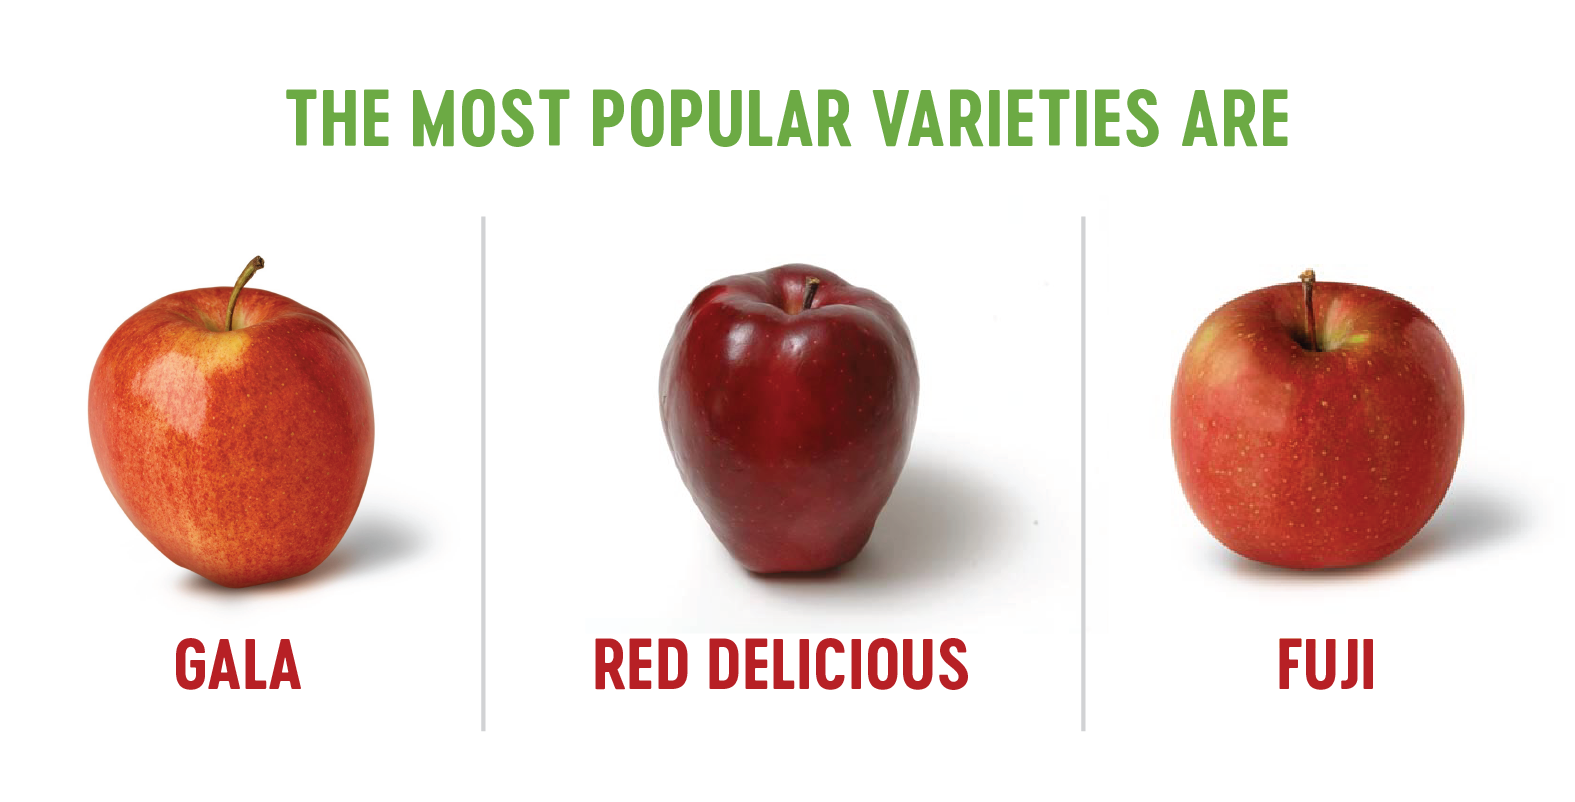
Here are key facts about this year’s apple harvest:
U.S. apple growers expect to harvest 246 million bushels of apples
That is almost 31 billion apples (as the average bushel holds 126 medium-sized apples)
Each apple will be hand-picked by people using ladders and cloth buckets – most will be picked between late August and end of October
While apples are grown in each of the lower 48, most apples will come from Washington, New York, Michigan, Pennsylvania and Virginia
More than 7,500 growers manage orchards covering 322,000 acres – most are independent, family-owned
Approximately 200 varieties will be grown, but 80 percent of all production will be from 10 varieties
Approximately 33 percent of the harvest will be processed into apple juice, applesauce, frozen and other products
The most-purchased fresh apple varieties are:
- Gala
- Red Delicious
- Fuji
- Granny Smith
- Honeycrisp
- Golden Delicious
- McIntosh
- Pink Lady
- Braeburn
- Ambrosia
The fastest-growing varieties in popularity are Honeycrisp and Pink Lady.
All About Burritos
Moe’s Southwest Grill released data on the eating habits and lifestyle preferences of various burrito consumers. While it’s no secret that burritos have become a staple in consumers’ diets, the amount of burritos consumed on a regular basis, particularly among Millennials and Gen X-ers, may come as a surprise. The survey revealed that most consumers can’t go even a week without a burrito, with 72 percent of Millennial respondents admitting to enjoying an average of two to three burritos a week, while an overwhelming majority of Gen X consumers (90 percent) admit to eating burritos at least once a week. But for many, that doesn’t satiate their burrito craving, as 75 percent of respondents said they would eat a burrito twice in one day if the burrito was so good, they had to go back, while 43 percent of consumers would eat a burrito twice in one day if calories were not object, or their significant other wouldn’t judge them.
More than half (52 percent) of Millennial respondents report that a burrito has saved them from a dateless Saturday night or an awkward conversation. And a burrito instead of a date may even be their preference, as 53 percent of this generation admit they would choose indulging in the world’s most awesome burrito over a romantic date with their significant other. Other findings: 64 percent of Millennials said a burrito was the best food to have before a night of drinking, and 62 percent of Gen X consumers agreed, while 56 percent of Millennials say a burrito has saved them from a brutal hang over.
Gen X consumers have been touched by the burrito’s powers too, with more than half (60 percent) reporting that a burrito has saved them from a sad desk lunch. Further, 47 percent say they’d give up their favorite shirt for the world’s most awesome burrito. While pop culture may lead us to believe that guacamole is the most loved topping today, the survey revealed that it’s actually sour cream that takes the cake at number one, with guac coming in a close second for favorite burrito topping (59 percent vs. 49 percent, respectively). What’s more, while traditional toppings and fillings like beans, rice, and queso reign supreme, with more than half (56 percent) of consumers admitting to liking queso in their burrito. Additionally, 75 percent of men would combine a burrito with a pepperoni pizza, while 77 percent of all women surveyed would combine a burrito with orange chicken.