
According to a Recent Study/Survey … Mid-November 2017 Edition
23 Min Read By MRM Staff
This edition of Modern Restaurant Management (MRM) magazine’s “According to …” research roundup features exclusive results of Taco Bell’s “Steal a Base, Steal a Taco” LTO campaign from the experts at Sense360 in addition to a nationwide food-on-demand study, the importance of color for restaurants and the best restaurants for group dining.
‘Steal a Base, Steal a Taco’
According to Sense360, “Steal a Taco” inspired a major lift at Taco Bell during last year’s World Series – so what will be the rate of success year-over-year? Sense360 can pinpoint consumer traffic to restaurants, and show exactly how Taco Bell performed during the Steal a Taco promotion in comparison to other timeframes with no promotion.
 The report investigated the effects of a limited time offering on visitation by observing visit patterns both before and during the campaign in both the pilot DMAs and non-pilot DMAs and highlighting the differences between the two periods.
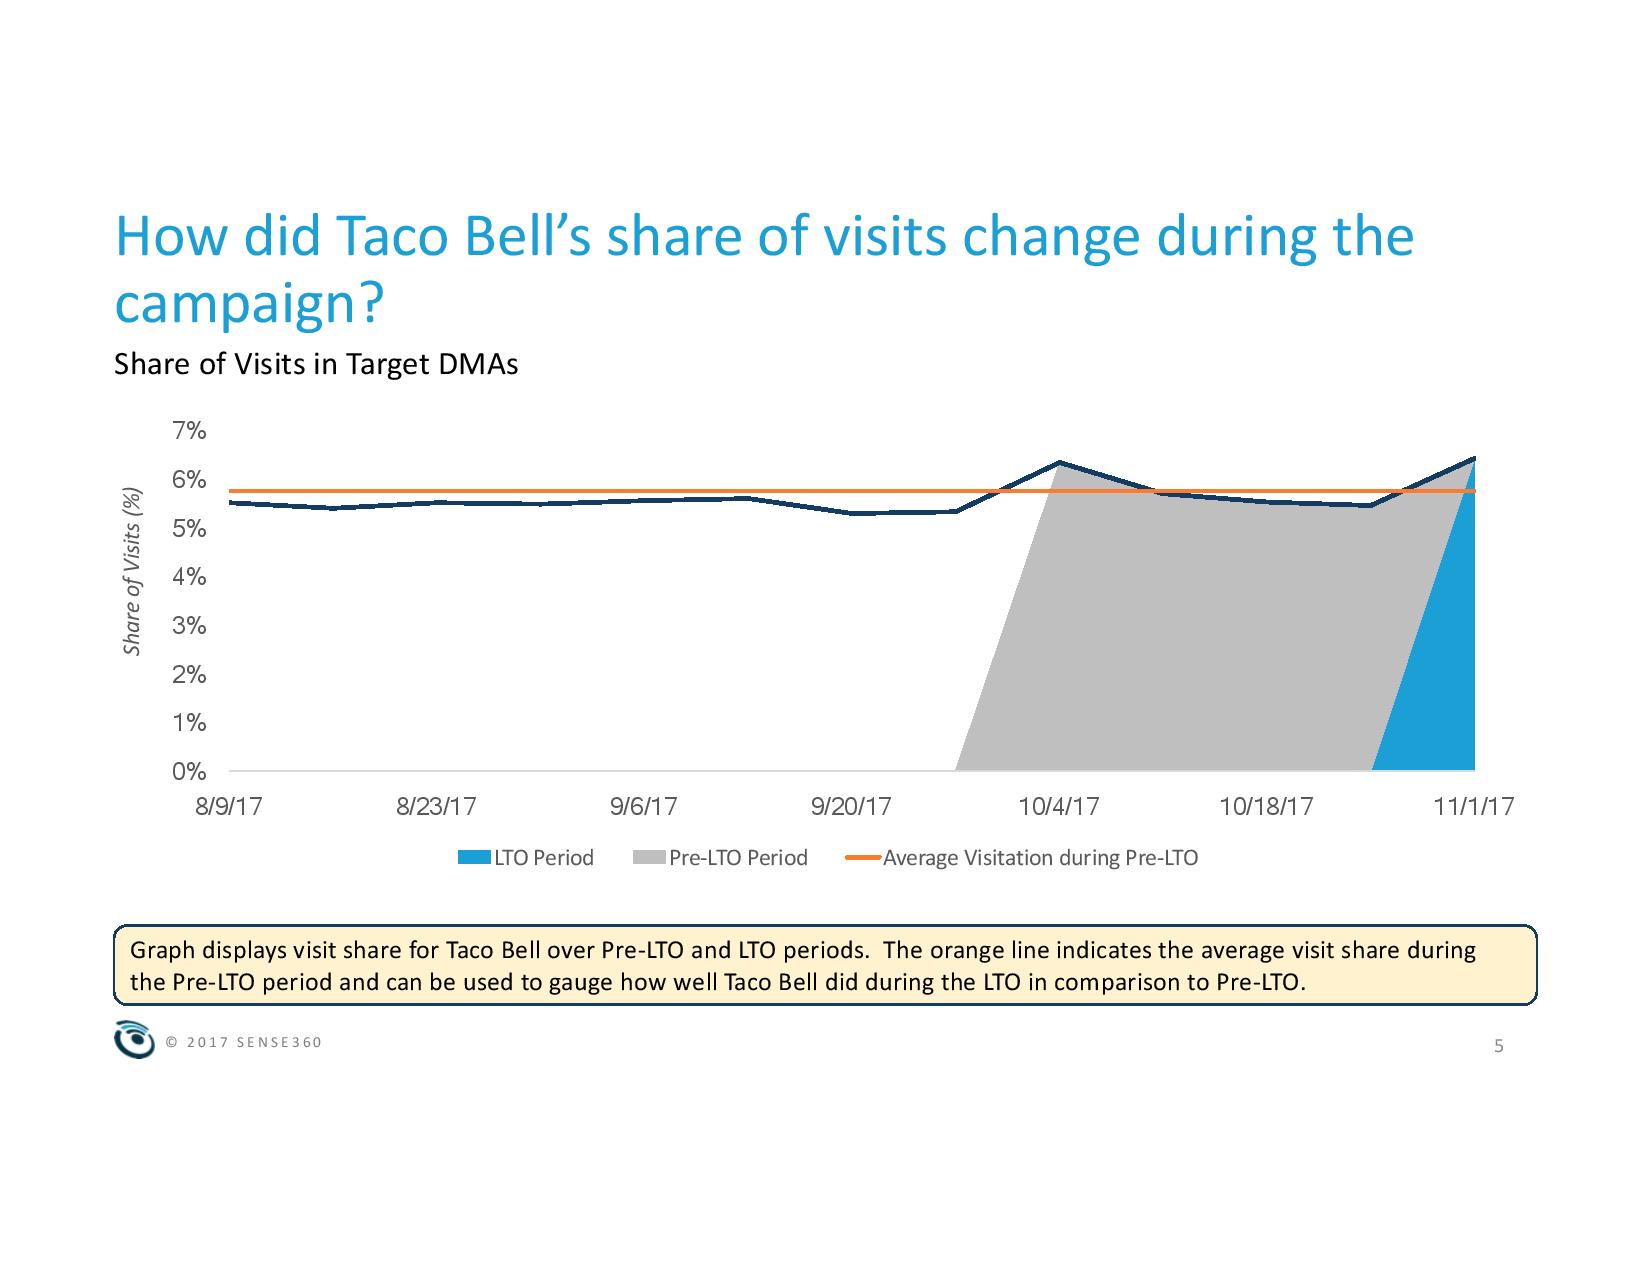
This report specifically looks at the Steal a Base, Steal a Taco.
Campaign Description: Thanks to Cameron Maybin’s stolen base anyone who attended Taco Bell the Wednesday after game two received a free taco. Sense360 looked at visit trends on Wednesday (11/1/2017) and compared to the prior four Wednesdays back to 10/4/2017 in Los Angeles and Houston to measure the impact of the offering.
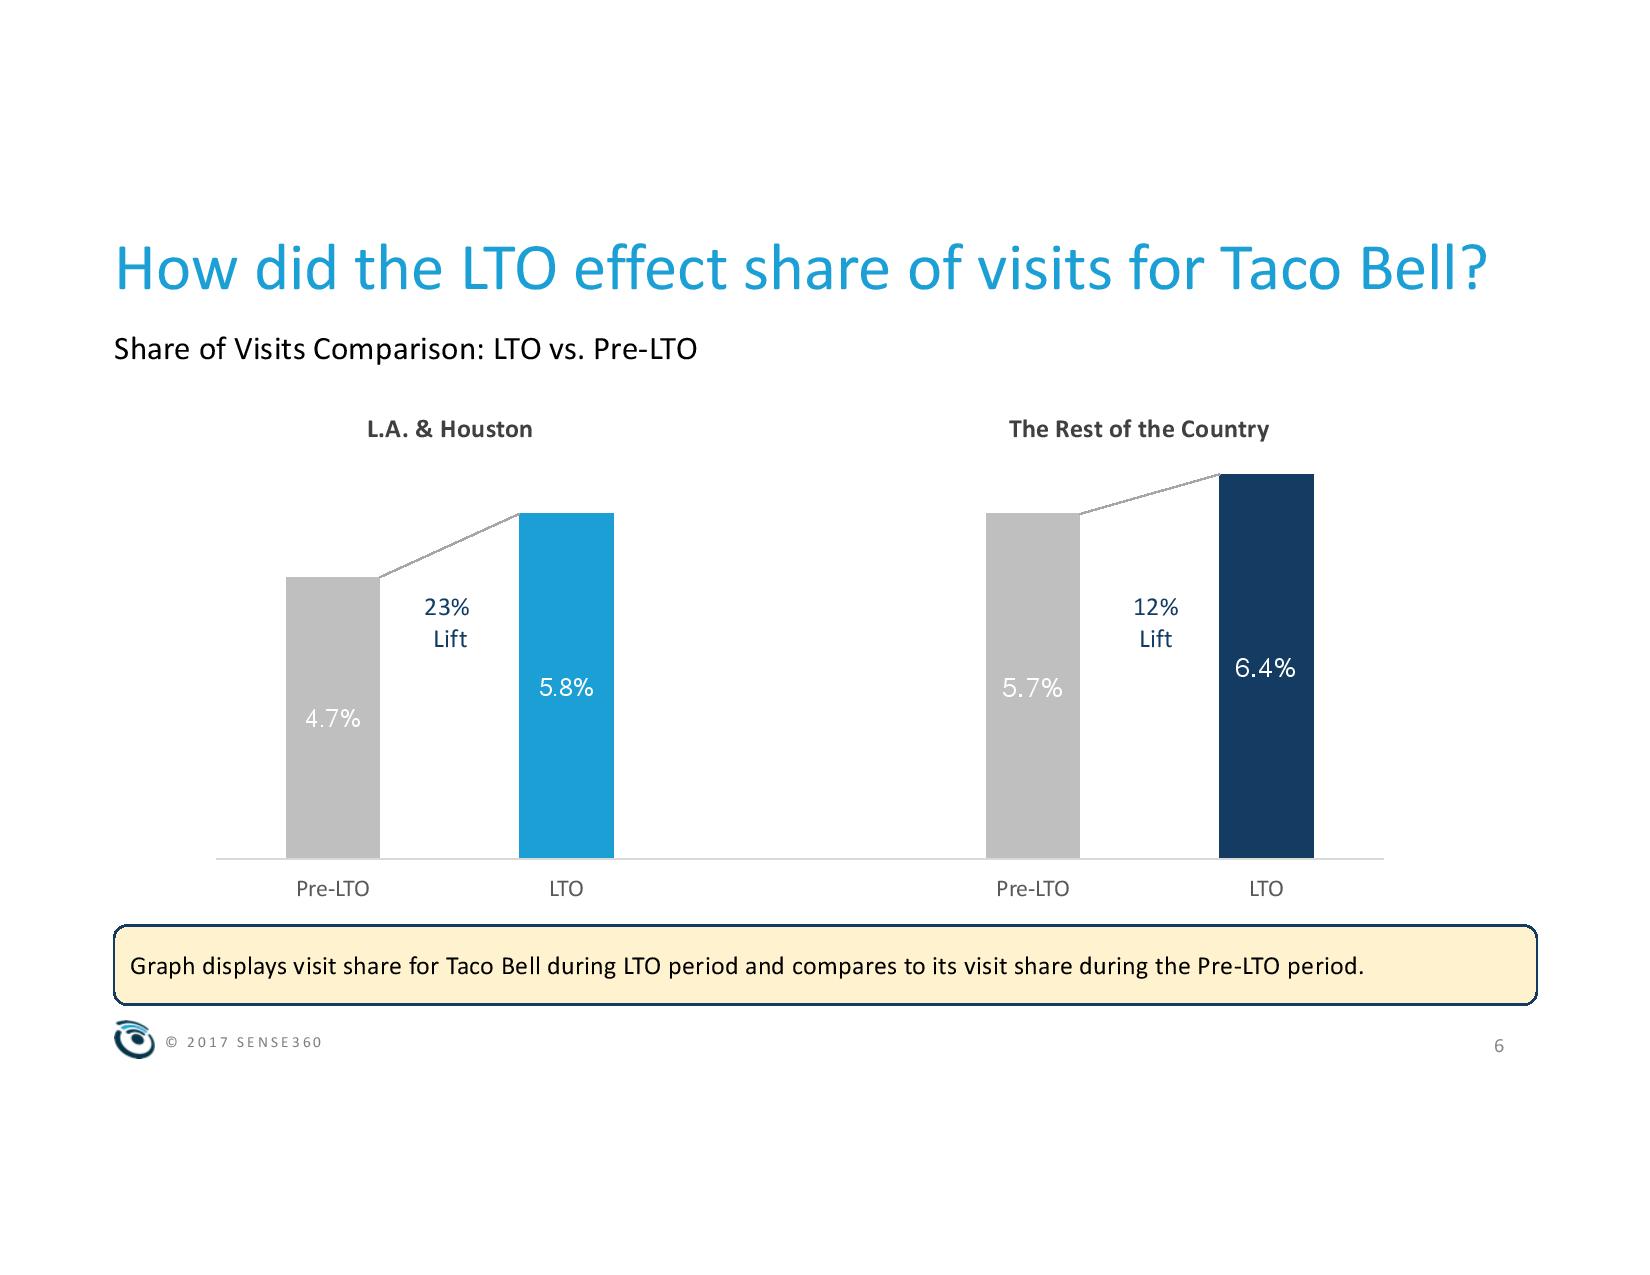
Taco Bell saw a 23 percent lift in visit share in Houston and Los Angeles; and 12 percent lift in visit share across the country
However, looking YOY, Taco Bell saw 17 percent less lift in national visit share during the same promotion time period in 2017 vs. 2016.
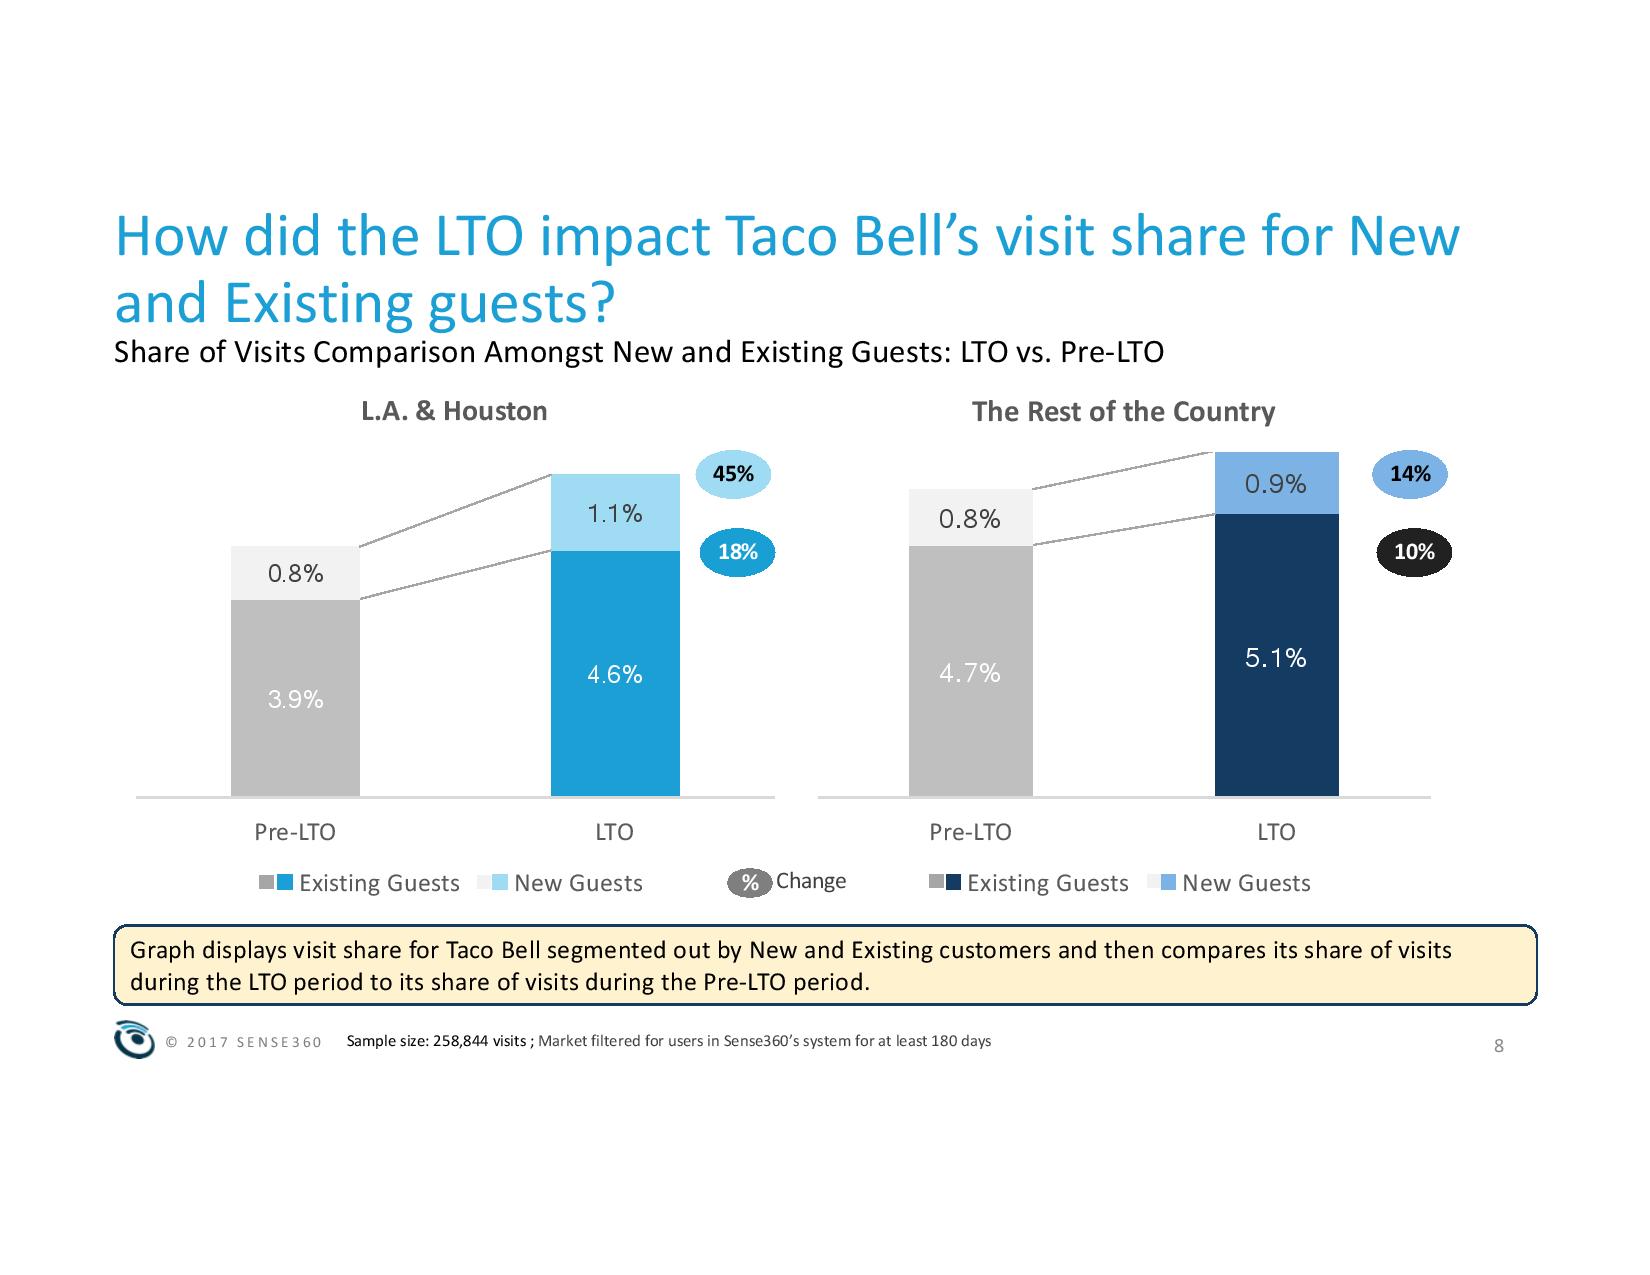
L.A./Houston saw 45 percent increase in new guests visit share vs. benchmark period. Rest of the country saw a 14 percent increase.
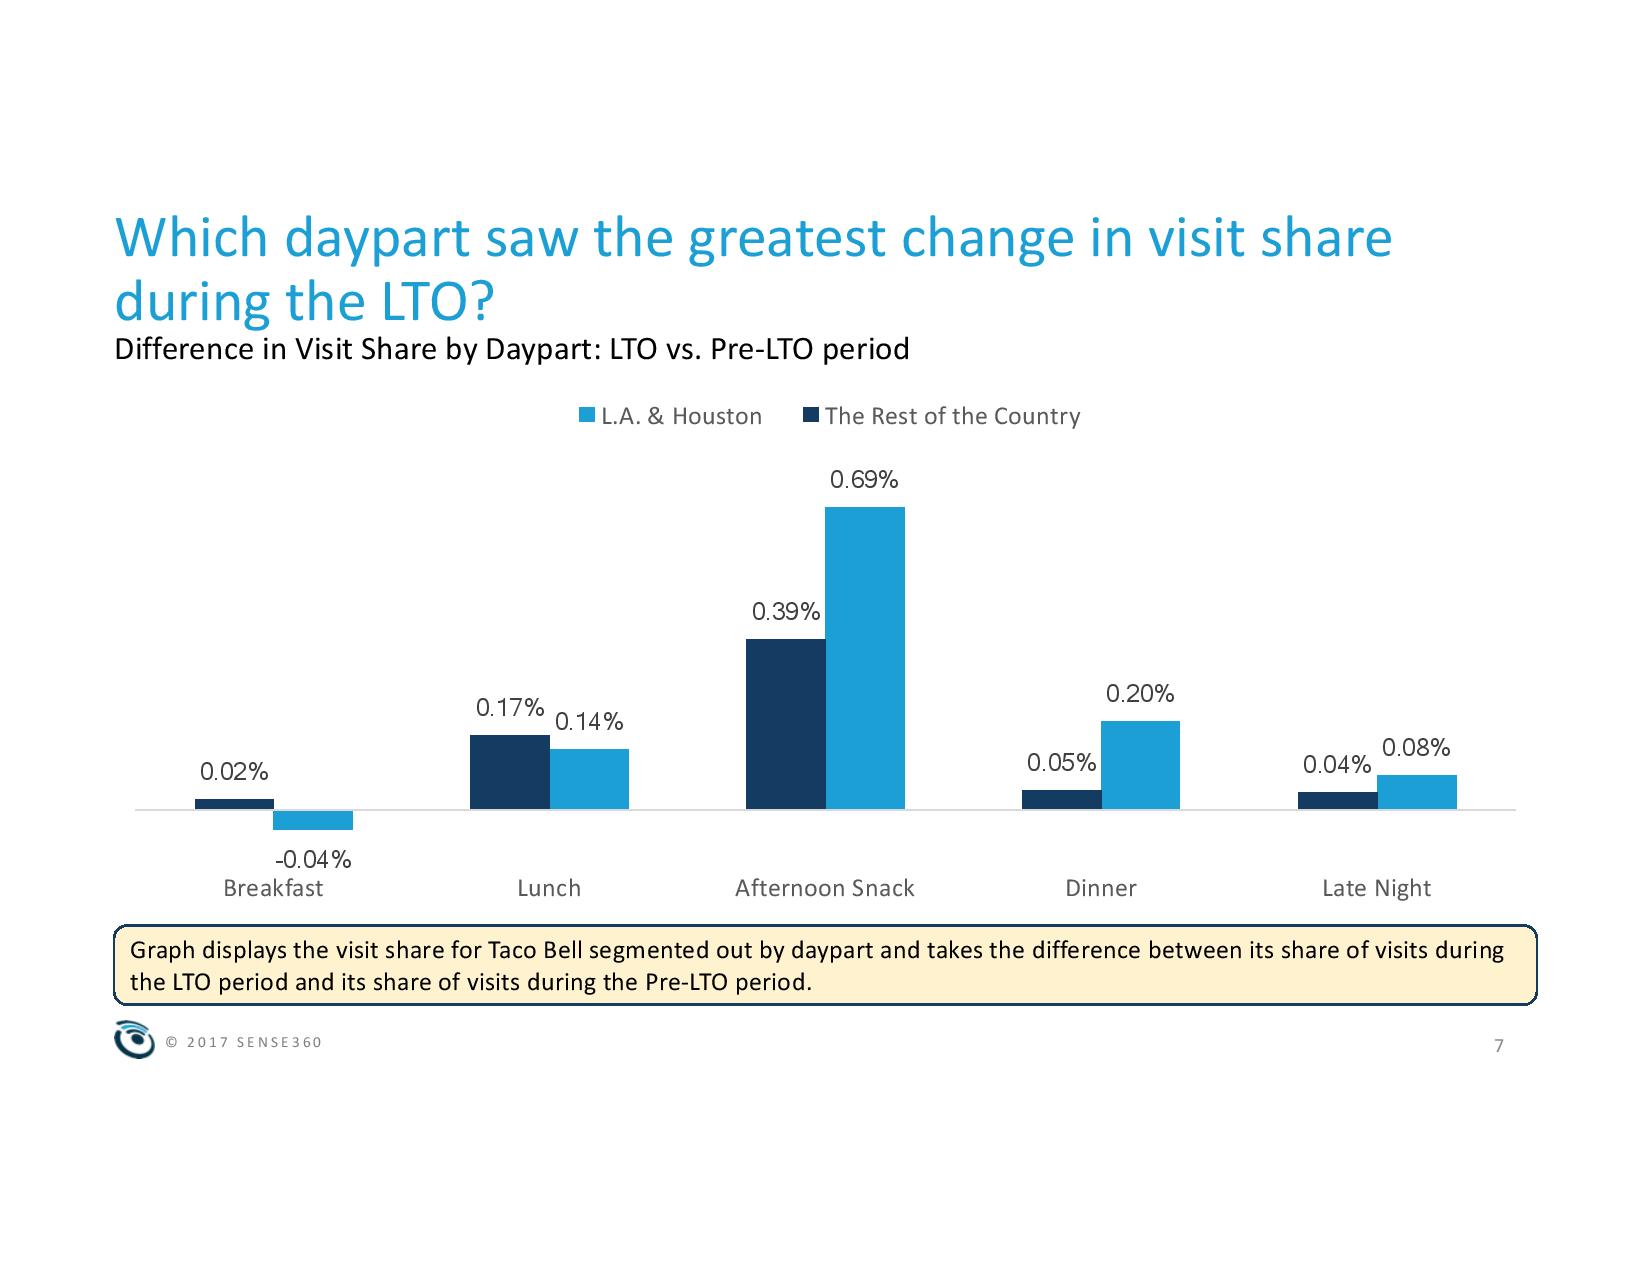
Afternoon Snack had the largest absolute increase as well as relative. Afternoon Snack in L.A. & Houston saw a 110 percent relative lift from the pre-promotion period. The promotion was from 2-6pm local times.
Heavy-Light: you will notice, looking at the prior period regional report, that a majority of the increase is driven by light guests. That said, it is interesting that Taco Bell’s share among light guests is less than last year, and even more interesting is that McDonald’s seems to be the brand responsible for absorbing a big chunk of the difference.
Nationwide Food-on-Demand Study
A first-of-its-kind national study with 1,400 mystery shoppers found that UberEATS has the fastest delivery time (35 minutes and 31 seconds, on average). The study was conducted by SeeLevel HX with mystery shoppers ordering food through apps from UberEATS, Grubhub, DoorDash and Postmates in five major cities: Atlanta, Los Angeles, Chicago, Boston and Dallas. The study measured more than 20 other aspects of the delivery, as well, including driver attentiveness and whether the hot food was still hot on delivery.
| Service | Average Delivery Time |
Total Cost |
||||||
| UberEats | 35m31s | $20.74 | ||||||
| Postmates | 40m12s | $24.78 | ||||||
| Grubhub | 50m22s | $22.93 | ||||||
| DoorDash | 42m01s | $21.21 | ||||||
“Our study also showed that for all four delivery services, both the car and the driver were rated as professional and clean for 98% of the deliveries,“ says Lisa van Kesteren, CEO of SeeLevel HX. “This should be reassuring for restaurant services considering third-party delivery services.”
In terms of managing client expectations, DoorDash did the best job with 92% of deliveries that were delivered either early or on-time based on promised delivery times.
Across the cities surveyed, Atlanta had the overall slowest delivery time (45 minutes and 41 seconds), while Los Angeles came out fastest at 39 minutes and 20 seconds. Los Angeles also had the cheapest overall cost at $19.38 while Dallas came out on top with $24.23.
What Colors Mean for Restaurants
According to Upserve’s recently launched Restaurant Insider, when it comes to restaurant decor most shades of red are a no-no. The ambiance of a restaurant is a huge part of why patrons come back — and building customer loyalty and retention is a huge part of growing a restaurant business.
The team at Upserve polled experts who said they pushed heavily against red in any sit-down restaurant, saying that red is appropriate only for fast food. In an analysis gathered from color and feng shui experts Cara Gallagher, Dana Claudat, Nancy Zeigler, Gina Mims and Judith Wendell along with Jonathan Raduns, food merchandising consultant at National Restaurant Consultants for some serious restaurant decor ideas and advice, they said red increases the heart rate, blood pressure, and stimulates impulse eating. While it does provoke hunger, Claudat says, “we mistake red for being a prosperous feng shui color for food—it is not.” Gallagher says the reason why red works so well for fast food restaurants is because their goal is volume. “They want to get diners in and out quickly. The faster the people eat and move along the quicker they can get new diners in their establishment.”
Zeigler elaborated, saying that the hue of red matters. The brighter the red, the more it will repel your customers. “Red stimulates conversation and raises heart rate, so people get excited, physically and emotionally, when they first enter a red room,” she says. Accents aren’t all bad though, as you can see from this example of New York’s Red Restaurant, who despite the name, only uses red as an accent color.
While bright red is typically on the no-no list, Zeigler recently painted the walls of a restaurant a deep brick terracotta color – still a version of red, but on the earthy and warm side. She says that other colors known to stimulate appetite include oranges, persimmon, deep yellows and fresh greens.
“Sit down casual restaurants often benefit from soft natural colors and tones that encourage folks to relax and enjoy themselves, and hopefully order an appetizer and possibly stay awhile longer for dessert and coffee,” says Raduns, “green is a great color for restaurants trying to communicate freshness and healthy options.” Silver is often added to this combination to add a “new age” feel, emphasizing the sense of freshness not only in taste but also in style.
“Health food restaurants have been focused on green and wood,” says Claudat, but green works less well in bars and naturally dark places, where a bright, fresh green turns more dark and dismal, according to Zeigler’s recent redesign of this old pub.
To learn more about the ins and outs of restaurant interior design, download Upserve’s Ultimate Guide to Restaurant Decor.
Food Service in APAC Forecast
According to the latest market study released by Technavio, the food service market in APAC is expected to grow at a CAGR of close to 7 percent during the forecast period.
This research report titled ‘Food Service Market in APAC 2017-2021’ provides an in-depth analysis of the market in terms of revenue and emerging market trends. This report also includes an up to date analysis and forecasts for various market segments and all geographical regions.
The market research analysis categorizes the food service market in APAC into the following type of services. They are:
- Restaurants
- Fast foods
- Cafés/bars
- Delivery and takeaway
- Others
The top three revenue-generating segments are discussed below:
Restaurants Market in APAC
The restaurants market in APAC accounted for more than 46 percent of the total market share in 2016. The increasing demand for premium drinks, the eminence of craft segment, large-scale mergers and acquisitions, and proper marketing is propelling the growth in the market. The market players leverage social media and digital media platforms to promote and market their product offerings. The increasing demand for craft alcohol, such as craft beer will impact the market positively. The volume of alcohol beverages has increased steadily because of the emergence of new wineries, breweries, and distilleries with growing production capacity and increasing number of new product varieties.
According to Manjunath Reddy, a lead analyst at Technavio for food service research, “The rise in demand for restaurants in APAC is attributed to the increase in the consumer income level. Strong emerging economies like China, Indonesia, Philippines, Thailand, Malaysia, India, and Vietnam will propel the growth of the market in this region.”
Fast Food Market in APAC
In 2016, the fast food market in APAC occupied for more than 23 percent of the total market share. Fast food is considered as an empty calorie food, which can be defined as food with high calories and fewer micronutrients. The growing urbanization is significantly impacting the food intake routine of consumers where most of them are attracted toward fast food. Based on infrastructure, fast food restaurants can be classified into quick service restaurants (QSRs) and fast casual restaurants. QSRs are grasping the fast food market because of their authenticity and hygiene.
“The growing urbanization and infrastructure, such as new malls and shopping complexes, have provided new opportunities for the foodservice chains to expand their outlets. The development of new fast food style chains will propel the growth in the market,” says Manjunath.
Cafés/Bars Market in APAC
The cafés/bars market in APAC accounted for more than 46 percent of the total market share in 2016. The western culture of sipping premium coffee and socializing in coffee shops is driving the specialty coffee shops market in APAC. The market growth is driven by local chains rather than international brands alone. The main reason for the rise in the demand for cafés/bars is attributed to the increase in the consumer income level. However, strict government regulations and increased taxes and duties on alcoholic drinks are expected to hinder the market growth. The availability of alcohol worldwide is roughly one outlet per 250 residents while in China, it is one outlet per 300 residents.
The top vendors highlighted by Technavio’s market research analysts in this report are:
- McDonald’s
- Restaurant Brands International
- Seven & i Holdings
- Starbucks
- Yum China Holdings
Third-Quarter Trends
The restaurant industry landscape continues to be challenging for leading operators, according to Technomic’s compilation and analysis of third quarter earnings reports. To date, approximately 60 companies have released their third quarter financials and over half have reported declines in comparable quarterly sales. To learn more about how you can utilize Technomic’s Digital Resource Library to track foodservices industry trends visit: https://www.technomic.com/available-studies/industry-reports
On average, publicly-held companies saw their third quarter comparable sales drop by 1.3 percent. Full service dining operators were the hardest hit with 24 of 32 companies posting negative quarterly comparable sales.
“As we look to the fourth quarter, expect modest improvements in comparable sales as operators face easier quarterly comparisons from the prior year and also begin to turn a corner on hurricane-related performance issues,” states Kevin Schimpf, industry research manager at Technomic.
Here’s a brief look at the operators who fared well in the third quarter and those who fell short:
Trending Up:
McDonald’s has seen its U.S. comparable sales increase for three consecutive quarters, rising from a second quarter mark of 3.9 percent to 4.1 percent growth in the third quarter. National beverage and McPick 2 value promotions were noted as key factors driving sales growth.
Texas Roadhouse continues to be one of the few bright spots in the casual-dining segment, posting 4.5 percent comparable sales growth in the third quarter, propelled by customer traffic gains of 3.5 percent.
Burger King’s 4 percent growth is its highest U.S. comparable sales mark since the first quarter of 2016. Globally, comparable sales increased by 3.6 percent with strong unit expansion boosting quarterly system-wide sales growth to 6.6 percent.
Trending Down:
Chipotle posted one percent comparable sales growth in the third quarter, whichmarks three consecutive quarters with decelerating same-store sales. While year-to-date comparable sales growth stands at 8.3 percent, the company projects to close out 2017 with comparable sales of 6.5 percent.
Papa John’s has now observed four straight quarters of decreasing comparable sales growth and is also facing widespread criticism over attributing its declining performance to falling NFL TV viewership and negative sentiment surrounding the league. The company posted 1 percent North American comparable sales growth in the third quarter with year-to-date growth registering at 1.5 percent.
The fast-casual segment continues to see a relative downturn in 2017 as eight of eleven publicly held fast-casual chains posted negative third quarter comparable sales including key segment players Shack Shake, Potbelly, and The Habit Burger Grill.
Encouraging October
After disappointing sales in the third quarter, the restaurant industry was desperate for some good news and October delivered with comparable sales turning positive for the first time since May of 2016. The 0.9 percent growth in October is the best result in over two years. These insights come from TDn2K™ data through The Restaurant Industry Snapshot™, based on weekly sales from 30,000 restaurant units, 155+ brands and representing $68+ billion dollars in annual revenue.
Same-store traffic declined -1.5 percent, continued evidence that falling guest counts remain the biggest challenge for chain restaurants since the recession. However, October’s traffic results do represent the best month since February of 2016 and are significantly improved over the average -3.6 percent traffic decline in the first three quarters of the year.
“Another encouraging sign was that the October sales improvement was evident at the brand level and not only in the aggregate numbers,” stated Victor Fernandez, executive director of insights and knowledge for TDn2K. “Over half of the brands tracked by Black Box Intelligence™ had positive sales for the month. For comparison, fewer than a third of the brands were up in September.”
The Macroeconomic Environment
“The economy posted its second consecutive quarter of 3 percent GDP growth, an indication that business activity is really solid,” explained Joel Naroff, president of Naroff Economic Advisors and TDn2K economist. “This occurred despite the hurricanes devastating parts of Texas and Florida, making the growth rate even more impressive.”
The economy’s resilience was seen in the solid October job increase and decline in the unemployment rate to the lowest level in seventeen years. The strong economy is allowing consumers to spend more and that demand is being spread around. However, there is a warning in the data. Wage gains remain muted and households are now pulling from savings to maintain their standard of living. Growth should be strong enough going forward to tighten the labor market further, but without better wage increases, it will be hard to sustain the recent strong growth in consumer spending through all of next year.
Guest Check Growth Picking Up
On top of improved traffic performance, top lines benefitted from higher guest checks. On average, consumers spent 2.5 percent more in October than they did in the same period last year. Since January 2017, guest checks had only been growing at an average 2.0 percent.
Strong Month For Table Service Brands
The sales recovery in October extended across industry segments, all of which posted their highest sales growth rates since July. The month was particularly strong for table service brands: family dining, casual dining, upscale casual and fine dining all had positive sales growth in October.
Recovery Has Been Strong In Texas and Florida
Geographically, all regions of the country had stronger sales in October than September. Sales improvement was particularly strong in Florida (up 11.3 percentage points from September) and Texas (3.4 percentage point improvement). These two states, along with the Western region, were the three best-performing regions for the month.
Key to Workforce Success: Focus on the General Manager
The national unemployment rate, which is highly correlated to restaurant hourly employee turnover, dipped again in October to 4.1 percent. This is a seventeen-year low. Restaurant turnover typically rises when unemployment falls. With turnover already at historically high levels, the outlook is that operators will continue to struggle to find and retain hourly employees.
According to TDn2K’s People Report™, hourly employee turnover decreased slightly in September, signaling that perhaps turnover has reached a plateau. Unfortunately, management turnover continued to increase.
People Report research has shown that a primary reason restaurant managers leave their jobs is for higher compensation. This suggests rising labor costs in upcoming quarters as restaurants feel the pressure to pay more to attract and retain key employees. This research also underscores the critical importance of the general manager position. “We know that the success of the general manager will impact the key driver of service, and ultimately the guest’s intent to return,” commented Joni Thomas Doolin, CEO and People Report founder. “Companies that do a better job of attracting, compensating, retaining and developing this key position will continue to have a competitive advantage.”
Looking Ahead
Restaurant sales have been on an upswing since the low point in July and finally broke through to positive territory in October. Looking ahead to the fourth quarter and the holiday season, the question is whether this trend can be sustained or if it’s just a short-term anomaly.
“On the positive side, economic indicators such as improved GDP growth and strong consumer confidence point to a favorable macro environment. Also, we’ll be comparing to generally weak results from last year,” expressed Fernandez. “But retail sales can be a big factor, especially the degree to which online shopping impacts brick-and-mortar visits. Overall, we’re encouraged by depth and breadth of recent trends and are cautiously optimistic they will extend through the fourth quarter.”
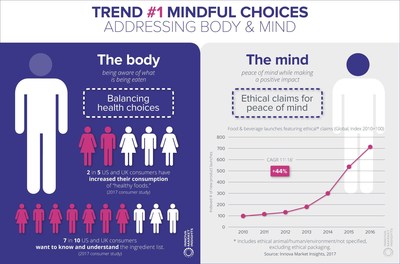
The Rise of the Mindful Consumer
The increasingly thoughtful and mindful consumer will continue to catalyze changes in the way that companies produce, package and label their products. More conscious than ever about making responsible food choices, 4 in 10 US and UK consumers increased their consumption of “healthy foods,” seven in 10 want to know and understand the ingredient list, 1 in 5 in the US are most influenced by “real” ingredients, and ethical claims on packaging are top of mind. In response, better-for-you claims continue to be on-trend, having increased their market penetration from 42 percent in 2012 to 49 percent in 2017 YTD.
“Today’s consumer displays a high level of mindfulness about well-being and the environment,” reports Lu Ann Williams, Director of Innovation at Innova Market Insights. “So it is no surprise that consumers are becoming increasingly mindful in their food choices, wanting to know what is in their foods in order to make decisions about health, sustainability and ethical issues.”
“Mindful Choices” leads the list of Innova Market Insights’ Top Ten Trends for 2018, where the company continuously analyzes global developments in food and drinks launch activity and consumer research to highlight the trends most likely to impact the food and drinks industry over the coming year and beyond.
Innova Market Insights’ top five trends for 2018 are:
- Mindful Choices. Consumers are more conscious than ever about making responsible food choices, and increasingly want to know what is in their food and how it is produced. Innova Market Insights research data indicates that 1 in 2 US, UK and German consumers read ingredient labels often and that 7 out of 10 US and UK consumers want to know and understand ingredient lists. At the same time, rising levels of interest in ethical issues have resulted in the use of ethical claims for food and drink NPD soaring in recent years, with a CAGR of 44 percent over the 2011-2016 period.
- Lighter Enjoyment. As consumers continue to look for ways to eat and drink more healthily, lightness in terms of alcohol content, sweetness, flavor, texture or even portion size is increasing its appeal, although definitely not at the expense of a familiar, high quality and indulgent taste profile.
- Positively Processed. As consumers become more concerned about naturalness and minimal processing techniques, the industry is reviving traditional processes such as fermented foods and cold brew tea and coffee, alongside the development of new ones.
- Going Full Circle. The notion of closing the circle is increasingly taking hold, with greater consumer expectation that companies and brands will be more resource-smart via developments such as tip-to-tail eating, innovative uses for food waste and more biodegradable and renewable packaging.
- Beyond the Coffeehouse. While coffee is clearly trending among Millennial and Generation Z consumers, tea is also seeking to reinvent itself among the younger generations. With the taste and experiential associations of coffee and the healthy image of tea, the industry is increasingly using coffee and tea as ingredients and flavors outside the hot drinks and iced tea and coffee sub-categories across a wide variety of products as varied as energy bars, yogurt and jam.
The other trends identified by Innova Market Insights are:
- Say it with Color
- Dining Out, In
- From Snacks to Mini Meals
- Ocean Garden
- Bountiful Choice
The Top Trends for 2018 will be presented by Innova Market Insights at a live webinar to be held on November 21, 2017 at 4pm CET/10am EST. Register here.
Consumers Want Authenticity
Stackla, the leading user-generated content (UGC) platform, today released a new study, titled “The 2017 Consumer Content Report: Influence in the Digital Age”. The study examines the content being created and shared online, and what influences consumers’ purchasing decisions most.
Stackla surveyed 2,000 adults in the U.S., U.K. and Australia, finding that even in today’s consumerist and celebrity-centric culture, authenticity drives brand affinity. The vast majority of consumers (86 percent) said authenticity is important when deciding what brands they like and support. And people find consumer-created content to be the most authentic form of content. Consumers are three times more likely to say that content created by a consumer is authentic compared to content created by a brand.
The report also found that brands can’t fake authentic content: on average, adults can correctly identify if an image was created by a professional or generated by a consumer 70 percent of the time. In fact, the study revealed that customers will punish brands that try to fake it, with 30 percent of Millennials saying they have unfollowed a brand on social media because they felt their content was inauthentic.
“Today, authenticity is king. Consumers are inundated with content, and the only way brands can cut through all that noise is with authentic content,” said Peter Cassidy, co-founder, CMO and Chief Product Officer at Stackla. “Since consumers see UGC as inherently authentic and trustworthy, the best marketers among us are increasingly leveraging it to build lasting relationships with customers, deliver relevant brand experiences and ultimately drive revenue.”
Key Findings for Marketers:
- Authenticity drives brand affinity
- 86 percent of consumers say authenticity is important when deciding what brands they like and support
- More than half (57 percent) of consumers think that less than half of brands create content that resonates as authentic
- Consumers can spot professional vs. user-generated content
- On average, people are able to identify if an image was created by a professional or brand vs. generated by a consumer 70 percent of the time
- User-generated content is more authentic and influential than professional and celebrity content
- Consumers are three times more likely to say that content created by a consumer is authentic compared to content created by a brand
- On average, 60 percent of consumers say content from a friend or family member influences their purchases decisions, while just 23 percent of consumers say content from celebrities influenced their purchasing decisions
- 57 percent of Millennials have made travel plans based on an image or video they saw a friend post on social media
- 56 percent of Millennials have decided to eat at a restaurant because they saw a friend post about it on social media
- Massive amounts of UGC are at brands’ fingertips
- 85 percent of people (and 97 percent of Millennials) say they would share a positive travel experience on social media
- 76 percent of people say they would share a positive food or beverage experience on social media
- Nearly 52 percent of people say they post on social media at least once a month about products they’ve purchased
Read the full, detailed report here.
Best Restaurants for Groups
Just in time for the holidays, OpenTable is getting into the spirit by unveiling the 100 Best Restaurants for Groups in America for 2017.
From coast to coast, the complete list features restaurants across 26 states, with New York boasting 20 winning restaurants, followed by Illinois with 18, California with 13, and the District of Columbia and Nevada both claiming nine. Florida, Georgia, Indiana, Kentucky, Maryland, Massachusetts, Michigan, New Jersey, Ohio, Pennsylvania, South Carolina, Tennessee, Texas, and Washington are also represented.
It comes as no surprise that the Big Apple, known for its outstanding dining scene, is home to several restaurants found on this year’s 100 Best Restaurants for Groups list, including Jean-Georges Vongerichten’s ABC Kitchen and Keith McNally’s iconic French brasserie Balthazar. Chicago also has an impressive presence with celebrity chef Stephanie Izard’s three local hotspots, Duck Duck Goat, Girl & the Goat and Little Goat earning their stripes. From classic steak houses to buzzy Asian fusion eateries, there is an eclectic array of cuisines represented among the winners.
“Celebratory gatherings among friends and family are a highlight of the holiday dining season, and when it comes to welcoming diners at these restaurants, it’s absolutely a case of the more the merrier,” said OpenTable Chief Dining Officer Caroline Potter. “These honorees each have a festive, energetic ambiance, warm hospitality, and crowd-pleasing menus that make them perfect for groups.”
The 100 Best Restaurants for Groups in America list is generated solely from more than 10 million verified OpenTable diner reviews collected between October 1, 2016 and September 29, 2017. All restaurants with a minimum “overall” score and qualifying number of reviews were included for consideration. Qualifying restaurants were then scored and sorted according to the percentage of reviews for which “great for groups” was selected as a special feature.
Active Shooter Training Needed
Foodservice Training Portal released findings in a study conducted of 200 independent restaurants from October 2016 through January 2017 in six U.S. states. The results indicated only 16 of 200 locations polled were using any form of active shooter training with their full staff roster.
In an FBI study of active shooter events, the agency noted, “Even when law enforcement was present or able to respond within minutes, civilians often had to make life and death decisions, and, therefore, should be engaged in training and discussions on decisions they may face.” Contrary to this advisory warning, the majority of restaurants polled- notably considered highly vulnerable soft targets by the FBI and Department of Homeland Security– provided no active shooter or workplace violence training on how to respond in the event of an incident. The common reasons given by poll participants for not implementing training of this kind included cost, the belief that their business would not be affected by an active shooter incident and the investment of time involved. Those who had conducted active shooter training with their employees cited terrorism and proactive views on risk management as primary motivators for implementing their education programs.
Foodservice and hospitality operations are frequent targets based on the inherent characteristics of the venues: large groups of people, unlocked doors and the absence of on premise security personnel – with no geographic area of the country showing immunity. And these types of attacks are occurring at an accelerated rate nationwide. It is impossible to predict the nature of the next incident- a random shooting, a planned attack against an employer, an effort to seek revenge against an individual or a terrorist incident motivated by anti-American sentiment. So businesses must ask themselves- does your staff know how to respond and what actions to take in the perilous first 5-10 minutes of an active shooter incident?
As a proactive step, businesses should implement vulnerability testing and active shooter prep and response training to prepare staff in the event of an incident. Employees are taught what to look for, establish communication channels within the business to prevent workplace violence issues and institute potentially life-saving policies and protocols to act upon in the event the unforeseen occurs. As Lance Ewing, EVP for global risk management and client services at Cotton Holdings Inc. pointed out at the at the CLM & Business Insurance Retail, Restaurant, and Hospitality Conference, “You need to know what your plan A and plan B are . . . you need to practice this with your employees,” he said. “Your best option is to run, hide, or fight . . . but the best plan is to be prepared.” (Business Insurance, 2/23/17).
Dining Alone is Popular
An analysis by OpenTable reveals that reservations for parties of one have grown nationally by 85 per cent since 2015.
OpenTable findings indicate the stigma surrounding dining solo may be starting to lift and that consumers are eager to savour special culinary experiences alone. Data shows the majority of solo dining reservations are booked for dinner (43 per cent) followed by lunch (30 per cent). Canadian solo diners also book the majority of their tables Monday to Friday (78 per cent), saving the weekends for dining with others.
“This increase in the number of reservations made for one illustrates shifting attitudes in Canadian dining culture,” said Ziv Schierau, Head of National Accounts for OpenTable Canada. “Instead of opting for takeout or room service, Canadians are embracing solo dining and the opportunity to unwind and enjoy a unique meal at their own pace.”
In celebration of solo diners and the restaurants that welcome them, OpenTable has also released the Top 25 Restaurants for Solo Dining inCanada. The list was generated based on the restaurants most booked for tables of one and the “overall” star-ratings associated with reviews submitted by verified diners. Based on this methodology, the Top 25 Restaurants for Solo Dining in Canada according to OpenTable diners are as follows (in alphabetical order):
Black Friday Forecast
The biggest shopping weekend of the year is right around the corner and 69 percent of Americans — an estimated 164 million people — are planning to shop or considering shopping during Thanksgiving weekend, according to the annual survey released today by the National Retail Federation and Prosper Insights & Analytics. For the first time in survey history, the numbers include Cyber Monday in addition to Thanksgiving Day, Black Friday, Small Business Saturday and Sunday.
“This year, we updated our survey to more accurately capture consumer behavior throughout the entire shopping weekend — Thanksgiving Day through Cyber Monday,” NRF President and CEO Matthew Shay said. “Consumers will benefit from competitive promotions both in stores and online lasting the course of the weekend, allowing them to find the best gifts at the lowest prices.”
Of those considering shopping the long holiday weekend, the survey found that 20 percent plan to shop on Thanksgiving Day (32 million) but Black Friday will remain the busiest day with 70 percent planning to shop then (115 million). A substantial 43 percent are expected to shop on Saturday (71 million), with 76 percent saying they will do so specifically to support Small Business Saturday. On Sunday, 21 percent expect to shop (35 million) and 48 percent are expected to shop on Cyber Monday (78 million).
Of those shopping, 66 percent said they’re doing so to take advantage of deals and promotions retailers will offer, while 26 percent cited the tradition of shopping over Thanksgiving weekend and 23 percent said it’s something to do over the holiday weekend. Another 23 percent said it is when they start their holiday shopping.
According to the survey, 56 percent of Americans have already started their holiday shopping, but most still have a long way to go. Only 12 percent of consumers have completed at least half of their shopping, while only 2 percent have finished all of their holiday shopping.
When asked what they enjoy the most about shopping during the holidays, 35 percent said it is a family tradition while 23 percent said they most enjoy holiday decorations and displays; 18 percent cited finding the perfect gift for someone.
“While the utility of the weekend will continue to draw shoppers into stores and online to efficiently and inexpensively check off their lists, we’re also seeing consumers report tradition and the opportunity to partake in holiday cheer as reasons for shopping, too,” Prosper Principal Analyst Pam Goodfellow said. “By now, people know what sort of deals they can expect to see during the weekend and are budgeting for them accordingly, and in many cases expertly.”
“For Gen Z, the holiday shopping weekend is a can’t-miss opportunity,” Goodfellow said. “This group overwhelmingly sees in-store shopping as a valuable way to connect with others, be it friends, family or store associates at their favorite retailers.”
While many consumers will take advantage of deals over Thanksgiving weekend, 31 percent will refrain from shopping that weekend. Of those not planning to participate, 52 percent won’t shop because they do not enjoy the experience and 51 percent say they never shop during Thanksgiving weekend. Of those not shopping, 46 percent said nothing would change their mind but 27 percent said a good sale or discount on an item they want could get them to shop.
The survey, which asked 7,439 consumers about their shopping plans, was conducted October 31-November 7 and has a margin of error of plus or minus 1.2 percentage points.
Food Traceability Market to Grow
According to a new report published by Allied Market Research, titled, “Food Traceability (Tracking Technologies) Market by Equipment, Technology, End-User and Application: Global Opportunity Analysis and Industry Forecast, 2017-2023,” the global food traceability market was valued at $10,086 million in 2016, and is projected to reach $18,528 million by 2023, growing at a CAGR of 9.1 percent from 2017 to 2023. The barcode technology held more than three-fourths of the global market in 2016.
Food traceability (tracking technologies) involves screening the movement of food & related products via their production, processing, and distribution. As food production consists of various stages, including sourcing seeds & fertilizers, farming, harvesting, processing, storage, transportation and retail sales, there are risks associated, such as contamination, making it imperative to have a food traceability system. The procedures involved during this include identification, link, records of information, collection & storage of information, and verification. The primary purpose of food tracking is food safety and prevention from food-borne diseases, thus being directly related to the health of consumers. The global food traceability (tracking technologies) market is segmented based on equipment, technology, application, end user, and geography.
Currently, the food traceability (tracking technologies) market is well established in developed countries such as the U.S., UK, Japan, Australia, and others, due to early implementation by corporate professionals and government policies supporting food traceability in these countries. Currently, food can be sourced through any part of the world, which possesses a major challenge for traceability. Emerging nations, such as India, China, Korea, and others, are in the process of adopting strict traceability systems due to increase in awareness & knowledge among the general population and improvement in lifestyle of people, thus driving rapid growth of the global traceability market in Asia-Pacific.
Competitive edge, brand loyalty, better flow of information upstream & downstream of supply chain, and legislative framework are few other drivers of the global market. The major factor that restricts this growth is additional cost associated with the entire procedure.
Corporate companies in the food market understand the importance of implementing traceability, in terms of reducing cost in recall scenarios, which is expected to improve consumer confidence and enhance the companys image. Developing nations are witnessing highest growth rates in the global food traceability market, owing to increase in health consciousness among the people and upsurge in familiarity associated with significance of effective food traceability system.
In 2016, the meat & livestock application occupied almost half of the share of the food traceability (tracking technologies) market, followed by fresh produce and seeds. However, this trend is expected to decline to some extent during the forecast period, owing to the highest growth rate of fisheries application. The main end users employing food traceability (tracking technologies) are food retailers and food manufacturers. Moreover, these segments occupied major market in 2016, and are expected to grow at lucrative CAGRs, during the forecast period. 2D & 1D scanners, tags & labels, and thermal printers are the main equipment used in the global food traceability market, which collectively occupied more than three-fourth share in 2016.
Key Findings of Food Traceability Market:
- Sensors equipment in the global food traceability (tracking technologies) market is expected to develop at the highest CAGR in terms of revenue, during the forecast period.
- Fisheries is anticipated to be the fastest growing application segment with 14.5 percent CAGR, in value terms.
- North America is expected to continue to be the dominant shareholder, with more nearly two-fifths revenue share.
- Asia-Pacific region is anticipated to grow with the highest CAGR during the forecast period.
- RFID/RTLS technology is growing at a rapid pace, with lucrative CAGR, and occupied second highest market share in 2016.
- Food manufacturers is the main end user of the global market, with second highest share and highest CAGR.
In 2016, Asia-Pacific and LAMEA collectively accounted for around two-fifths share of the global food traceability (tracking technologies) market, registering lucrative CAGRs and are expected to continue this trend. This is attributed to upsurge in population and rise in disposable income, specifically in China, India, Brazil, and other developing economies. Improving lifestyles and rising health & fitness-related concerns are main reasons for the development of the market in Asia-Pacific.
Trends in Dairy and Non-Dairy
The market for dairy and dairy alternative beverages will reach a projected $28 billion by 2021, according to market research firm Packaged Facts in the new report, Dairy and Dairy Alternative Beverage Trends in the U.S., 4th Edition. Spurring the segment’s growth will be plant-based dairy alternatives, which are expected to come to represent 40 percent of the combined total of dairy and dairy alternative beverages, up from 25 percent in 2016 when dairy alternative beverages alone accounted for barely $6 billion in retail sales.
The shift away from traditional dairy products such as cow’s milk towards plant-based alternatives revolves around health concerns with a growing number of consumers coming to believe that plant-based foods are healthier than animal-based foods. Further, there is a growing consumer base that is motivated by animal welfare concerns, leading them to choose plant-based beverages, as well as other plant-based foods over animal-based products.
“Vegetarians and vegans together account for less than 15 percent of all consumers and their numbers do not grow very rapidly, but a growing number of consumers identify themselves as flexitarian or lessitarian, meaning that they’ve cut back on their consumption of animal-based foods and beverages. It is this group that is most responsible for the significant and ongoing shift from dairy milk to plant-based milk,” says David Sprinkle, research director for Packaged Facts, which also recently established a free curated webpage on dairy and dairy alternatives.
In recent years, the plant-based dairy beverage alternatives category has seen an expansion of several nut- and legume-based milk alternatives beyond soy, rice, coconut, and almond to include varieties made from cashews, hazelnuts, macadamias, peanuts, pecans, and tiger nuts. In addition, there are non-dairy milks being offered made from bananas, cassava, oats, and potatoes, among others.
Looking ahead to 2018, Packaged Facts expects several of these new and novel non-dairy milks to find a wider audience:
Barley Milk: Pioneering a new plant-based milk alternative category is Canvas, a startup that has developed a way to convert unused barley grain leftover from the beer brewing process into a sustainable plant-based beverage—a winning idea for consumers concerned about the issues of food waste and sustainability. The line offers five flavors including original, cold brew latte, cocoa, turmeric chai, and matcha. All varieties are free from refined sugar, dairy, and artificial ingredients.
Flax Milk: The key selling point for flax milk is its high Omega-3s content. The leading brand, Good Karma, reports that it offers 1,200 mg per serving of this essential nutrient, further noting that its flax products are free of all major allergens. In addition to its various sweetened and unsweetened, flavored, and protein enhanced flax milks, Good Karma offers flax milk-based drinkable yogurts and eggnogs.
Hemp Milk: Participants in the hemp production industry have suggested that only 1 percent of the North American population has ever tried a food or beverage with the ingredient. This is a segment with the potential for rapid growth as consumers look for alternatives to the established plant-based beverage segments. Hemp is an excellent source of Omega-3 fatty acids as well as being a good source of plant-based protein, with all ten essential amino acids.
Pea Milk: While the idea of pea milk may sound quite unappetizing to many, it does have certain advantages over other dairy alternatives that may make it a hit with consumers. For example, the pea milk brand Ripple says that one serving has 8 grams of protein, the same as cows’ milk, compared to about 1 gram of protein in coconut or almond milk. And, Ripple has half the sugar of cows’ milk—something more and more consumers are sensitive to as they watch their waistlines—along with 50 percent more calcium, and vitamin D and iron. Ripple offers a pea-based half & half product as well as its pea milk line.
Quinoa Milk: This beverage formulation is reported to be high in protein, fiber, vitamins, and all nine of the essential amino acids. It also contains important minerals such as magnesium, iron, copper, manganese, zinc, and phosphorus and has a low glycemic index.