
According to a Recent Study/Survey … Mid-May 2018 Edition
19 Min Read By MRM Staff
This edition of Modern Restaurant Management (MRM) magazine’s “According to …” research roundup features exclusive research on a McDonald’s LTO from the experts at Sense360 as well as a noted increase in online reviews, top foodservice trends, popular loyalty apps, clean label lovers and the wine echo chamber.
Dramatic Increase in Online Reviews
Yet-to-be-published research from Xenial and Merchant Centric that shows a dramatic increase in the amount of online reviews for U.S. businesses. From March 2017 to 2018 company reviews online increased by a staggering 66 percent to over 610 million total reviews, according to analysis of 27 million U.S. businesses. (See graph images below).
The restaurant industry also saw a sharp increase in both guest engagement and restaurants actively engaging reviewers online. Restaurant reviews from the 10 most reviewed categories jumped from 86 million in 2017 to 141 million in 2018—a 64 percent increase year-over-year.
The data also delved into the top ten restaurant categories and their frequency of guest engagement* by category:
Most engagement
- Steakhouses
- Seafood
- American
Least engagement
- Chinese
- Pizza
- Mexican
* Guest engagement is relative to guests leaving reviews, relative to other categories, not the rate at which these businesses are responding.

Restaurants are ahead of other industries in leveraging this guest outreach. According to the data, the restaurant industry is far more proactive in responding to guests’ online reviews. From March 2017 – March 2018 alone, there was a 29 percent increase in restaurants responding to online reviews; and overall they respond to guests at a higher rate than all other business (see bottom graph below).

With so much importance being placed on how businesses engage with restaurant guests to keep them coming back and attracting new guests, both Xenial and Merchant Centric are excellent resources in providing insight as to how businesses are managing their reputation online and using guest feedback to improve experience and drive sales.
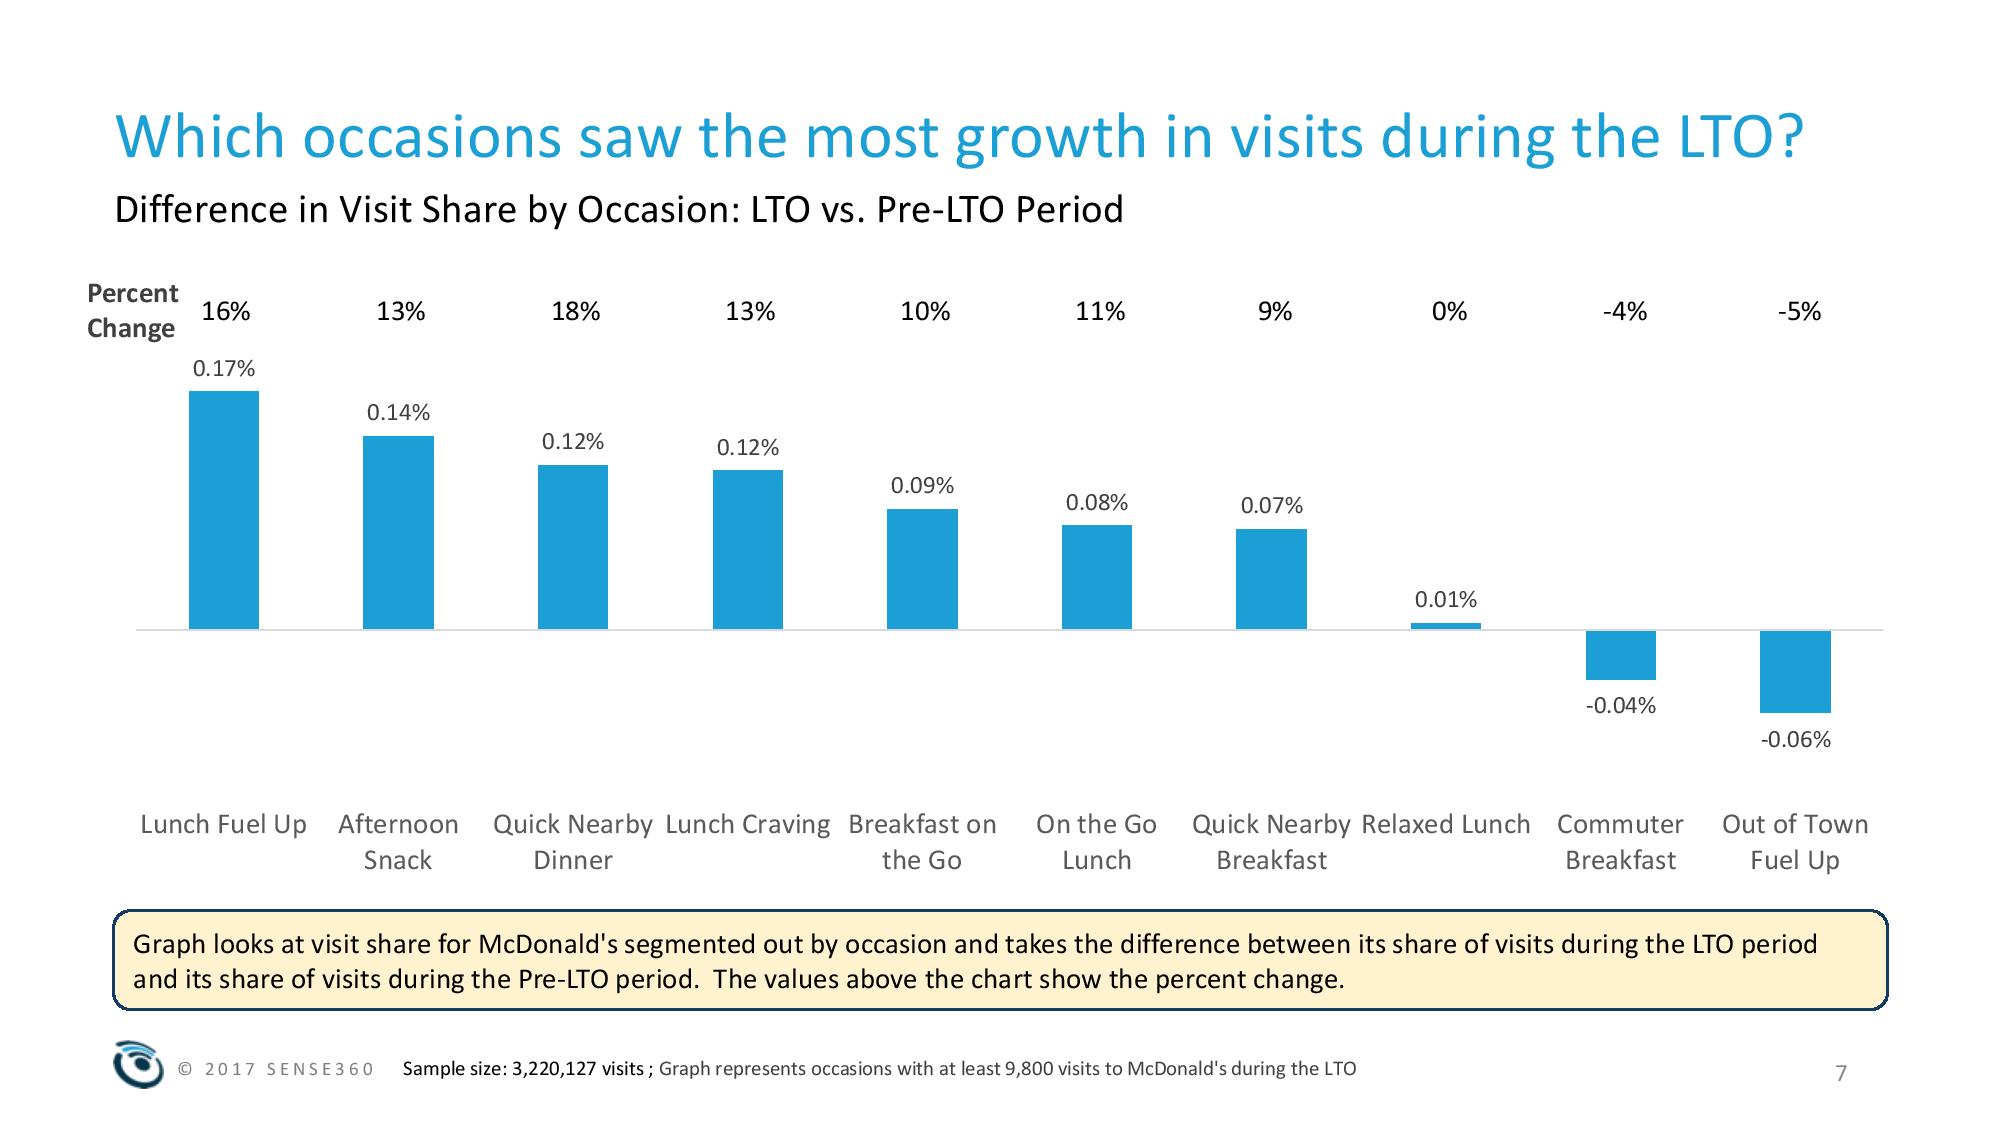
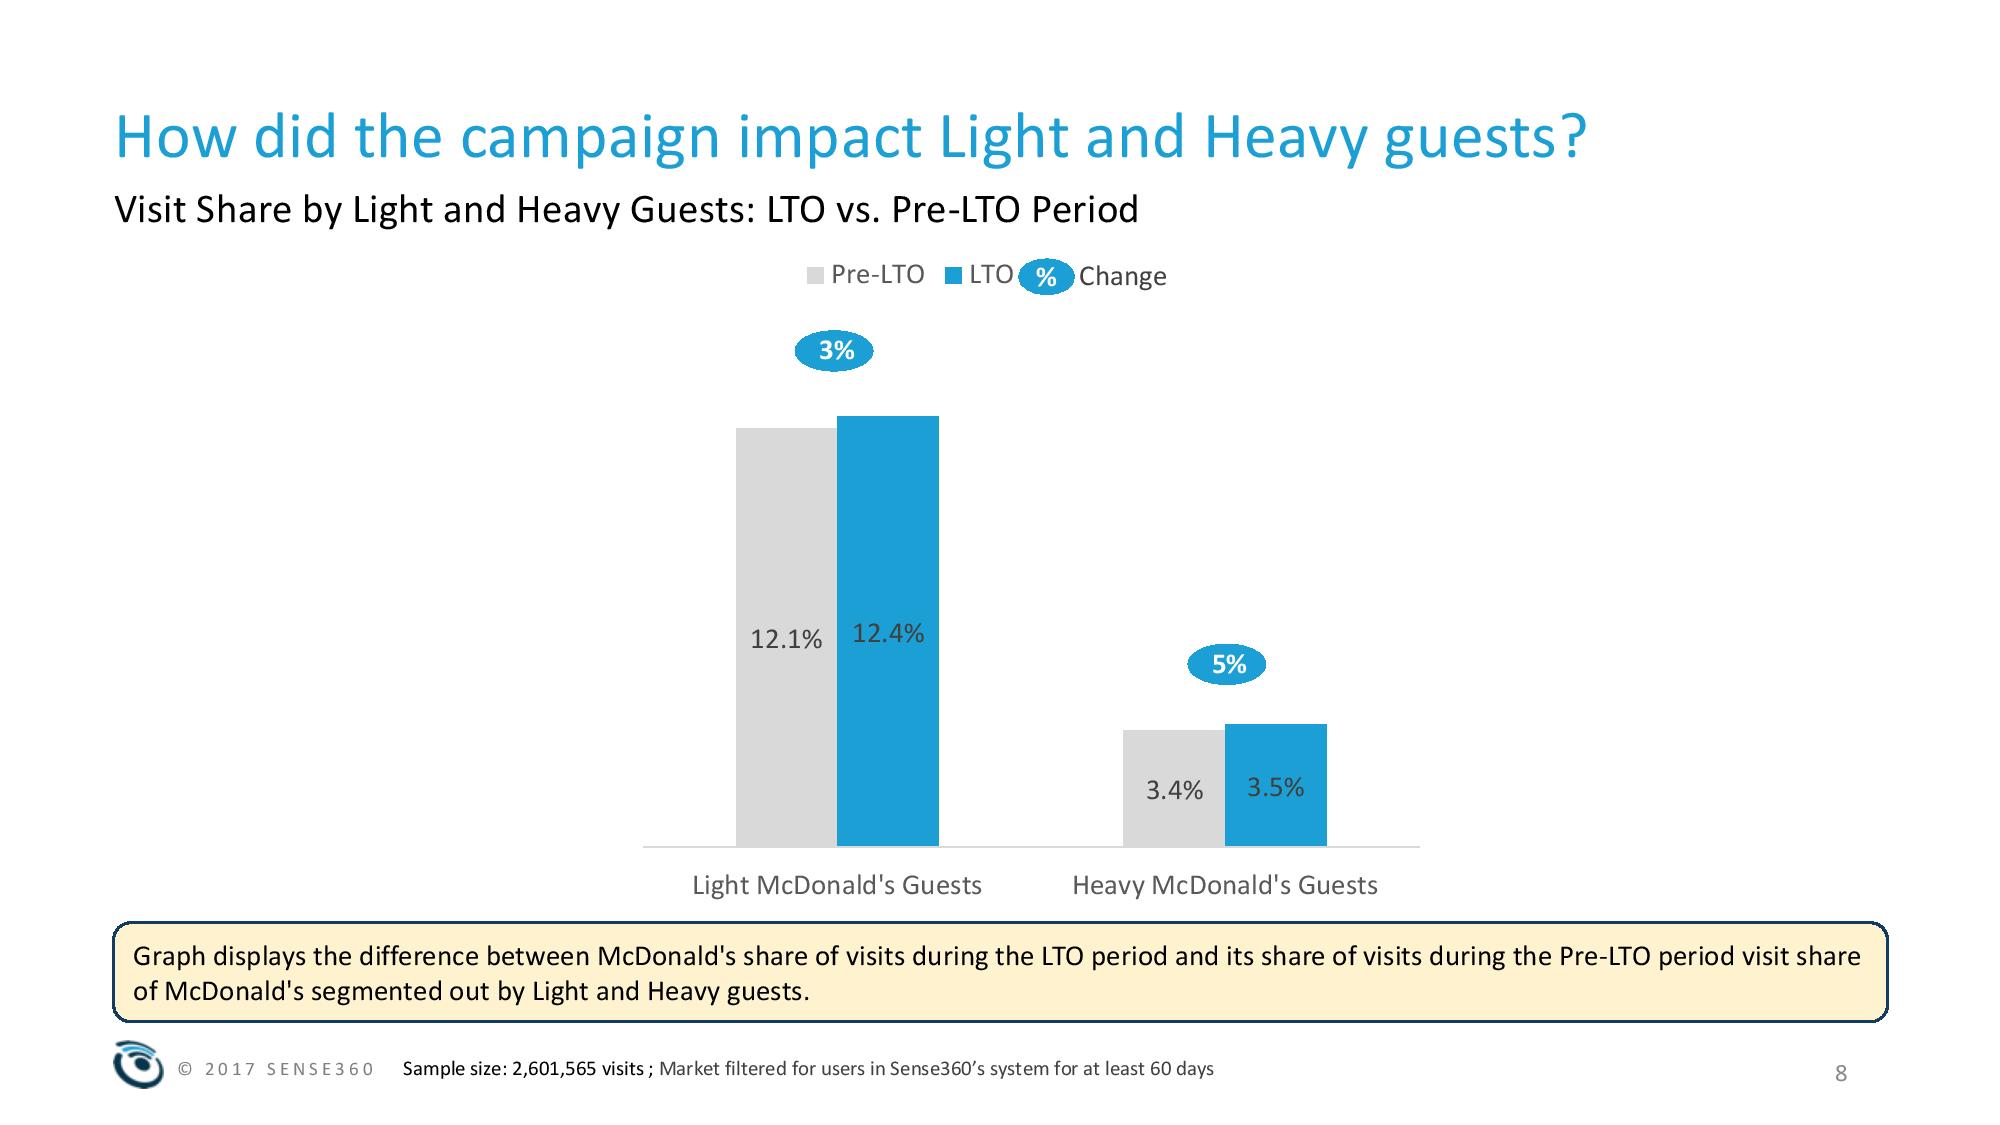
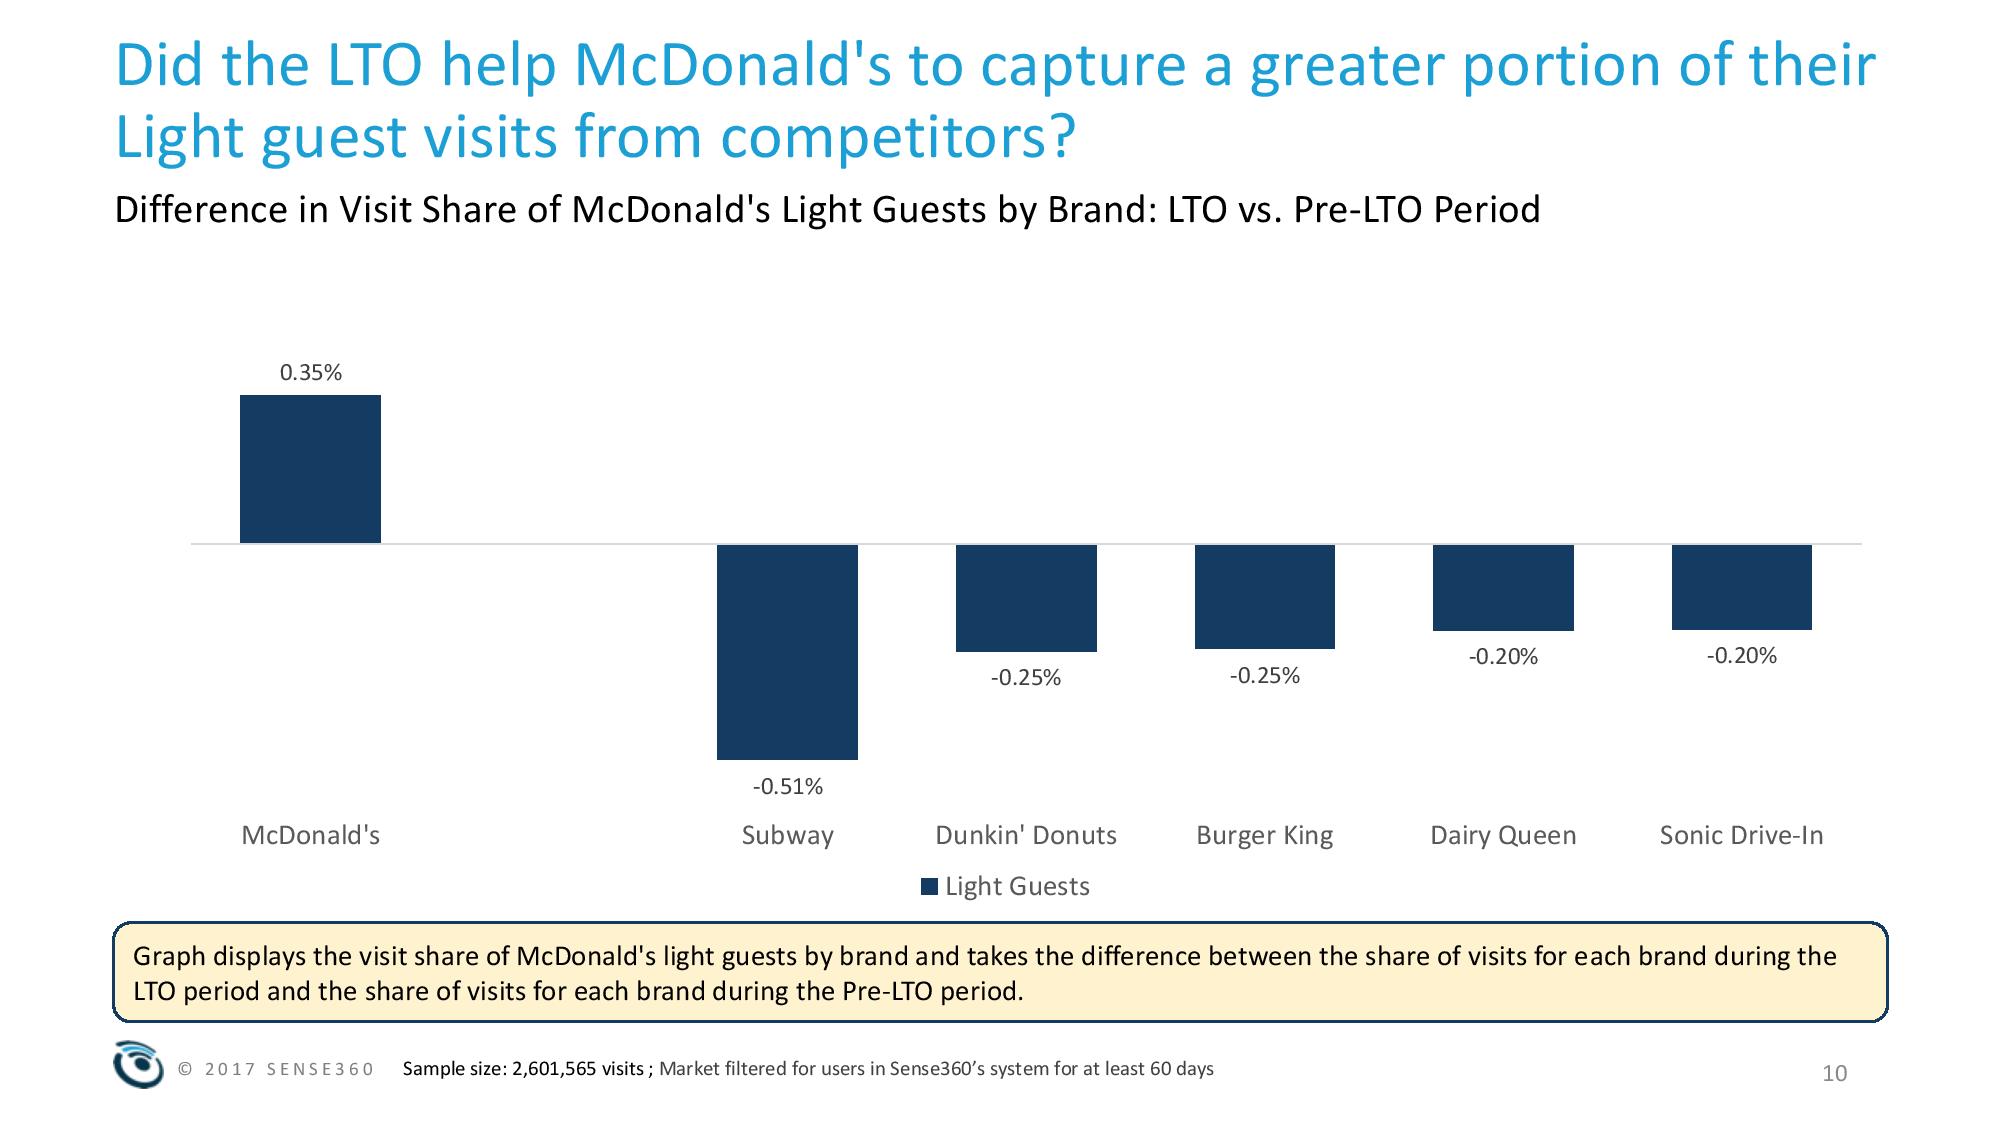
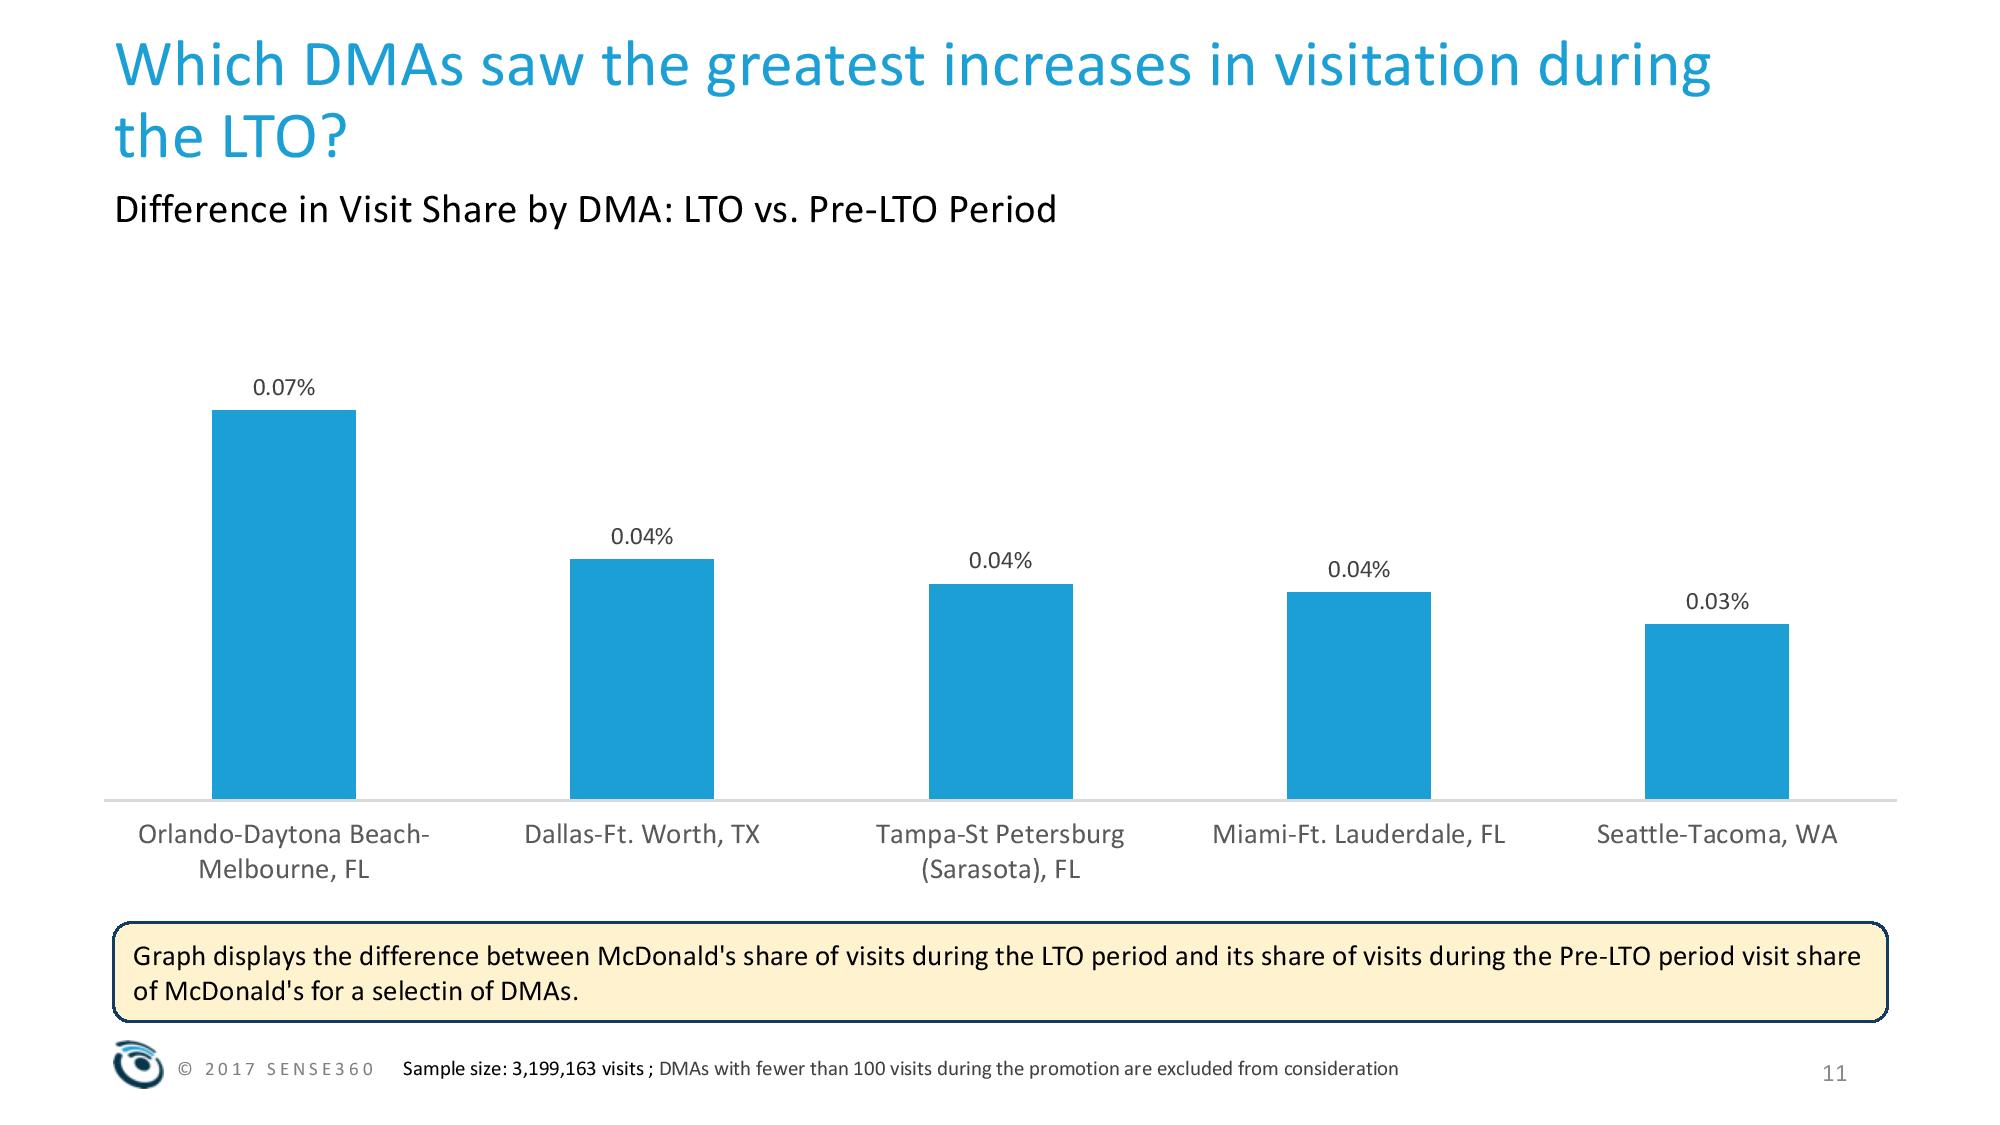
McDonald’s 2 for $4 Mix & Match Breakfast Deal
A new report from Sense360 explores the effects of McDonald’s 2 for $4 Mix & Match Breakfast Deal on visitation by observing visit patterns both before and during the campaign and highlighting the differences between the two periods. The deal includes a choice of any two breakfast sandwiches from a select menu of three items: the Sausage McMuffin with Egg, Bacon, Egg & Cheese McGriddle, and Bacon, Egg & Cheese Biscuit. We looked at visit trends for that week and compared to the same week last year.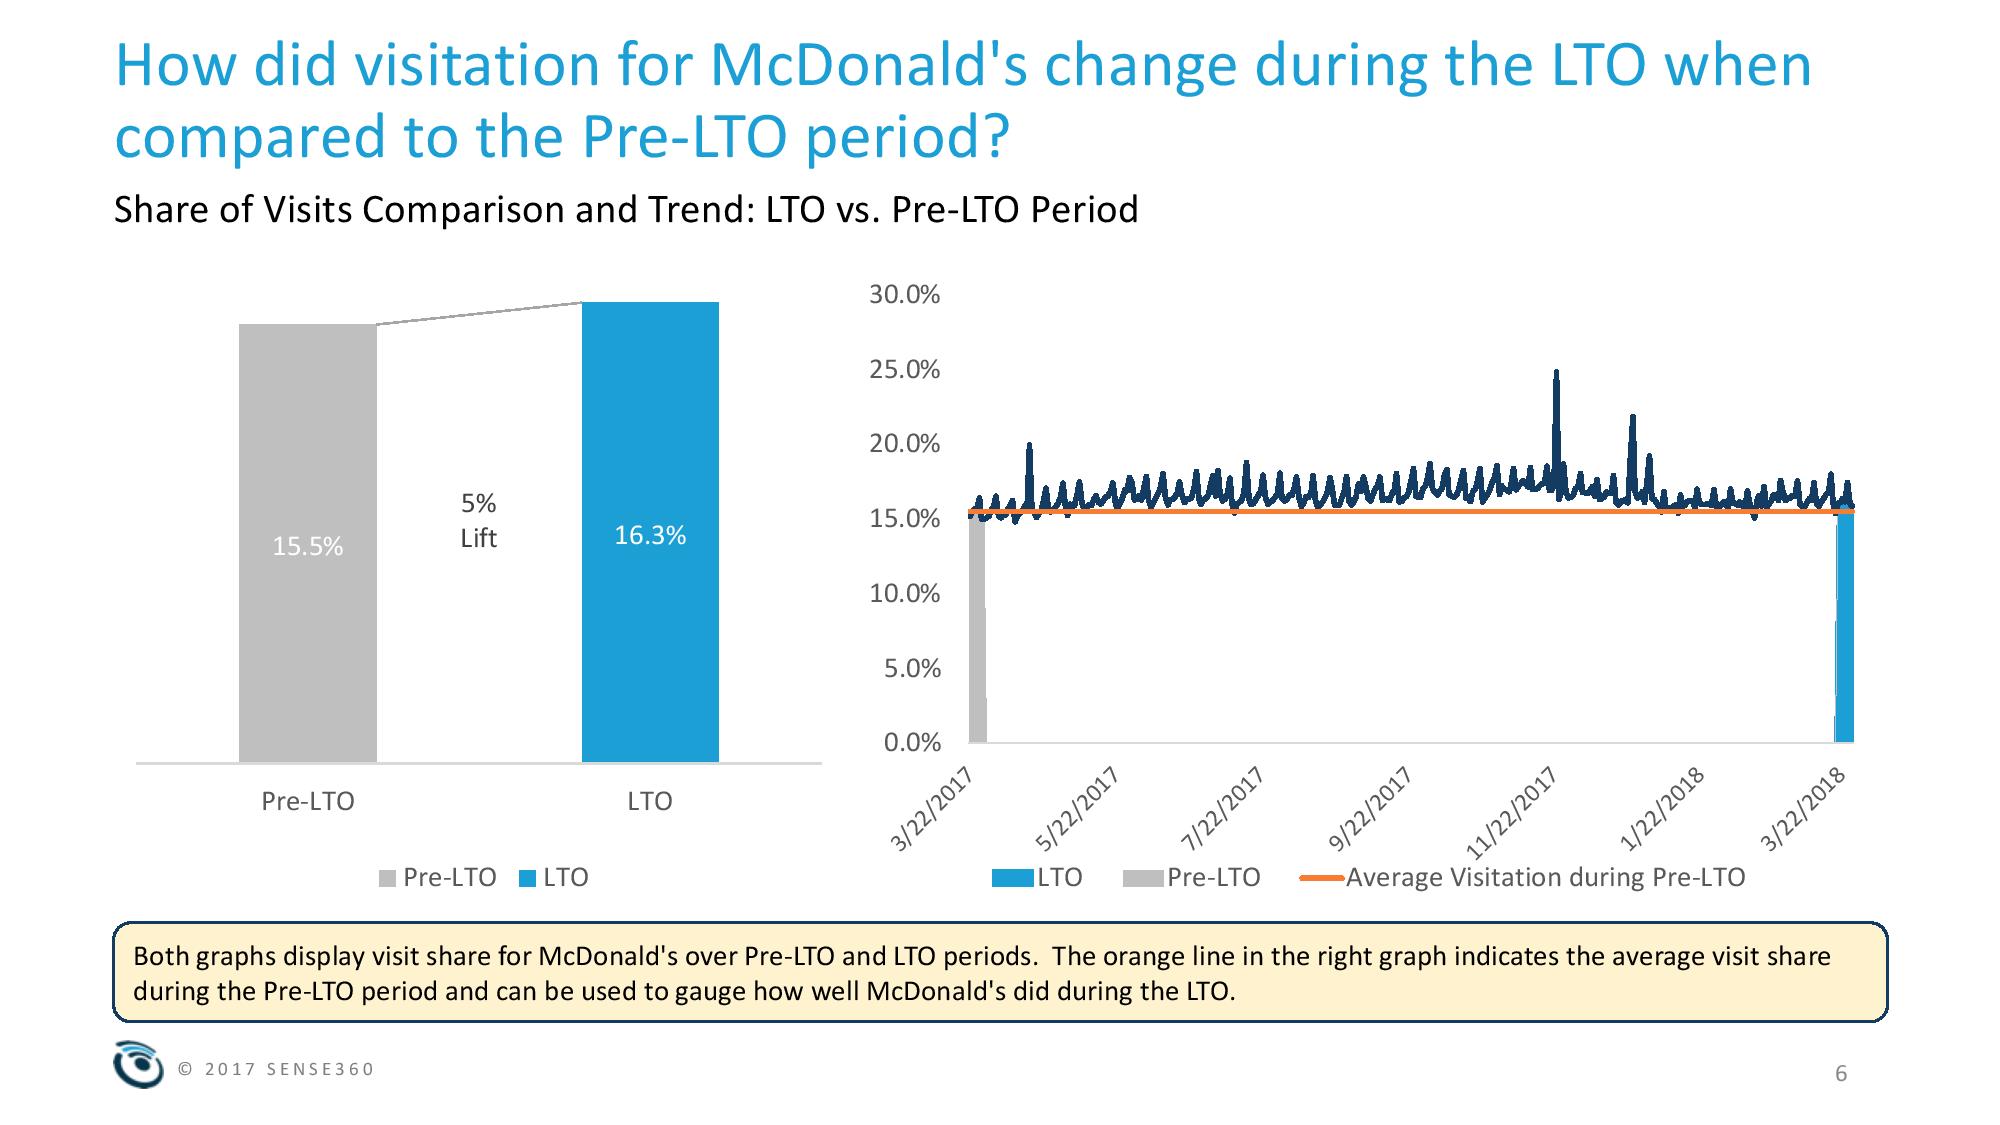

Top Five Foodservice Trends
A new report from Restaurant Technologies, which provides cooking oil management and exhaust cleaning solutions for more than 26,000 foodservice providers, shares the top five foodservice trends for 2018 that operators should have an eye on to not only survive, but thrive in today’s increasingly competitive marketplace.
The report covers:
- Technological innovations: Appliances such as smart refrigerators can detail inventory, and smart ovens can now guide staff through step-by-step dish preparation. Continued cleaning support for grill and fryer hoods/flues can also be automated and simplified with AutoMist.
- Safer work environments: According to the National Safety Council, more than 25,000 slips and falls occur every day in the foodservice industry, many of them preventable. This report shares simple tips for training and prevention guidelines to help protect the operator’s bottom line from costly claims, and to care for employees and their morale.
- Effective food waste management: As Americans push for more eco-friendly options in their everyday choices, restaurant operators would do well to reduce waste and cut overspending, says this report. According to ReFED, restaurants generate 11.4M tons of food waste, amounting to approximately $25B in wasted funds – a shocking number given how slim restaurant margins are. Digital solutions such as the app Karma allow restaurants, grocery stores and other foodservice vendors the opportunity to sell excess food at a reduced price.
- Solving space concerns: The back of house is shrinking. Restaurant Technologies shares tips to capitalize on smaller spaces such as using a combi oven, prep coolers, planetary mixers and vertical solutions.
- An emphasis on experience: With the restaurant industry becoming more and more competitive, operators are looking to experiential opportunities to bring in business. Some restaurants now have extravagant themes, while foodservice concepts within higher education and corporate settings are upping the ante hiring executive chefs, and offering more than the typical soup, salad and sandwich menu.
Starbucks’ Loyalty App Is User Favorite
Starbucks’ app is the most popular among several well-known restaurant loyalty rewards apps, a new survey finds. Nearly half (48 percent) of app users surveyed regularly use the Starbucks loyalty app, compared to 34 percent who use the Domino’s app and 30 percent who use the Pizza Hut app.
The survey of more than 500 smartphone owners indicates how customers use food delivery and restaurant loyalty apps and how restaurants can potentially increase customer engagement by delivering food through an app or launching a loyalty rewards app. 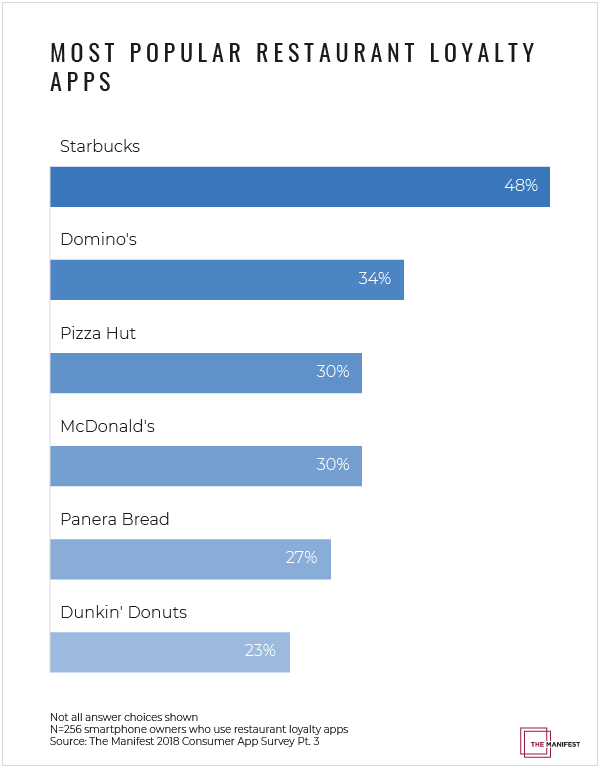
The user experience (UX) of Starbucks’ app contributes to its popularity, say experts who point out UX elements the app does well. Users must, for example, pre-load money onto the Starbucks app to pay with it. Since the money is on there and can’t be spent elsewhere, it entices users to visit Starbucks more.
“You’ve already pre-spent the money,” said Chris Hobbs, president of Two Tall Totems, a Vancouver-based mobile app and software development firm. “I think that’s what makes it so sticky.”
The Starbucks app also clearly communicates to users how they can earn rewards, and it offers real value — not only through free food and drinks, but also by offering free music, games and other goodies.
Successful Loyalty Apps Capitalize on Love of Winning
Loyalty rewards apps are popular; 50 percent of smartphone owners regularly use them and are incentivized to do so through gamification, or the idea of turning the brand’s experience into a game. When a Starbucks user earns points towards a reward with every cappuccino he or she buys they’re more likely to keep purchasing.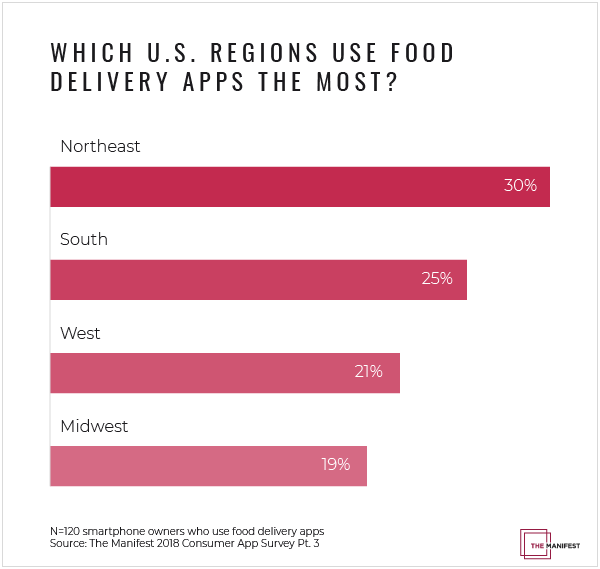
“Gamification makes users return to the app,” said Olexandr Leuschenko, head of mobile stack at Ciklum, a digital solutions company. “Gamification revolves around social actions and receiving awards — badges, likes, leaderboards, and other things that give the user a special status. People like to be the best in something almost as much as they like to get a free product.”
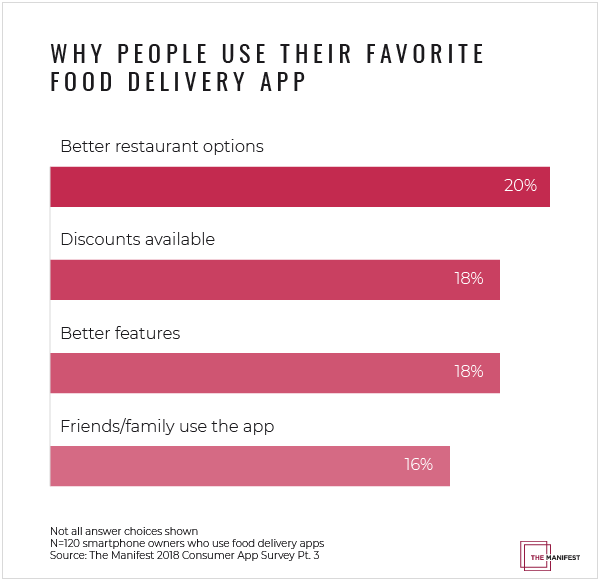
Food Delivery App Users Want Options
Food delivery apps such as Postmates and Uber Eats are also popular among app users. A significant number of food delivery app users surveyed (20 percent) say they use their preferred app because it has “better restaurant options.”
 Some food delivery apps create exclusive partnerships with popular restaurant chains. For example, DoorDash partnered with fast-food chain Wendy’s to deliver its food. Experts recommend that restaurants exploring delivery of their food through an app should ensure the apps they work with have a wide variety of restaurant options and a large user base.
The Manifest’s 2018 Consumer App Survey included 511 U.S. smartphone owners. To read the full report, click here.
State of Local Restaurants
Womply, the leader in front office software for small- and medium-sized businesses (SMBs), unveiled the State of Local Restaurants report, which charts consumer spending patterns at small, independent restaurants in all 50 states and the District of Columbia during all 365 days of the year.
The report, which is available for public use on Womply.com, reveals a wide range of trends in consumer spending at local restaurants, including how sales trend during the days of the week, months of the year, and on major holidays. The report includes a national view and localized findings for each state, powered by analysis of tens of thousands of restaurants in every corner of America during every day of the 2017 calendar year.
“One of the most difficult aspects of running a local restaurant is not knowing where you stand,” says Womply Founder Toby Scammell. “By launching the State of Local Restaurants report, we’re giving unprecedented visibility to restaurateurs so they can understand how their sales patterns and seasonality compare to national and regional baselines.”
Nationally, local restaurants see 48 transactions at $35 per ticket for average daily revenue of just over $1,700. Based on average monthly revenue, the top 10 states last year were:
- Washington, D.C., $115,000 monthly
- Hawaii, $80,000
- Florida, $71,000
- California, $71,000
- Illinois, $68,000
- Utah, $65,000
- New York, $64,000
- South Carolina, $63,000
- Nevada, $63,000
- Maryland, $63,000
The report uncovered highly consistent sales patterns for local restaurants, with very little seasonality. In general, revenue as a percentage of annual sales doesn’t change much from month to month, and the average weekend is bigger than most prominent holidays.
While no particular day accounts for more than a half-percent of annual sales, the report highlighted some surprising findings about top revenue days:
- Mother’s Day weekend rules all, with 44 percent of all restaurants reporting Mother’s Day as their top day of the year. The Saturday before Mother’s Day was the No. 2 day of the year, as well.
- Cinco de Mayo and St. Patrick’s Day rank No. 36 and No. 48, respectively, and are the top sales days among all prominent holidays behind Mother’s Day.
- Valentine’s Day, while typically associated with dining out, is not in the top 100, ranking No. 107 nationally for restaurant sales.
“The more we study sales patterns on Main Street, the more we learn that consumer spending tends to defy conventional wisdom,” Scammell says. “This kind of analysis illustrates how dangerous it is to rely on assumptions when running a thin-margin business. Our goal with the State of Local Restaurants report, as with all our data analysis efforts, is to better inform the small business owners who keep our local and national economies humming.”
Serving Up Success
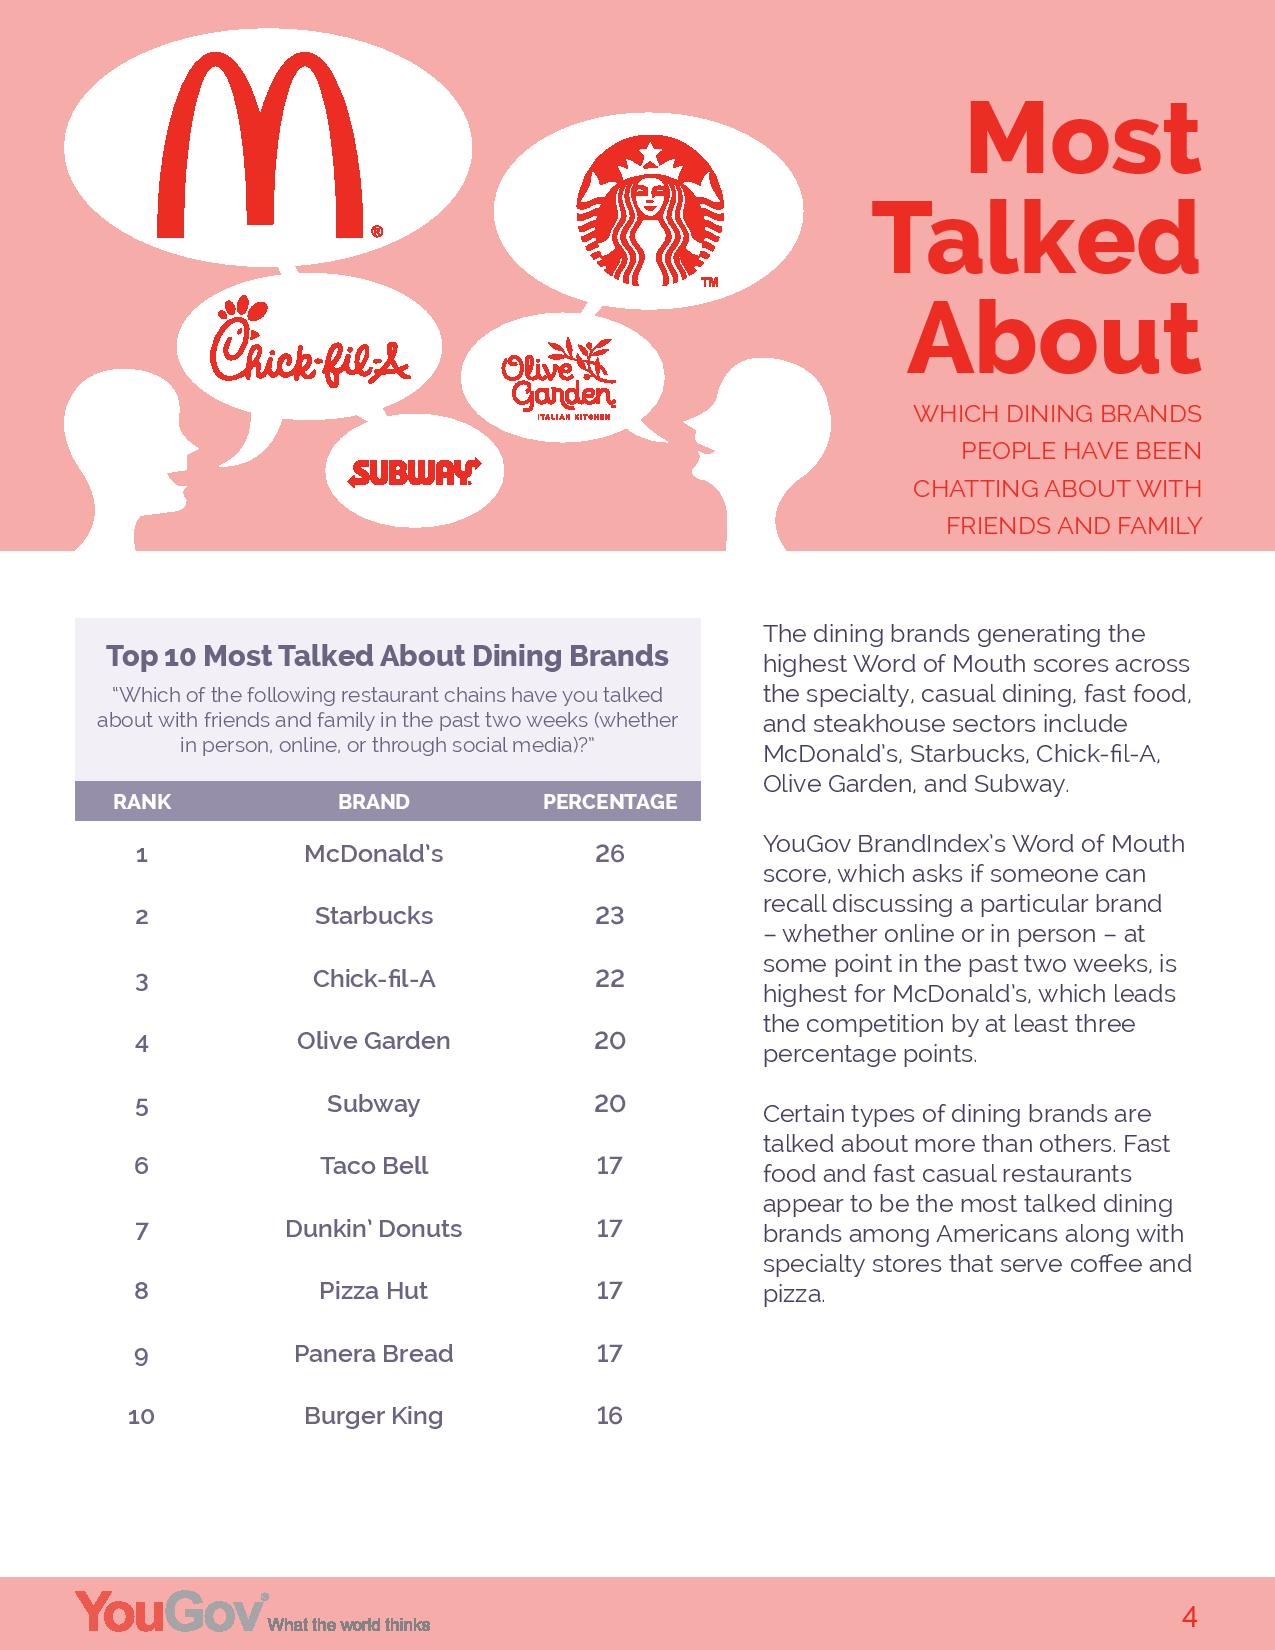
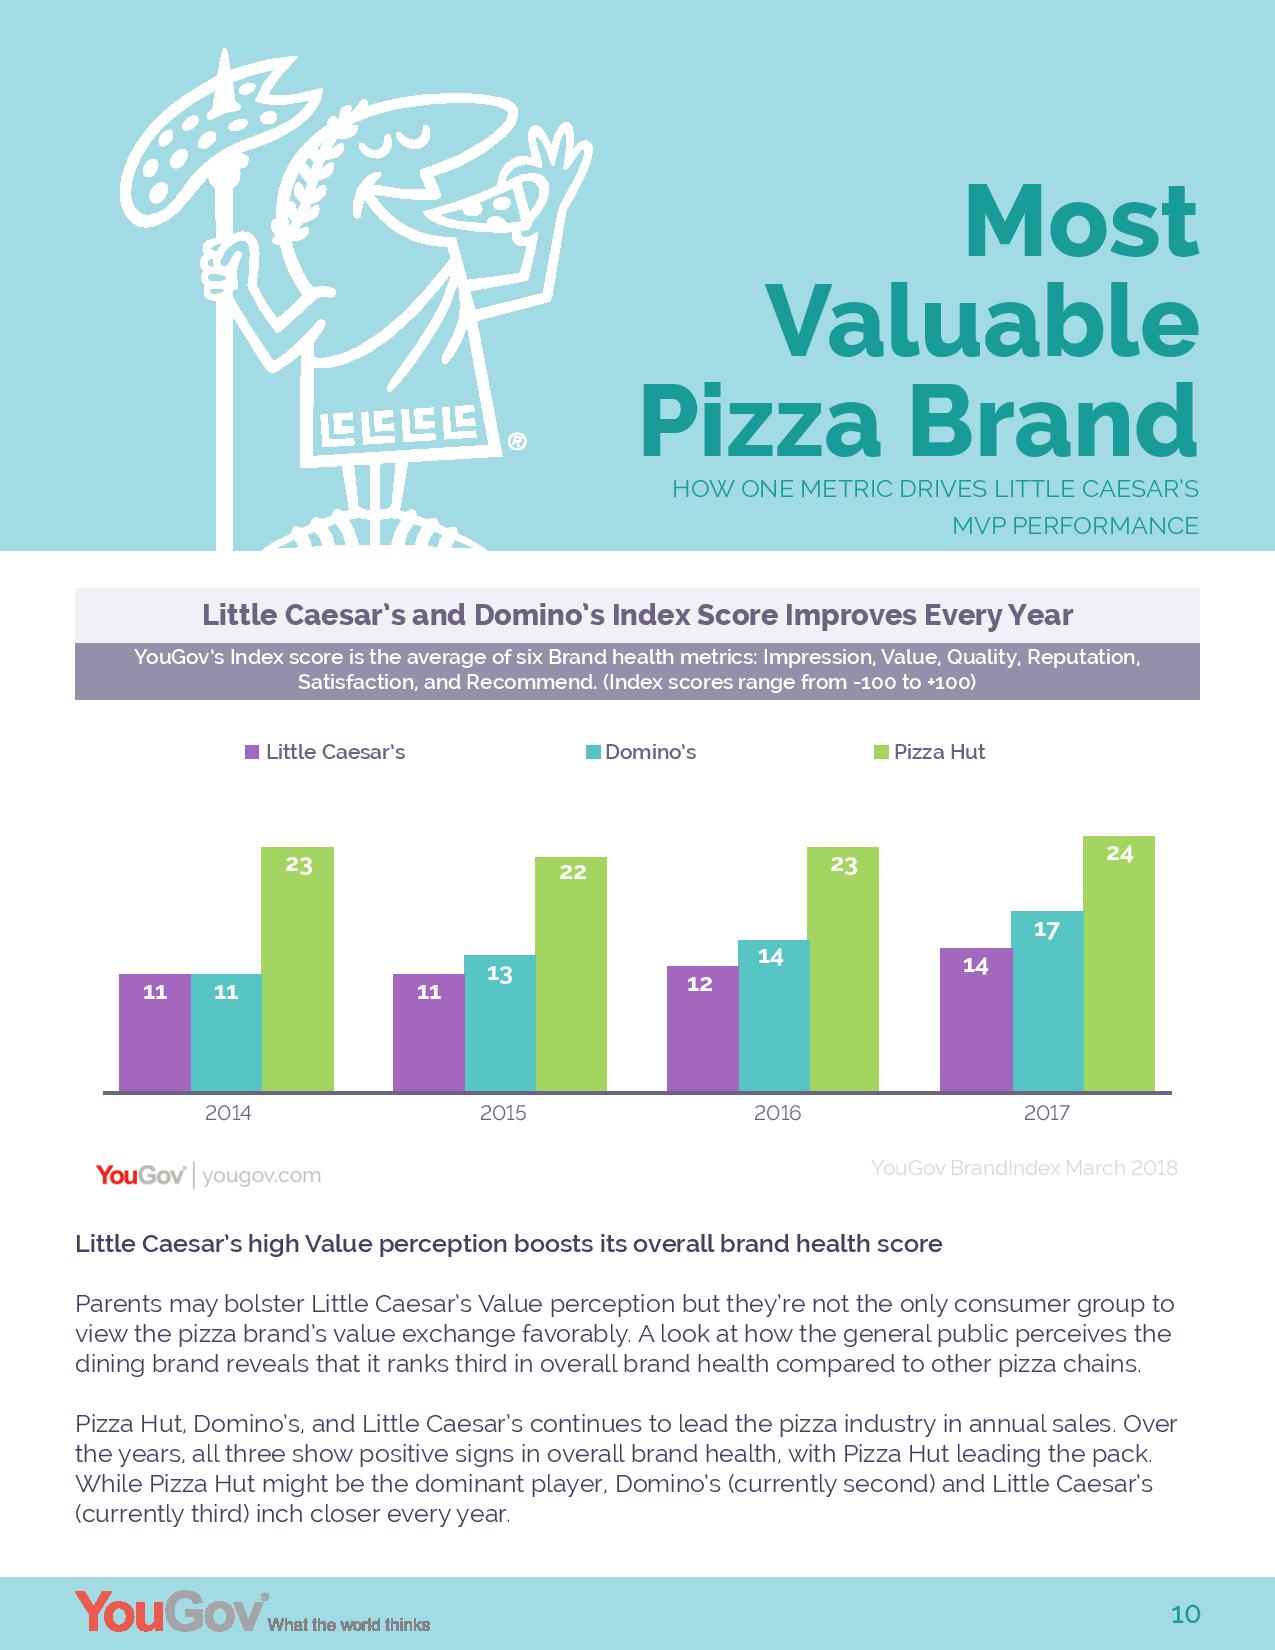
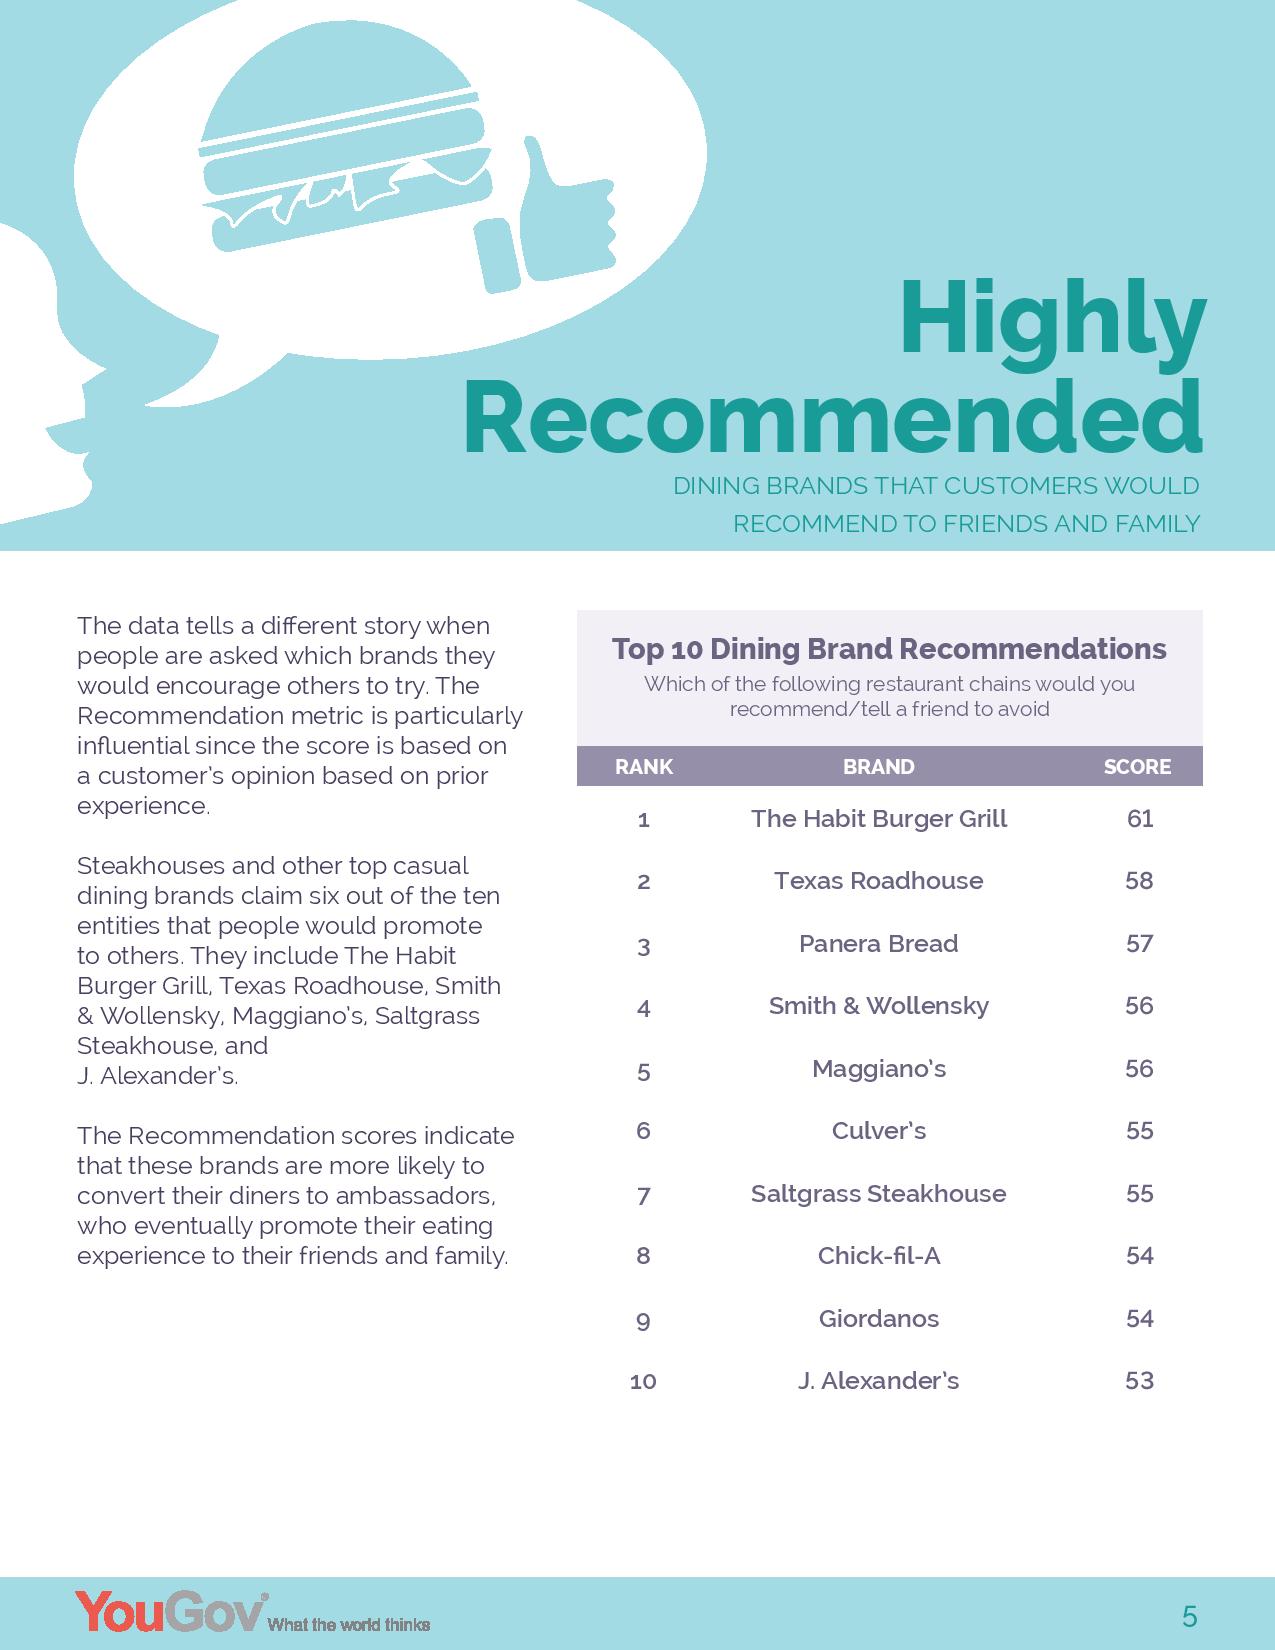
The latest report from YouGov titled “Dining Out: Who’s Serving Up Success,” is an analysis of dining brands in the U.S. and provides insights and infographics into:
- Dining brands in the fast food and steakhouse categories
- Three case studies of successful brands – Little Caesars, Chick-fil-a, and Texas Roadhouse
- Americans who eat out at least once a week for breakfast, brunch, lunch, or dinner
Here are some of the findings regarding top brands.
April Brings Good News for Restaurant Recovery
The restaurant industry produced encouraging top-line results in April. The 1.5 percent same-store sales growth is the strongest in the last 31 months. For perspective, the industry hasn’t recorded seven consecutive weeks of positive sales growth since December of 2015. These insights come fromBlack Box Intelligence™, a TDn2K™ company, data through The Restaurant Industry Snapshot™, based on weekly sales from over 30,000 restaurant units, 170+ brands and represent over $69 billion dollars in annual revenue.
“We are seeing an uptick in restaurant revenue beginning with the fourth quarter of last year,” stated Victor Fernandez, vice president of insights and knowledge for TDn2K. “Stronger economic conditions and high consumer confidence are certainly factors. However, this performance has to be considered against last year’s soft sales. A longer view suggests there are still significant challenges for the industry.”
However, with same-store sales positive over a two-year period in April, it could be an early signal that the industry is more vibrant and is showing signs of returning to consistent positive comp performance.
As for bad news, it is impossible to ignore the fact that positive sales come from increases in average check while guest counts continue to slide. Same-store traffic was down -1.4 percent in April. Even though this was the best month based on traffic in over two years, it highlights the fact that stopping the erosion in guest traffic remains the industry’s number one priority.
Restaurants Should Continue to Get Fair Share of Tax Cuts
“Though first quarter growth was somewhat disappointing, the reality is that the economy is growing solidly and should continue to do so,” explained Joel Naroff, president of Naroff Economic Advisors and TDn2K economist. “While wage increases are still not robust, they have been improving and the gains from the tax cuts will continue to trickle through to households for the rest of the year.”
“That personal income is rising modestly, rather than surging, could help the restaurant industry. Households have enough additional funds to spend on a night out, but not enough buy big-ticket items. Thus, we are seeing a slowdown in vehicle purchases while demand for soft-goods and eating out is holding up well. Restaurants should continue to get their fair share, if not more, of the tax cuts. However, the limited portion of the tax cuts going to low and middle-income households points to only a moderate rise in demand going forward.”
Check Growth Continues to Accelerate
Beginning in mid-2017 and continuing into 2018, we’ve observed an increase in average check. Year-over-year growth in average check was 3 percent or higher during the last two months compared with 2.4 percent for the last quarter of 2017.
TDn2K research has shown that top performing restaurant brands grow average checks at a higher rate than underperformers. There is evidence that top performers have established a value proposition that allows them to pass along cost increases associated with higher operating expenses, especially labor.
Opportunity Areas for Restaurants: Off-Premise and Beverage Sales
Another consistent trend is off-premise consumption outpacing dine-in sales. In April, to-go, delivery, catering and banquet sales each outperformed sales growth for dine-in sales. Across industry segments, the percentage of total restaurant sales represented by these off-premise food categories has been growing. Consumers behavior is shifting and “on-the-go” has become an extremely important component of restaurant demand.
Also noteworthy during April was the robust growth in same-store beverage sales. This month’s beverage sales growth was the highest in over 30 months. This is another important metric to follow in the near future. TDn2K studies have revealed guests of both full-service and limited service restaurants really value beverages (either alcoholic for full-service restaurants or soft drinks for limited service brands) as part of their restaurant experience. According to TDn2K’s White Box Social Intelligence data, top performing brands based on sales growth tend to have a much more positive guest sentiment based on beverages than underperforming brands.
Recovery Continues for Casual Dining and Fast Casual
Fast casual, casual dining and upscale casual were top performers in the month. Fast casual and casual dining continue to see a resurgence after years of underperformance. Both of these segments have year-to-date positive same-store sales growth and are the segments with the biggest improvement in sales growth so far in 2018 compared with the previous year.
Soaring Turnover Rates May Have Peaked
The national unemployment rate fell under 4.0 percent for the first time since 2000, reminding restaurant operators of how challenging the current environment is. But recent results published by TDn2K’s People Report™ reveal that the skyrocketing turnover rates may have reached their peak and now have started to stabilize and even drop slightly. “As with sales growth, these drops in the turnover rate have to be taken in context,” said Fernandez. “Turnover falling a few percentage points does not necessarily mean we’ve reached an inflection point. Turnover rates for both management and non-management employees are still the highest we’ve seen in well over a decade. We expect turnover rates to remain extremely high in today’s low-unemployment environment. Vacancy rates also remain historically high.”
“There is definitely a reward for getting better-staffed restaurants,” continued Fernandez. “Our data shows in the first quarter of 2018, guests’ online mentions revealed that service is a more important differentiator than food. Nowadays, consumers can get a meal from many different sources. But they are saying that service is a key driver of their experience.”
Top 250 Fast-Casual Chain Restaurants
The fast-casual segment has rebounded since 2016, but experienced a consecutive year of single-digit sales growth performance in 2017. Unit growth decreased for the third consecutive year, dropping from 9.8 percent in 2015 to 6.1 percent in 2017. These findings and more can be found in Technomic’s recently released Top 250 Fast-Casual Chain Restaurant Report, now available for purchase here.
“Although the segment shows signs of slowing, fast casual is still a bright spot in the industry,” said Dave Henkes, Technomic senior principal. “There are a lot of exciting things happening on fast-casual menus and, as the U.S. market becomes increasingly crowded, we can expect many of these brands to look internationally to further bolster their brand.”
Key themes from the report include:
- Total sales growth in 2017 was at 9 percent for the top 250 restaurant chains
- Chicken was the hot protein of 2017 and fast casuals capitalized on its popularity
- Fast-casual chains with impressive triple-digit unit growth included CoreLife Eatery and Wahlburgers
- Despite being the smallest fast-casual menu category by sales, the pizza segment continued to outshine the others, with a 27.3 percent year-over-year increase
Looking forward, expect to see fast casuals featuring a larger focus on clean-eating initiatives and planet-friendly changes to align with growing concerns among consumers. Ethnic flavors and ingredients will also thrive in the coming year with the rise of Middle Eastern concepts, touting exotic yet healthful menu items. Chains looking for more exponential growth will look to unpenetrated global markets, including Australia, Mexico, Saudi Arabia, Spain, South Korea and the United Arab Emirates.
Inside the Wine Echo Chamber
As the season of rosé draws near, a new survey* from digital wine platform CorkGuru confirms drinkers typically default to the wines and beverages they know when dining out. Sixty-seven percent avoid asking staff for recommendations for a variety of reasons, including not wanting to bother anyone and fear of looking uninformed.”
“The average mid-size restaurant could have dozens of varietals on their wine list, but only 15 percent of restaurant-goers say they look to try something new,” said Danielle Gillespie, CEO and founder of CorkGuru. “That’s a lot of wasted inventory, and a missed opportunity to deliver more exciting wine experiences to guests.
CorkGuru helps restaurants manage wine inventory, while offering pairing and exploration suggestions to diners. Gillespie, a wine lover herself, developed the platform after years of playing the wine guide to friends and family, realizing restaurants were missing out on the opportunity to connect with guests and improve their dining experience.
“You don’t have to spend a lot for a good glass of wine, but if you don’t know what to look for or are afraid to ask, you’re probably not getting the value you want,” said Gillespie.
Coupled with the use of CorkGuru, Gillespie advises diners to:
- Choose wine from largest section of the menu; it’s an indication of what the wine director cares about most.
- If something is in French/Italian, ask the server for clarification versus guessing.
- Steer clear of young big, bold and tannic red varietals. Some things are truly better with age.
- When looking for good value, avoid the second-cheapest wine in a section. Restaurants know people will choose it to avoid the cheapest option so it may be overpriced.
- Still not sure? Stick to regions known for producing quality varietals like Russian River Valley Pinot Noir, New Zealand Sauvignon Blanc, and Super-Tuscan red blends.
The CorkGuru survey also found 27 percent of diners tend to order what they recognize and trust, while only nine percent typically ask the staff for a recommendation.
“The fact people aren’t asking questions is why money is being left on the table for restaurants, and people are getting stuck with what they already know or what they had last time,” said Gillespie. “Life’s too short for boring choices!”
Clean Label Consumers
The belief that natural, organic, and humane agricultural practices produce foods that are healthier, tastier, or more nutritious is widespread among the general adult population. These convictions, especially among consumers who seek out clean label products, combined with rising concerns over food safety have caused a notable shift in behavior when purchasing foods and beverages. Market research firm Packaged Facts in the report Organic and Clean Label Food Consumer in the U.S. revealed that more than half (53 percent) of adults say they are buying more natural and organic foods than ever before, and nearly half are buying more organic foods through standard supermarkets as organic selections have expanded.
“Many consumers ascribe positive attributes to clean label foods, even if they don’t personally partake,” says David Sprinkle, research director for Packaged Facts. “The food industry has seen a rise in adults who believe that various food products that are natural, boast organic or animal-welfare credentials, or make other claims to clean label status taste better, are healthier, are more nutritious, or are better for the environment.”
In painting a picture of the archetypal clean label consumer, Packaged Facts’ research found that the organic/clean label consumer tends to be informed, curious, and engaged, as well as active in the management of his or her own health and wellness, and often highly educated and accomplished professionally. However, it is also true that there is a powerful emotional component to clean label consumerism. It’s personal. It means connecting to the community and to the world; making choices that are possibly values driven, or perhaps inspired by nostalgia for a simpler time; and advocating for the well-being of animals raised for food, of growers in developing countries, or of the planet. It can be empowering to those with this mentality, notes Sprinkle.
Further, Packaged Facts found that the demographic features disproportionately seen in organic and clean label consumers also include:
- being Millennials and younger Generation Xers
- being of Hispanic and Asian ethnicities
- residence in the Northeast and Pacific regions of the U.S.
- possession of an advanced academic degree (beyond college)
- presence of children in the household, particularly younger children
- an annual household income of $100,000 or more
Organic Eating Trends
Last month’s release of the Environmental Working Group’s report that pesticide levels in organically grown foods is equal to that of conventionally grown foods generated a lot of publicity, and raised the question of whether or not consumers of organic foods will switch to all natural or conventionally grown foods. It’s not likely, says The NPD Group, a leading global information company, since organic consumers hold a strong belief in their nutritional knowledge and healthy lifestyle and won’t let it be undermined.
Consumption of organic beverages and foods has been growing for a variety of reasons including increased availability, more affordable organic options than in the past, and a growing number of health- and nutritionally-conscious consumers. The percentage of eating occasions where foods with organic labels were consumed increased from 7.5 percent to 9.7 percent in the past three years. Over a seven day period about 10 percent of the population consumes all organic foods, 19 percent consume all natural and organic foods, 20 percent all natural only foods, and 51 percent of the population are non-users of organic and all natural foods, according to NPD’s National Eating Trends®, which continually tracks all aspects of how U.S. consumers eat.
Organic only consumers, who tend to be female, ages 35-44 and 55 to 64, live on the west coast, and have a household income of $75,000 plus, have strong convictions when it comes to their healthy lifestyle. They feel they know more about nutrition than most people and frequently check labels. The demographics of those who consume both all natural and organic foods skew towards children under the age of 6, females, ages 18-54, and Hispanics. Similar to organic only consumers, they maintain a healthy lifestyle and consider themselves knowledgeable about nutrition and the foods they eat. Although one might assume consumers of all-natural have the similar profile to organic only and those who consume both organic and all natural foods, all-natural consumers are remarkably average in their attitudes toward healthful eating and put greater importance on taste and convenience.
“Organic consumers will hold steadfast to their beliefs and continue to seek organic foods despite negative reporting, and all natural consumers will continue to place convenience and taste first,” says Darren Seifer, NPD food and beverage industry analyst. “For food manufacturers, grocers, and producers, it’s a matter of understanding the attitudes and behaviors of each group and responding to their unique needs and wants.”
Nuts are in Demand
US demand for nuts and seeds is forecast to reach $7.1 billion in 2022, according to Nuts & Seeds: United States, a report recently released by Freedonia Focus Reports. Suppliers will benefit from rising population and disposable personal incomes, and an ongoing consumer trend toward healthier snacks.
More information about the report is available here.
Almond demand in value terms is projected to represent the fastest-growing and largest product segment in 2022. In volume terms, almond sales are also projected to register the most rapid gains among discrete segments. The healthy profile of almonds will contribute to gains and their presence in various recipes and derivative products, such as almond butter, flour, and milk, will continue to support sales.
This report forecasts to 2022 US nut and seed demand in nominal US dollars valued at the prices received by US suppliers at the point of first sale (i.e., farmer or processor level) and in pounds on a shelled (i.e., without shells) basis. Total demand in nominal US dollars and pounds is segmented by product in terms of:
- cashews
- almonds
- peanuts
- pecans
- pistachios
- walnuts
- other nuts such as hazelnuts, macadamia nuts, Brazil nuts, and pine nuts
- seeds, consisting of sunflower seeds, flaxseeds, and sesame seeds
To illustrate historical trends, total demand in value and volume terms, total production in value and volume terms, the various demand segments, and prices are provided in annual series from 2007 to 2017.
Farmers Go Tech
IoT is used in agriculture to control remote instruments and sensors in order to optimize farm work. IoT solutions enable farmers to use different tools, such as smart sensors (measuring light, temperature, soil moisture, rainfall, humidity, wind speed, pest infestation, soil content or nutrients, location, etc.), applications and systems that save time, money and energy.
A study conducted by the Ag-Tech market research company, Alpha Brown, which included an extensive survey among more than 1600 farmers and ranchers in the U.S., indicates that IoT solutions are currently being used by 250000 farmers in the U.S. mainly for livestock and cereals crops(grains). The technology is also utilized on a smaller scale in other farming operations, such as dairy, vegetable, fruits and greenhouses.
Furthermore, the study reveals that more than half of U.S farmers have an interest in buying such solutions, which reflects a market potential of 1.1 million farmers and market size of $ 4 billion a year.
“We believe that in order to develop a profitable product or to make smart investments, a broad and detailed understanding of the potential customers’ (farmers) demand is needed,” said Gil Rabinovich, the CEO of Alpha-Brown. “IoT is still a developing market in the Ag-Tech world, and it is important for suppliers to fully understand the farmers’ interests and expectations of the emerging technologies. Our research indicates that the market has much room for growth and that is certainly encouraging.”
The study presents information on farmers awareness, the current market size, the market potential, and the leading companies in the market today.
Office Coffee Trends
American businesses seeking to improve productivity should consider investing more in employer provided, higher-quality coffee options, according to Office Coffee Service in the U.S.: Market Trends and Opportunities, 3rd Edition, a new report by market research firm Packaged Facts. While the average employee does not expect an employer to provide coffee that significantly outshines their usual coffee beverage purchased or made outside the office, they do expect their employer to deliver coffee and coffee drinks that can reasonably compete with it.
“Office coffee is a thriving industry that’s expected to continue to see sales growth through 2021,” says David Sprinkle, research director for Packaged Facts. “Among the market’s key growth factors is the increasing realization that companies need to provide higher-quality coffee and related benefits as part of broader employee retention and loyalty strategies that ultimately help enhance employee productivity. Not only will great coffee keep employees onsite at work, but it could also provide extra incentive to get to the office in the first place.”
For office coffee service providers, it comes down to business economics based on employer cost-benefit analysis that weighs employee time spent away to get coffee against lost productivity. The key is to show employers that investing in office coffee services will help their bottom lines. As Packaged Facts discusses in the report, when coffee successfully is integrated as a productivity tool it often translates to growing a company’s bottom line.
Packaged Facts research reveals that 68 percent of at-work coffee drinkers usually drink coffee made or dispensed onsite at their workplace. This underscores the fundamental utility to having at-work coffee options—employees do use them. Meanwhile, 51 percent usually drink coffee from outside of work (not home) and 46 percent bring it from home. Ultimately, the issue again is whether at-work coffee options can be improved and/or offered as a perk, making them more appealing to employees.
While employed coffee drinkers are more likely to be satisfied than dissatisfied with their workplace coffee options, they are not generally enthusiastic about them. Packaged Facts survey data found that given the importance they place on various coffee-related attributes, employed coffee drinkers’ satisfaction with those attributes falls short when applied to their workplace. For example:
- Coffee drinkers responded they are heavily inclined to give both coffee quality and coffee flavor high importance. However, when asked if they are satisfied with these attributes at their workplace, the response was lukewarm.
- Positive responses were likewise underwhelming in regards to employee satisfaction about the type of coffee roast (dark, light, etc.) and coffee selection/variety that employers made available to them.
Office coffee service providers can use this information to their advantage. Providing high-quality coffee that delivers on flavor via just two varieties that communicate clear distinctions that matter to the target audience could make most employees happy while keeping product assortment manageable. For example, offering a light roast and a dark roast leverages a longstanding and still important distinction that cuts across the spectrum of coffee drinkers. Integrating brand choice into this straightforward approach maintains control over product assortment while leveraging a brand’s qualities to better meet a target audience’s needs and expectations.
Dining in Decibels
The Baltimore food scene now has another factor to consider when choosing where to dine: noise level. SoundPrint, known as the “Yelp for noise,” is a New York-based mobile application that partnered with Baltimore’s Hearing and Speech Agency (HASA) to launch the app’s data collection. The partnership seeks to serve the greater Baltimore community by providing the average decibel levels of a restaurant so customers can determine the best spots for conversation. Following a soft launch, the app is officially live.
“Many people don’t have a concept of healthy noise levels,” said Greg Scott, founder SoundPrint. “This can be a problem both for conversation, and for hearing health.”
Scott was inspired to create the app after finding other consumer review sites to lack accuracy in sound readings, which made it difficult at times to hear and connect with his dates in New York.
“We are huge supporters of the Baltimore foodie scene, and want to enhance and support its growth by providing another resource for diners who may be hard of hearing, or simply want an environment that’s conducive to conversation,” said Erin Stauder, executive director of HASA. “There is a tendency for people who are hard of hearing to simply avoid going out to restaurants; we see this as a way for these individuals to still enjoy the social event of dining out, without having to worry about noise level,” she said.
The app allows customers to use a real-time sound meter to take a 15-second reading of the decibel level of a restaurant or bar. The crowdsourced readings make up a sound profile for each venue. Users can filter restaurants based on how loud or quiet they are, much like you’d use filters to search for a restaurant on Yelp.
Several hundred sound readings were taken across neighborhoods in Baltimore in April following the app’s soft launch. This data makes up Baltimore’s “Quiet List” and “Loud List,” of individual restaurants, as well as the quietest and loudest neighborhoods. These lists follow below.
To download the app, search for SoundPrint in the Apple app store. To learn more about hearing health, visit http://www.hasa.org.
The following lists were curated using several hundred SoundPrint data captures taken during peak restaurant hours, 6 p.m. – 9 p.m. Wednesday through Sunday.
The Quiet List – Quietest Restaurants in Baltimore
1. Ban Thai Restaurant (N. Charles/Mt. Vernon)
2. Dalesio’s (Little Italy)
3. Himalayan Bistro (South Baltimore)
4. Kiku Sushi (South Baltimore)
5. Da Mimmo (Little Italy)
6. Lumbini Restaurant (N. Charles/Mt. Vernon)
7. La Tavola (N. Charles/Mt. Vernon)
8. Ikaros (Greektown)
9. Charleston Restaurant (Fells Point)
10. Dooby’s (N. Charles/Mt. Vernon)
The Loud List – Loudest Restaurants in Baltimore
1. R. House (Hampden)
2. Holy Frijoles (Hampden)
3. Homeslyce (N. Charles/Mt. Vernon)
4. Rye Street Tavern (South Baltimore)
5. Mick O’Shea’s (N. Charles/Mt. Vernon)
6. Alexander’s Tavern (Fells Point)
7. Papi’s Tacos (Fells Point)
8. Clavel (Hampden)
9. The Brewer’s Art (N. Charles/Mt Vernon)
10. The Boathouse Canton Waterfront Grill (Canton)
Quietest Neighborhood for Dining in Baltimore: Little Italy (Quiet, avg. 63 dBA)
Loudest Neighborhood for Dining in Baltimore: S. Baltimore – Riverside/Fed Hill/Locust Point (Very Loud, avg. 81 dBA)
Other insights:
- Restaurants in Baltimore generally have Moderate noise-level until 8 p.m. when it transitions into Loud based on average dBA.
- Initial data indicates Baltimore may be one of the most noise-friendly restaurant cities, but more robust data is needed to verify.
Decibel Guidelines
- Quiet = 70 dBA or below (safe for hearing health, conducive to conversation)
- Moderate = 71 – 75 dBA (safe for hearing health, manageable for conversation)
- Loud = 76 – 80 dBA (likely safe for hearing health, conversation is difficult)
- Very Loud = 81+ dBA (unsafe for hearing health, conversation is very difficult)