
According to a Recent Study/Survey … Mid-March 2018 Edition
30 Min Read By MRM Staff
This edition of Modern Restaurant Management (MRM) magazine’s “According to …” research roundup offers St. Patrick’s Day and March Madness research as well as hot chili toppings, brand intimacy and gender balance in hospitality.
St Patrick’s Day: Good for Bars, Not Restaurants
Here are a few interesting data points from the experts at CAKE.
Data confirms St. Patrick’s Day is a holiday for bars, not restaurants:
Transactions
- In 2017, the average number of bar transactions was 43 percent higher on St. Patrick’s Day (March 17) compared with the Friday prior (March 10). The average number of transactions fell by 30 percent on the following Friday (March 24).
- On the other hand, restaurants saw only a 7 percent rise in number of transactions on St. Patrick’s Day (March 17), compared to the previous Friday (March 10).
Revenue
- In 2017, average bar sales saw a 33 percent increase (compared to the previous Friday) on St. Patrick’s Day and average sales jumped over $1,000.
- Restaurants experienced minimal sales increase (compared to the previous Friday) of 7 percent.
St. Patrick’s Day Sales Climb YOY:
From 2016 to 2017, Bars saw a 30 percent increase in average transactions on St. Patrick’s Day, and a 40 percent increase in average sales. Average ticket size rose by 8 percent between the two years.
Although average transactions and sales are markedly lower for restaurants on St. Patrick’s Day when compared with bars, restaurants still saw a YOY increase in both categories on the holiday. Average transactions rose by 15 percent and average sales rose by 39 percent.
As evidenced by the findings above (and not surprisingly!) the majority of customers are flocking to bars to celebrate the holiday. This presents a great opportunity for restaurant owners to offer themed food and drink specials to drum up extra business, according to Cake
All About Beer Right Now
Restaurants can expect major beer sales this month, according to Upserve’s Restaurant Sales and Turnover Forecast 2018.
This year, March Madness, St. Patrick’s Day and the weekend are colliding to create a slam dunk for beer sales:
- March Madness + St. Patrick’s Day + Weekend = the biggest beer sales of the year
- Data show last year on March 15th, beer sales hit their highest point of the year and were 23.65 percent higher than the rest of the year. This year, St. Patrick’s Day falls on a Saturday along with the second round of March Madness, so restaurants better stock up on all the beer.
- But, they are not eating as much as they are drinking:
- While beer sales went up in the U.S., they only saw a steady increase of nearly four percent for food sales
- Unless you are in the Northeast, then food sales actually went down, but beer sales still increased
Upserve’s Restaurant Sales and Turnover Forecast 2018 report has a full year of trend snapshots like this, including more info on food/beverage sales during the holidays and regional takeaways.
Top Chili Toppings
The makers of HORMEL® Chili wanted to provide fans from each region a way to celebrate and introduced the 16-Topping Chili Nation Bar – paying homage to one of the most-watched portions of the big tournament; this chili bar is sure to please fans from all over the country with specific ingredients tied to each region. A
In addition to the 16-Topping Chili Nation Bar, below are some interesting stats pertaining to HORMEL® Chili purchases during March, 2017:
March 2017 – Chili Purchasing Stats
- Last year, over 8 million pounds of HORMEL® Chili was purchased during March in America!
- The South region purchased more HORMEL® Chili than any other region – nearly 3 million total pounds to be exact
- This was over 1 million pounds more than the next highest region (The West) at 1,828,160 pounds
- The Midwest region came in third at 1,695,987 pounds
- With the East region rounding out the list at 1,591,754 pounds
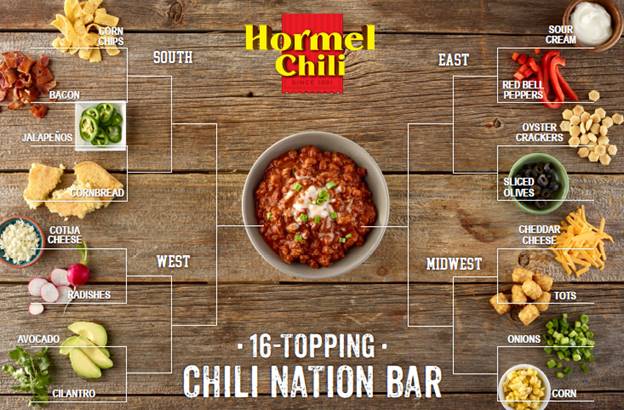
South
- Corn Chips
- Bacon
- Jalapeños
- Cornbread
West
- Cotija cheese
- Radishes
- Avocado
- Cilantro
East
- Sour Cream
- Red Bell Peppers
- Oyster Crackers
- Sliced Olives
Midwest
- Cheddar Cheese
- Tots
- Onions
- Corn
Tough February for Restaurants
Restaurant same-store sales growth saw another disappointing month in February. The last two months have reversed the positive momentum we experienced in the fourth quarter of 2017 and have revived concerns that the industry may not yet be positioned for sustained growth. Same-store sales dipped -0.8 percent in February, a 0.5 percentage point decline from January and the weakest month since September of last year. These insights come from TDn2K™ data through The Restaurant Industry Snapshot™, based on weekly sales from over 30,000 restaurant units, 170+ brands and represent over $68 billion dollars in annual revenue.
Same-store traffic declined -3.1 percent in February; the worst month since September 2017. Although traffic growth dropped by only 0.1 percentage point compared to January, the negative effect on sales was amplified by a significant slowdown in the growth of guest checks. On average, consumers spent 2.4 percent more than they did a year ago in February. By contrast, the year-over-year growth in average spending was 3.0 percent in January.
“However, the trend that continues,” explained Victor Fernandez, executive director of insights and knowledge at TDn2K, “is higher guest check growth compared with the first three quarters of 2017. Since the beginning of Q4 2017, all months except December have posted year-over-year check growth of at least 2.4 percent. The average for the first nine months of 2017 was only 2.0 percent. Furthermore, the latest TDn2K research indicates that restaurant brands with sustained top sales growth over the last two years have been successful at increasing their average guest checks even more.”
Too Early to Call It a Downturn
There is some concern about restaurant industry performance so far in 2018. The fact that prior year sales were very weak (-3.7 percent) makes the February 2018 results even more disappointing. Taking a longer view, sales last month were 4.5 percent lower than they were two years ago in February of 2016.
“It’s probably too soon to determine if this is an aberration or the start of a new trend,” continued Fernandez. “We had several external factors in February that cloud our view into the underlying performance. There were weather events that included winter storms as well as record rainfall in some areas. The Winter Olympics captured the attention of almost 20 million Americans nightly for two weeks. Plus, Valentine’s Day fell on Ash Wednesday, a time when many people were involved with church activities. Each of these events impacted sales to some degree. We’ll watch results carefully over the next few weeks to evaluate restaurant trends in a more normalized environment.”
Increased Consumer Spending Expected
“While job gains have remained solid, the economy has yet to accelerate as much as we hoped for when the tax cuts were passed,” said Joel Naroff, president of Naroff Economic Advisors and TDn2K economist. “It may be early, especially since income growth was robust in January. But that has not yet translated into strong retail spending.
“Consumer confidence remains solid, but the chaos in Washington has created massive volatility in the equity markets that could be weighing on consumers. Nevertheless, with wage pressures rising from the strong demand for workers, look for consumer spending to improve. We may not see a sudden surge, as it takes time for the tax cuts and wage increases to translate into improved demand, but the acceleration should become clear by the end of spring or early summer. Growth in the three percent range for this year is still likely and that means most sectors, including restaurants, should be in for better sales going forward.”
Fast Casual Climbed to The Top, Fine Dining Underperforms
February results were soft across the industry and all segments reported negative sales. Fast casual was the top performing segment in February, a welcomed improvement in its relative sales performance. Although fast casual continues to gain market share through new unit openings, it hadn’t been the top performing segment in comp sales since the beginning of 2015.
Fine dining, which led the industry in comp sales for 2017, experienced a dramatic downturn in February, posting its third-worst month in three years. The external factors noted earlier could have been particularly troublesome for this segment.
Counter Service Brands Continue to Capture Consumer Spending
Chain restaurants may have a same-store sales problem, but total sales continue to grow as the industry keeps generating net growth in its number of locations. According to TDn2K’s Market Share Report, which includes data representing over 125,000 individual restaurant locations, chain restaurants grew total sales by 2.9 percent in 2017.
As total sales continue to grow, so does the share of those sales that flow to counter service brands. Quick service and fast casual sales account for 72 cents of every dollar that was spent on chain restaurants during the fourth quarter of 2017. Especially telling in the data is the fact that for years consumers have been slowly shifting their spending to these segments, signaling the increasing appeal of chain restaurant brands for value, convenience and off-premise based dining (over half of counter service sales are for food not consumed at the restaurant).
Top Performing Restaurant Brands Better at Containing Employee Turnover
Employee turnover throughout all levels of restaurant operations, from front-line hourly employees to restaurant managers, have climbed to historically high levels and show no signs of easing. In January, TDn2K’s People Report™ data recorded another increase in the 12-month rolling turnover rate for hourly employees as well as the rate for all levels of management.
Data also shows that the turnover challenges are worse for back-of-house hourly positions than for their front-of-house counterparts. As restaurants compete for kitchen talent they will have to look to their compensation plans as part of the strategy. Restaurant companies reported the number one reason back-of-house employees leave is for higher compensation.
Even if the tightening labor market affects all restaurant companies, top performing companies seem to be more focused on strategies to retain their employees and have been more successful in maintaining lower turnover rates. TDn2K analysis indicates that top-performing companies have experienced a drop in their management turnover rates. Not surprisingly, management turnover for brands in the group with the weakest sales performance has increased by about 10 percentage points during that same period.
Optimism Remains
While restaurant sales were disappointing during February, external factors may be responsible for some of the sales downturn. These factors include bad weather and the winter Olympics, which kept people at home watching television. Likewise, Valentine’s Day fell right in the middle of the week on Ash Wednesday.
Therefore, without these external factors, optimism for continued restaurant sales recovery remains. Restaurant guests seem to agree with this optimistic outlook based on their latest online postings. According to TDn2K’s White Box Social Intelligence, the net sentiment score for intent to return improved by 13.9 percentage points compared to a year ago. At the brand level, TDn2K research has continuously shown that guests’ intent to return sentiment is the most predictive of restaurant sales and traffic performance. Hopefully, this improved sentiment will translate into improved results for the industry as well.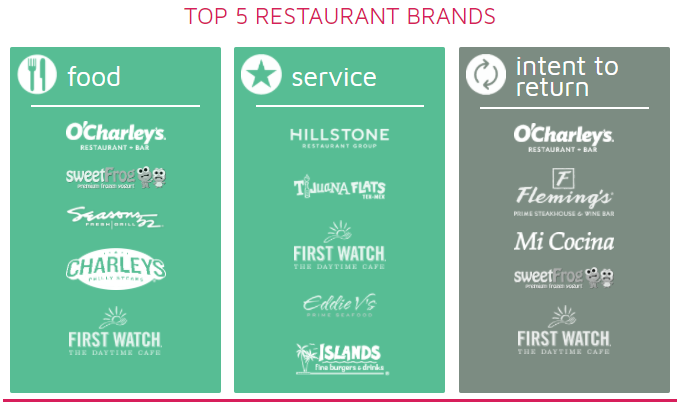
In the past year, guests have become less positive about food yet more positive about service in restaurants. This once again highlights the importance of service to the restaurant success equation. Even though consumers’ satisfaction with food is dropping, the fact that they are more satisfied with the service seems to be what is driving their improved intent to return to those restaurant brands they visit.
Since the recession, the biggest problem plaguing chain restaurants has been falling guest counts year over year. Restaurant operators frequently mention traffic as their number one challenge in 2018.
However, there are huge gaps in traffic growth performance between top performing and bottom performing brands. TDn2K’s focus has been identifying top performance and the characteristics that these top performers have in common. During Q4 of 2017, counter service (quick service and fast casual) restaurant brands among the top 25 percent of sales growth performance reported same-store traffic growth rates that were on average 8 percentage points higher than those brands in the lowest 25 percent of sales growth performance.
This highlights two points. First, it shows how dramatic the gap is for traffic performance from top to bottom. There are brands that have been holding on to and even growing their guest counts year over year.
The second point is how guest sentiment online is indicative of performance. According to White Box Social Intelligence data, counter service brands in that top performing group based on sales growth had 14.4 percentage points higher average net sentiment score for intent to return than the worst selling brands.
But, it is more than just talk. Data shows that sales and traffic results tend to be much better for those restaurant brands that have high intent to return net sentiment scores.
During February, Orlando had the highest net sentiment for the food and value attributes. Guests in Los Angeles were the most positive about restaurant ambiance and beverages. Meanwhile, Houston achieved the highest scores for intent to return. What do these three markets have in common? From the group of 25 largest DMAs in the country, Orlando, Los Angeles and Houston are all among the top six markets based on same-store traffic growth over the last three months. During February, guests expressed greater satisfaction in those markets that performed better in terms of growing guest counts year over year.
The exception during February was Denver. Even though this market is performing near the top based on traffic growth, consumers aren’t as satisfied with their restaurant experiences. This market ranked last in net sentiment for service and intent to return, which could forebode tougher times ahead for chain restaurants in Denver.
For more than a year, restaurant guests in the Mountain Plains region have consistently proven to be the most positive when discussing their restaurant experiences online. February once again saw them being among the most positive.
However, restaurant guests in the Southeast took the prize for highest positive sentiment based on their restaurant interactions during the month. In fact, the Southeast was the only region where over 40 percent of online restaurant mentions were positive. This is quite an improvement for this region. Only four months ago, it ranked among the three regions with the lowest positive restaurant sentiment.
Restaurant guests in the New England and New York-New Jersey regions were the least positive about their restaurant experiences in February, continuing a long-time trend. These were the only two regions of the country during February in which less than 30 percent of online restaurant comments were positive.
The Restaurant Guest Satisfaction Snapshot is produced by White Box Social Intelligence™, a TDn2K company™. WBSI is tracking over 550 brands to benchmark customer satisfaction and is the only online tool that integrates with operational performance data to validate the impact on financial performance. The algorithm determining ranking brands is based on sentiment and determined by White Box Social Intelligence. Brands included in this monthly snapshot must have a total of at least 250 mentions for the month. Restaurants must have a minimum number of units to be eligible as well. DMA rankings consider only the largest 25 areas.
*Net sentiment is defined as the percentage of positive guest mentions minus the percentage of negative guest mentions. In this case, it refers to mentions related to the guest’s intent to return.
Restaur.ant Management Salary Survey Report
Gecko Hospitality, has released its 2017 Restaurant Management Salary Survey Report. The report reveals that across nearly all hospitality categories and levels, the gender pay gap is still prevalent, with bonuses and starting pay for men considerably higher than women. Spanning numerous segments and job titles in the industry, the survey results shed light on the compensation inconsistencies hospitality workers are facing nationwide.
Nearly all hospitality categories and levels, the gender pay gap is still prevalent, with bonuses and starting pay for men considerably higher than women.
Gecko Hospitality’s annual report is widely considered to be the industry benchmark for job titles, salaries, gender comparisons, location, turnover, and pay increases. This year’s report includes trends and conclusions based on survey data from 2,089 restaurant management professionals, collected by Gecko Hospitality between January and December 2017.
“We strive to provide mutually beneficial and the most up-to-date information from our annual survey to our candidates and clientele,” Said Gecko Hospitality President, Robert Krzak. “This year’s data clearly shows that the pay discrepancy between men and women is still a prevalent issue within the industry. By using our survey results, employers can develop acquisition and retention strategies that attract top talent, while maintaining employee satisfaction.”
Covering quick service restaurants (QSR), fast casual, family dining, casual, upscale casual, and upscale establishments, this year’s report includes some interesting data and trends:
- Average starting salaries for men are higher than those for women in all measured categories except one: District/Multi-unit Manager.
- Across all positions, men made an average of $4,728 per year more than women.
- In hourly positions, women make an average of $0.76 less per hour than men.
- The positions of executive chef, sous chef, kitchen manager and general manager are dominated by men, while women make up the majority of catering, sales and event manager positions.
- Of managers who accepted a management position with a new company, 37 percent of women received a salary increase vs. 31 percent of men, emphasizing the rush to hire female talent.
The data and statistics from the Restaurant Management Salary Survey Report are used by both restaurant organizations and restaurant-management professionals to learn where they stand with compensation, relative to the U.S. marketplace average. This helps with the planning and positioning of their recruitment efforts and growth strategies.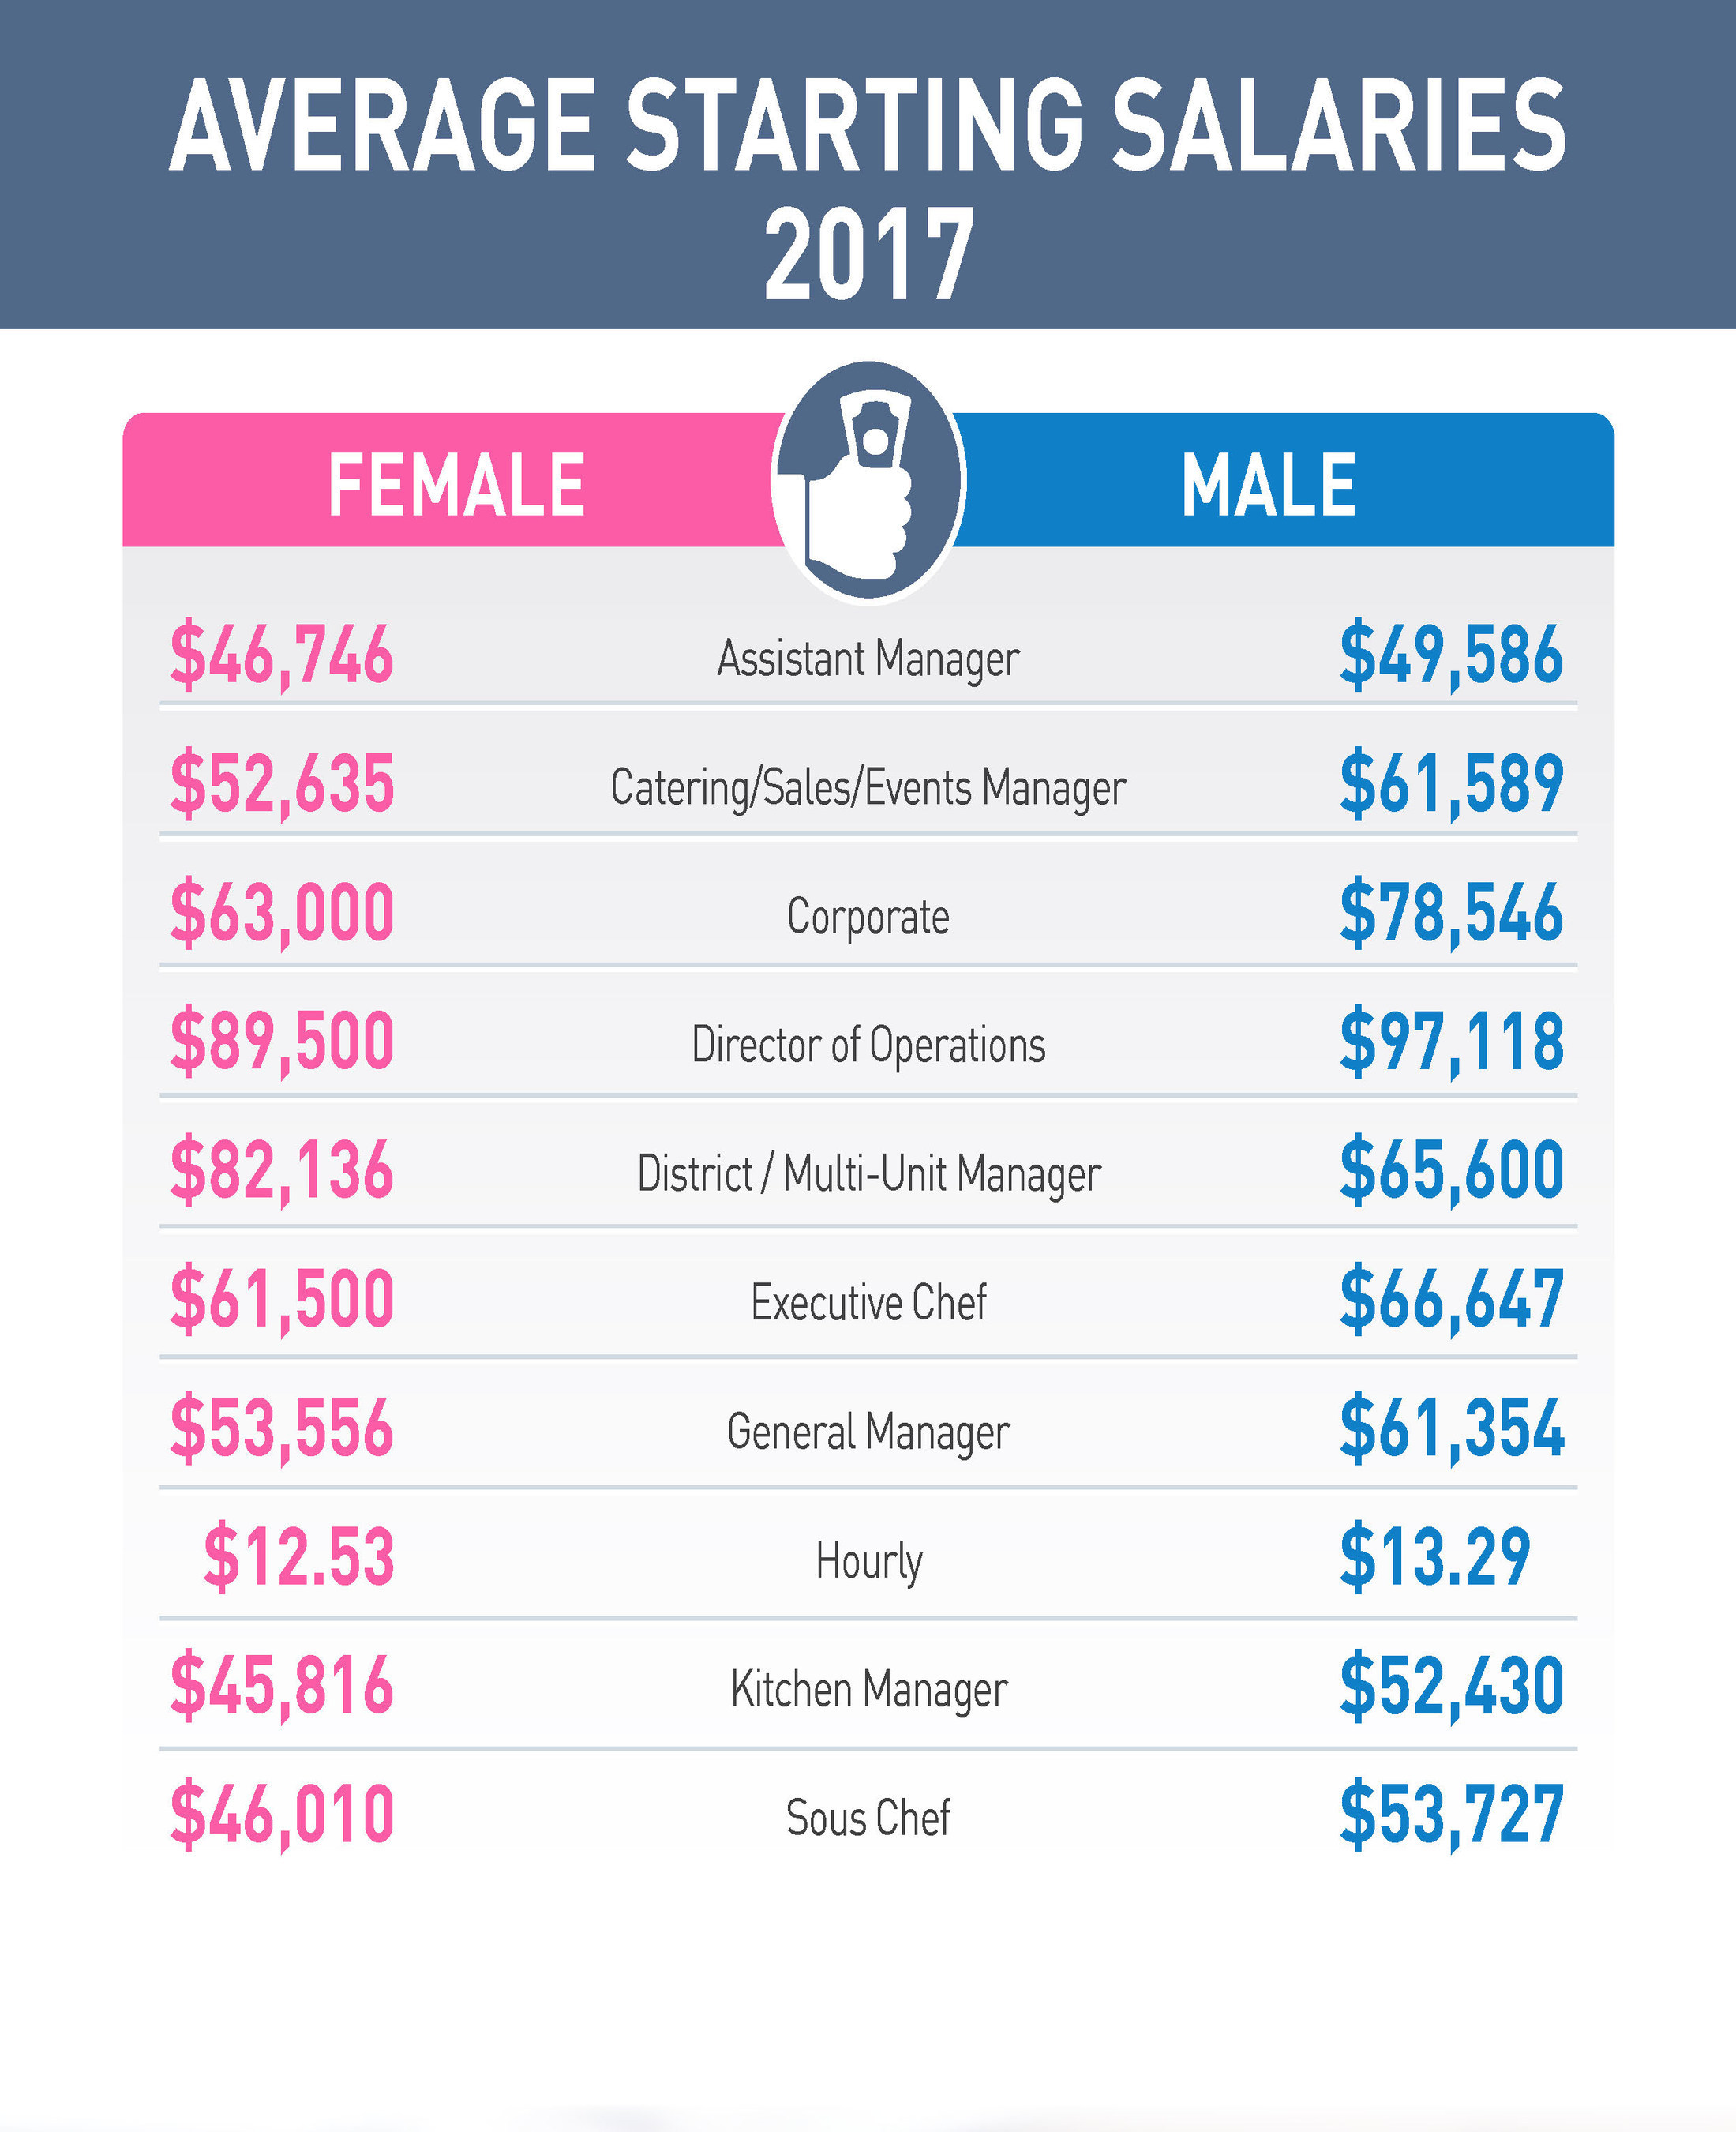
The full report is available here.
Sodexo’s Gender Balance Study
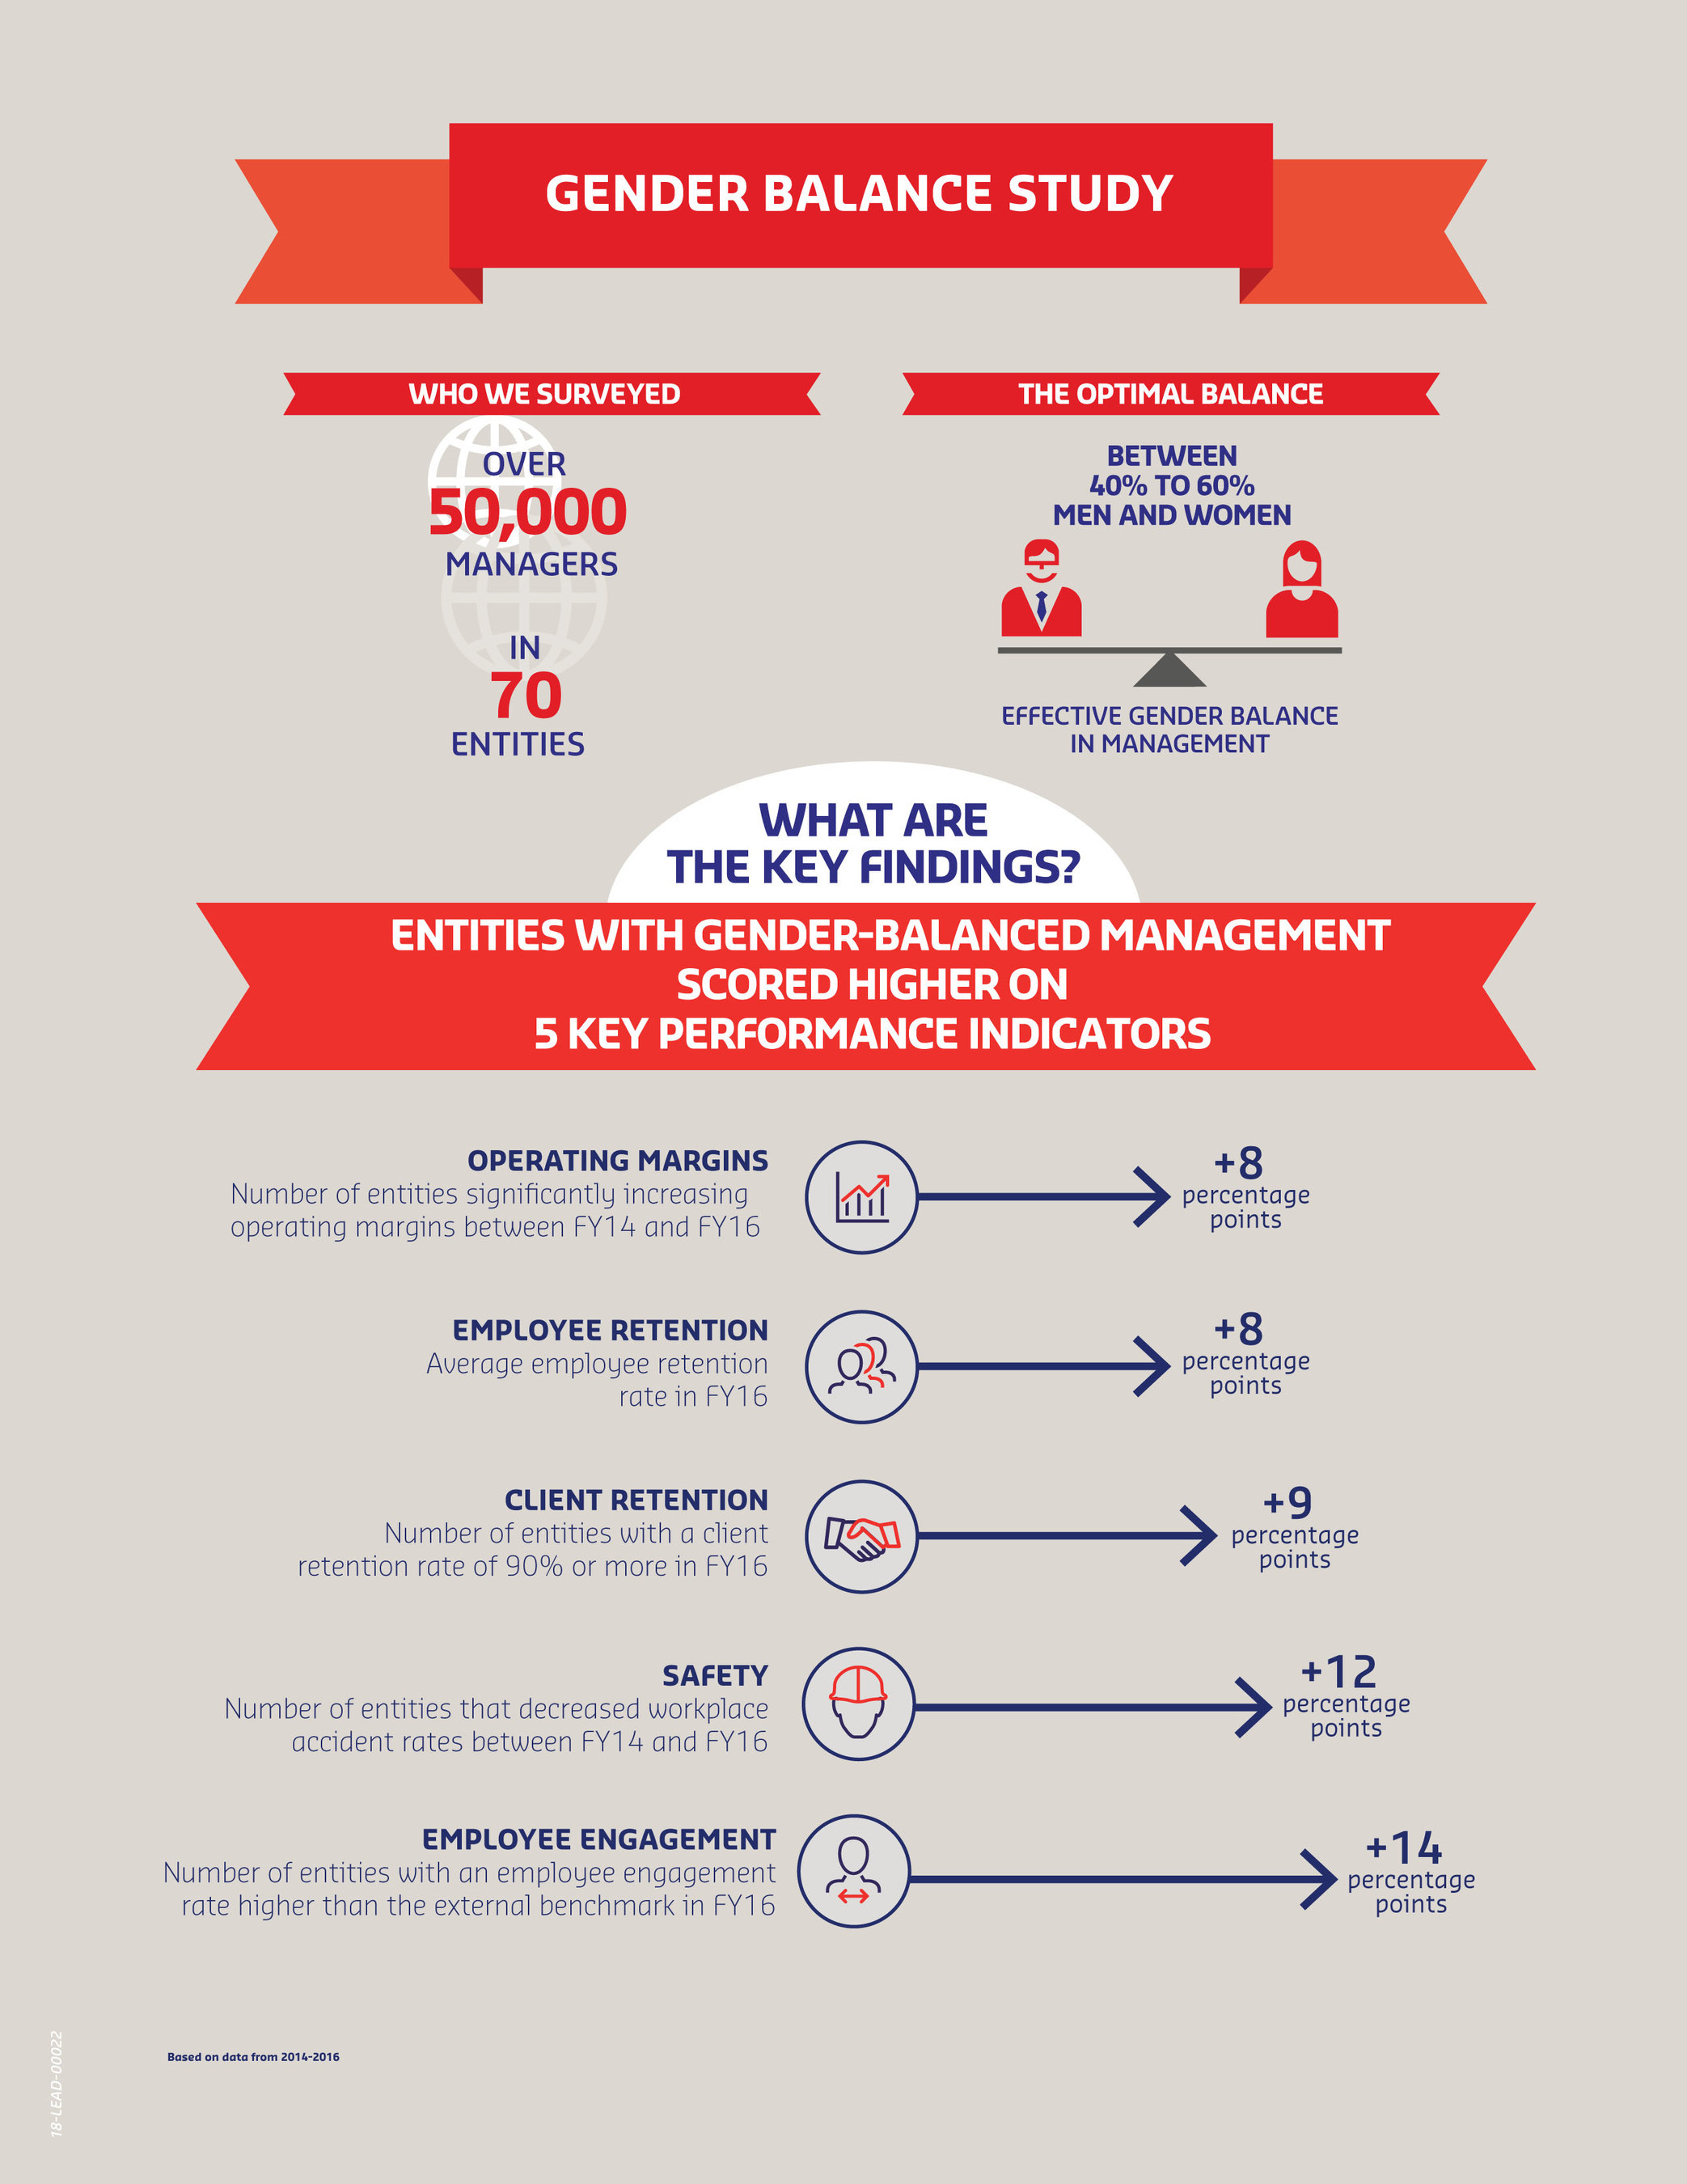
Sodexo, a food services and facilities management company committed to improving Quality of Life, has found that teams managed by a balanced mix of men and women are more successful across a range of measurements. The five-year, one-of-a-kind study of 70 entities across different functions represents 50,000 managers worldwide.
Operating margins, client satisfaction and employee retention, among other key performance indicators, were all higher among gender-balanced teams, meaning a ratio between 40 percent – 60 percent women to men.
“These results add a new, compelling dimension to a growing body of research that demonstrates the business benefits of gender equity,” said Rohini Anand, PhD, Senior Vice President, Corporate Responsibility and Global Chief Diversity Officer, Sodexo.
“The distinctive nature of the study, with its examination of both financial and non-financial performance indicators across so many levels of management and the pipeline to leadership, is a significant piece of the overall picture on importance of gender in the workforce for enhanced outcomes.”
Key Findings:
- Operating margins significantly increased among more gender-balanced teams than other teams.
- Gender-balanced entities had an average employee retention rate that was 8 percentage points higher than other entities
- Gender-balanced entities had an average client retention rate that was 9 percentage points higher than other entities.
- Gender-balanced management reported an employee engagement rate that was 14 percentage points higher than other entities.
- Gender-balanced entities saw the number of accidents decrease by 12 percentage points more than other entities.
(PRNewsfoto/Sodexo)
This unique Sodexo Gender Balance Study builds on previous internal and external research and amplifies Sodexo’s commitment to gender parity and an inclusive culture.
Sodexo, already a leader in diversity & inclusion, is breaking new ground in gender parity. Today, women represent 50 percent of our board. Thirty-two percent of senior leadership positions are held by women globally – a 6 percent increase at the very top levels since 2013. Middle management and site management positions are balanced at 46 percent. Currently, 59 percent of the total workforce works within gender-balanced management.
The company has committed to reach 40 percent women in senior leadership ranks by 2025 and has linked 10 percent of bonuses to this metric.
Read the full study here.
Digital Evolutions
New convenience-enabling technologies, like mobile ordering and delivery apps, are a bright spot in an otherwise slow period for the restaurant industry. U.S. foodservice traffic has been stuck between a 1 percent gain and flat for several years now, but restaurant visits paid by mobile app increased by 50 percent over the last year, finds a new study released by The NPD Group.
Mobile apps and other technologies are meeting the needs of time-strapped consumers and have given new meaning to quick service, according to the NPD report, Digital Evolution of Foodservice . Among the top reasons consumers are using mobile apps and other technologies are so they can order, pay, and have their food ready when they arrive. Other reasons include the ability to earn rewards and loyalty points, receive specials and coupons, and look up menu items, according to the report, which explores awareness and use of digital services including barriers, most- and least-liked features, and demographic and geographic differences.
The NPD report also finds that not all consumers are embracing technology when using restaurants. In 2017 two in five visits to restaurants were paid in cash. Of these digital non-user s, 22 percent said they preferred to pay in cash, while 18 percent didn’t want to pay service fees, and 16 percent were worried about identity theft or credit card fraud.
“Providing the ability to easily order food from a restaurant is no longer a nice-to-have, it is a need-to-have,” said Warren Solochek, NPD’s senior vice president, industry relations. “Restaurant operators seeking to gain more visits and grow the bottom line must decide which convenience enablers, digital or non-digital, are worth their investment.”
Chicagoland Drinkers Name Top Spots to Imbibe
Canada’s premier farm-to-glass distillery, Eau Claire conducted a survey of Chicagoland imbibers to explore local spirit preferences ahead of the distillery’s Chicago launch in late March. According to the survey, vodka was identified as the most preferred spirit choice by Chicago area residents, followed by whiskey rum and gin. The survey results also provided insight into where Chicagoland drinkers’ favorite spots to imbibe.
Survey respondents named Three Dots and a Dash as best cocktail bar and honored Bar Louie with the title of best happy hour. According to the survey, Chicago imbibers are most likely to be found at Moody’s Pub on a bad weather day and at Roof on theWit (voted best rooftop bar) on a good day. Drinkers with an appetite for more than spirits selected HopLeaf as the bar with the best food.
Of those surveyed, 87 percent said they drink cocktails 43 percent of respondents prefer craft spirits over spirits from major distilleries. The study also indicates that Chicagoland residents pay attention to alcohol brands, as 57 percent of respondents expressed that they ask for specific brands when ordering drinks in bars and restaurants. Furthermore, if craft spirits were available in bars and restaurants, 67 percent of respondents said they would prefer them over other brands. This places craft spirits ahead in competition with major liquor brands.
Respondents were also asked which factor most influences their decision to try new alcohol products. They were given the following options: bottle label/packaging, advertisements, beverage reviews, public tastings or friends and family. Public tastings at restaurants, bars or liquor stores was the biggest influencer as cited by 35 percent of respondents, closely followed by recommendations from friends and family. In regards to cocktail preference, 48 percent of respondents preferred classic cocktails and 41 percent showed a preference for new and creative ones, while only 11 percent preferred seasonal cocktails.
Chicago bars and restaurants may benefit from placing more craft spirits on the menu as most survey respondents, 76 percent, said they would drink more craft spirits if available to them. Furthermore, 64 percent of respondents said they would be willing to pay more for craft spirits. Expanding craft spirit menus could mean increased revenue for restaurants, liquor stores, bars and craft distilleries alike as 67 percent of respondents said they would ask for and prefer craft spirits in drinks ordered at restaurants or bars, if they were available.
“With our Chicago launch just around the corner, we were delighted to see the growing demand for craft spirits within the area,” said Eau Claire Distillery Founder David Farran. “This month, we look forward to bringing our award-winning spirits to distinguished Chicago imbibers looking for a true farm-to-glass experience.”
Other findings include:
- 73 percent of respondents indicated they already know where to purchase craft spirits
- Only 17 percent of respondents said that label art or bottle design does not influence their alcohol purchases at all
- 48 percent of respondents indicated they prefer classic cocktails and 41 percent prefer new and creative cocktails, while only 11 percent prefer seasonal cocktails.
- Best bar for single people: Slippery Slope
- Most underrated bar: Logan Arcade
- Best bar for live music: The Hideout
- Best new restaurant in 2017: Bonci Pizzeria
Food Gifting
Could the iconic Easter egg someday hatch into an Easter gift basket? The U.S. food gifting industry is banking on it, as food gift companies seek more holidays and special occasions to expand into, according to market research firm Packaged Facts in the new report Food Gifting in the U.S.: Consumer and Corporate, 6th Edition.
Packaged Facts forecasts overall U.S. consumer and corporate food gifting sales will approach $20 billion in 2018, up 4 percent from 2017. The market benefits from consumers giving food gifts to others—as well as to themselves—across a multitude of occasions ranging from anniversaries to graduations to birthdays. Among seasonal holidays, winter holidays such as Christmas remain a food gifting mainstay: more than half of those who have purchased food gifts for others in the last 12 months have done so for the winter holidays. Valentine’s Day and Mother’s Day are also popular food gifting holidays.
Roughly 26 million consumers—or 20 percent of food gifters—gave food gifts to others during Easter, putting the religious holiday just below Father’s Day in terms of food gifting participation. With such relatively modest participation, why are food gifting companies so eager to expand into Easter? Frankly, it’s because there are billions of dollars at stake as Easter has proven to be a holiday during which consumers are willing to spend. Those celebrating Easter last year spent an estimated $18 billion on products spanning eight categories, including candy, gifts, food, and flowers, with $152 spent per celebrant. Food and candy comprised more than $6 billion of consumers’ Easter spending.
Further, some 81 percent of adults age 18+ (205 million people) celebrated Easter in 2017, almost eight times as many who have purchased an Easter food gift for someone. This suggests that there is a substantial untapped market for food gift companies to target.
Packaged Facts also counsels that for holidays such as Easter with religious roots, food gifting marketers may need to adapt to shifts in religious affiliations over time: for example, the percentage of adults identifying as Christian Church Disciples of Christ has grown 11 percent during the 2008-2017 period; and growth among non-Christian groups (Muslim and Hindu, for example) has also been strong. Conversely, some 22 percent of adults say they have no religious preference, up 40 percent during 2008-2017. These trends provide opportunity to target accordingly.
Packaged Facts also advises remembering to market products not just for kids, but also for adults. For example, look at how (chocolate company) Green & Black has targeted adults in the home with its far trade Organic Easter Tasting Collection
“Food gifting marketers need to continue inventing and reinventing food gifts and to keep a watchful eye for ways to broaden holiday-related purchase rationales,” says David Sprinkle, research director for Packaged Facts.
QSR Market Forecast
Quick service restaurants market in the U.S. to grow at a CAGR of 3.03 percent during the period 2017-2021.
The latest trend gaining momentum in the market is Increasing innovations in food packaging. Owing to the increasing focus on sustainability, vendors have started adopting new packaging designs. Environment-friendly productions and solutions ensure a reduction in global warming. Quick service restaurant owners develop innovative and sustainable packaging solutions for branding, which, in turn, help increase footfall.
According to the report, one of the major drivers for this market is Growing innovation and customization in food menu. Customers at quick service outlets prefer fresh flavors and are willing to try existing food products with new exotic flavors. The millennials, i.e., the people aged between 20 and 35 years, are the key consumers of fast food and are inclined to taste new cuisines.
Further, the report states that one of the major factors hindering the growth of this market is Rising preference for home-cooked food. With the rising health consciousness among consumers, the popularity of fresh food and home-cooked meals is growing as they offer nutrition and are free from artificial ingredients such as taste enhancers and allergens. The factors that drive the consumption of fast food have been altered from tasty and affordable to nutritious, minimally processed, and organic.
Key Vendors
- Chick-fil-A
- Domino’s Pizza
- McDonald’s
- Restaurant Brand International
- Subway
Other Prominent Vendors
- Arby’s IP Holder
- Autogrill
- Carl’s Jr. Restaurants
- Cajun Operating Company
- AM.D.Q.
- Del Taco
- In-N-Out Burgers
- Jack in the Box
- Jollibee Foods Corporation
- Little Caesar Enterprises
- Papa John’s International
- America’s Drive-In Brand Properties
- Telepizza
- Whataburger
- White Castle Management
Top Craft Brew Producers
The Brewers Association (BA)—the not-for-profit trade group representing small and independent craft brewers—today released its annual lists of the top 50 producing craft brewing companies and overall brewing companies in the U.S., based on beer sales volume. Of the top 50 overall brewing companies, 40 were small and independent craft brewing companies.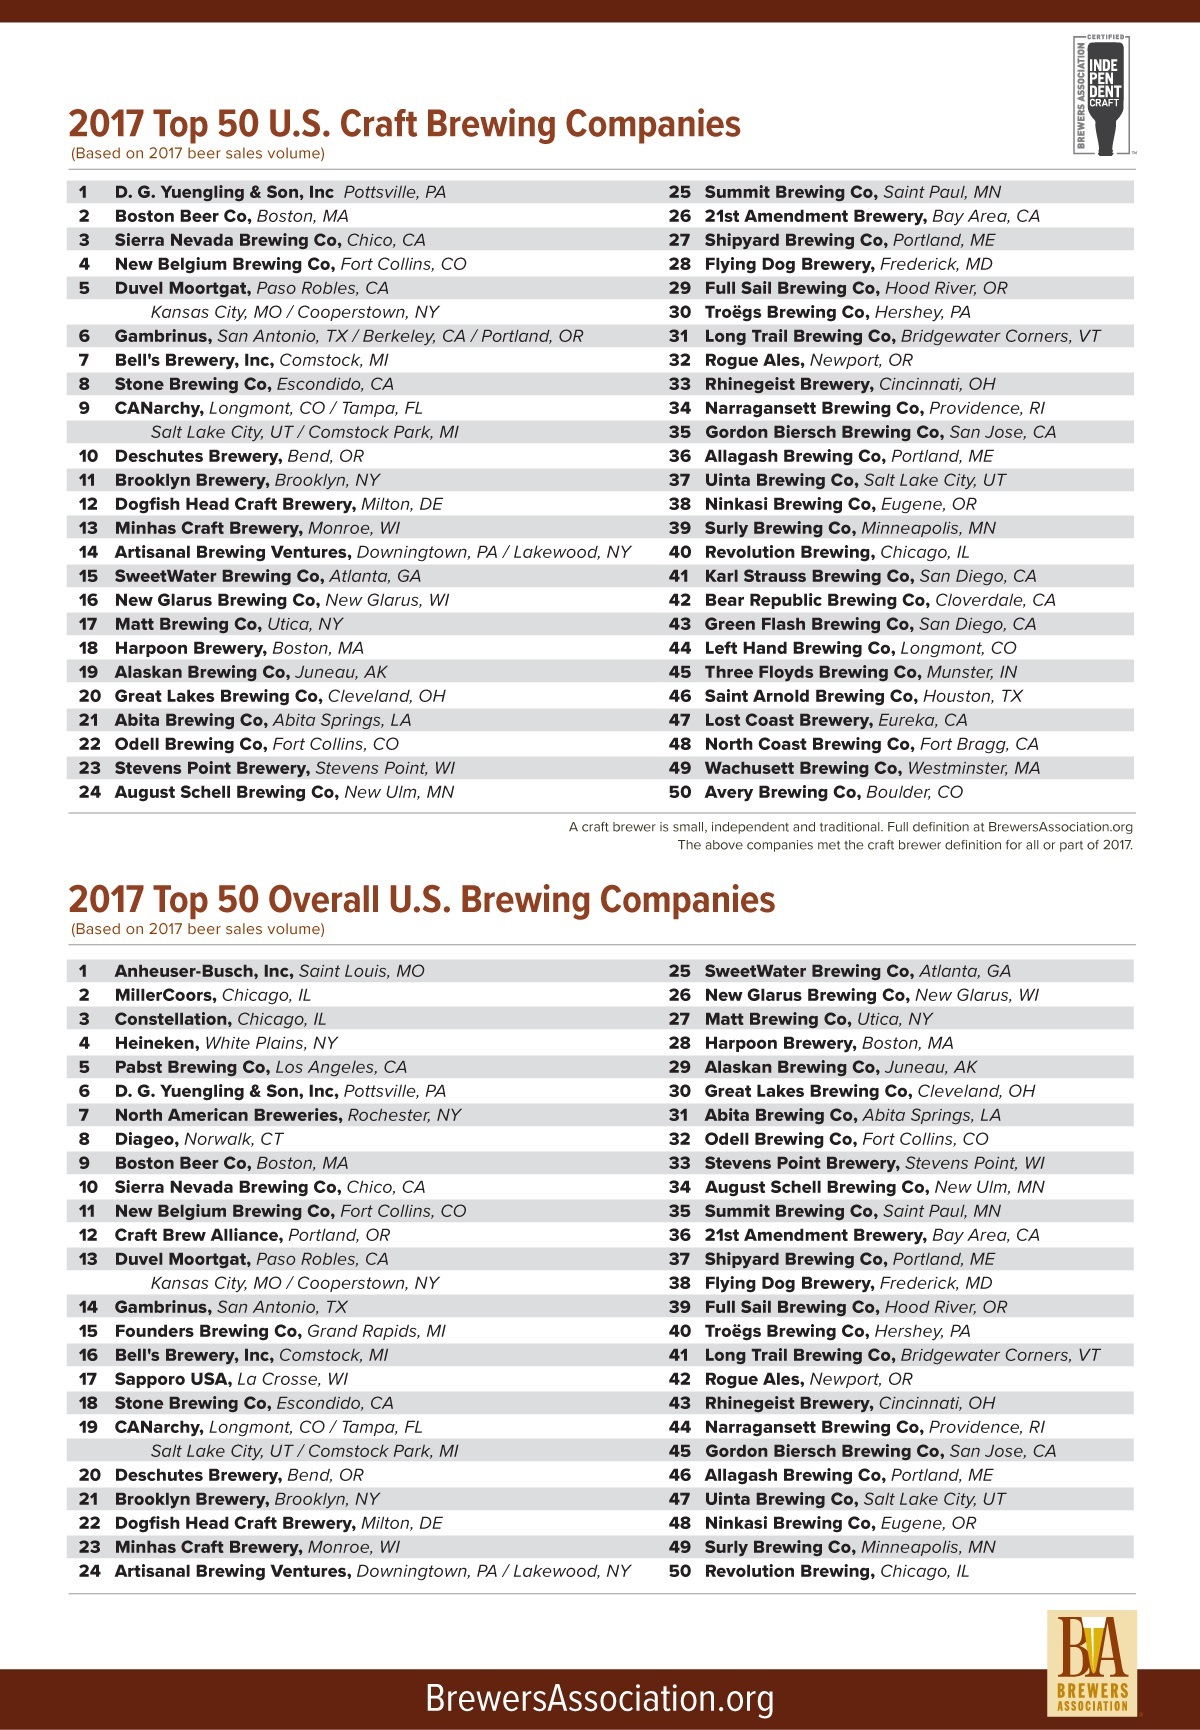
“In an increasingly competitive and mature marketplace, these brewing companies continue to lead and pave the path for small and independent craft brewers,” said Bart Watson, chief economist, Brewers Association.
Gift Card Survey
The Incentive Research Foundation released “A Closer Look at Gift Cards: U.S. Spend, Support, Sourcing, and Services for Gift Card Programs in Corporate Organizations.” Gift cards are the most prevalent award type, with U.S. businesses spending $24 billion on gift cards annually.
The IRF administered a survey to 300 industry professionals who run incentive or recognition programs for their companies. The study reports on how gift cards are sourced for incentive and recognition programs, how much money is budgeted toward them, what types are being purchased, and where opportunities lie for stakeholders.
“While gift cards are the most omnipresent non-cash award in U.S. businesses, the research revealed that one-third of reward and recognition buyers have limited to no awareness that there is an entire industry of gift card suppliers and agencies designed to supply a variety of gift cards to incentive programs,” said Melissa Van Dyke, IRF President. “’A Closer Look at Gift Cards’ will be an important resource to raise awareness and convey the benefits of working with gift card industry professionals.”
Key findings in “A Closer Look at Gift Cards: U.S. Spend, Support, Sourcing, and Services for Gift Card Programs in Corporate Organizations” include:
- Retail locations are the most popular channel for the purchase of gift cards as awards
- Agencies and gift card suppliers are the least commonly used channels for the purchase of gift cards as awards… however, for those who use them, agencies and gift card suppliers have the highest buyer satisfaction ratings
- Most U.S. businesses source gift cards from an average of two different channels
- Gift cards are purchased for rewards and recognition by 69 percent of medium-sized businesses and 61 percent of large firms
- Companies purchase gift cards for an average of 2.5 to 3 different audiences, with employees, followed by sales, being the most frequent audience types
- In large firms, participant communications (including website, mobile app, etc.) were most commonly outsourced to gift card suppliers
- Three-quarters of firms use closed-loop (e.g., Starbucks, iTunes) and open-loop (e.g., VISA prepaid) are the most prevalent type of gift cards
- Use of e-gift cards is increasing, with half of large enterprises and 58 percent of medium enterprises utilizing them
“A Closer Look at Gift Cards: U.S. Spend, Support, Sourcing, and Services for Gift Card Programs in Corporate Organizations” was supported by IRF Research Advocacy Partner, Incentive Gift Card Council (IGCC) of the Incentive Marketing Association.
Self-Service Kiosk Survey
Tillster released its Self-Service Kiosk Index, showcasing how Quick Service and Fast Casual restaurants can use kiosks to grow sales and prevent customers from leaving when lines are long.
For the second year in a row, Tillster partnered with SSI to conduct a study on how offering self-service kiosks impacts guest behavior. Surveying 2,000 restaurant customers across the United States, the proprietary study’s key findings summarize customer ordering habits with kiosks and illustrate how kiosks can lead to more visits. A key finding from the study shows a significantly high demand for self-service kiosks over the next year.
“Restaurants are finally beginning to adopt self-service kiosks, and our research shows it’s an important offering in the customer’s eyes,” said Perse Faily, CEO of Tillster. “And for restaurants, kiosks have proven to be optimized to achieve key objectives, such as increasing check size or improving speed of service.”
Line Lengths Drive Customers Away
A relatively new technology for restaurants, kiosks offer a way to accelerate the ordering and check-out process, which can be especially valuable during busy times.
Most restaurants might be surprised to learn just how short a line will drive customers away. The Index pinpoints the line length that will cause customers to walk away from their favorite establishment in favor of a faster experience. However, if kiosk ordering is available, many customers will stick around.
Self-Service Kiosks Lead to More Visits Across All Age Groups
In the last three months, only 18 percent of customers surveyed have used a self-service ordering kiosk. However, 60 percent say they would visit a Fast Casual or QSR establishment more often if self-service kiosks were offered.
It might be no surprise that tech-savvy millennials want to use these cutting-edge technologies, but Tillster’s research shows that all age groups – even older ones – would turn to self-service kiosks to upgrade their experience in both QSR and Fast Casual establishments.
“Customers of all ages are now looking for digital interactions in restaurants, especially ones that provide them with a faster and easier dining experience,” adds Faily.
Download the Self-Service Kiosk Index to learn more.
The survey was conducted online within the United States by Tillster June 13-15, 2017, among 2,000 adults 18+ in the United States. No more than 20 percent of respondents are from any one state, and respondents must have eaten at a QSR or Fast Casual restaurant three times in the past three months.
Top Groupon Cities
Groupon unveiled its annual Best of Groupon collection celebrating this same group of entrepreneurs for their outstanding customer service and popularity of their Groupon campaigns. In recognition of this yearly distinction, Groupon analyzed customer satisfaction ratings and sales data to determine which cities had the friendliest local businesses in the nation.
The top 10 cities –– meaning the highest percentage of merchants that met certain criteria for customer service and deal popularity –– are:
1. Charleston, S.C.
2. Seattle
3. Phoenix
4. New Orleans
5. Philadelphia
6. Miami
7. Boston
8. Minneapolis/St. Paul
9. Denver
10. Hartford
“We recognize and celebrate the local businesses that make the neighborhoods we call home great places to live in just about everything we do,” said Jennifer Carr-Smith, senior vice president of North American Local, Groupon. “With spring just around the corner, now is the perfect time to explore your community and support these businesses and experience some true local hospitality.”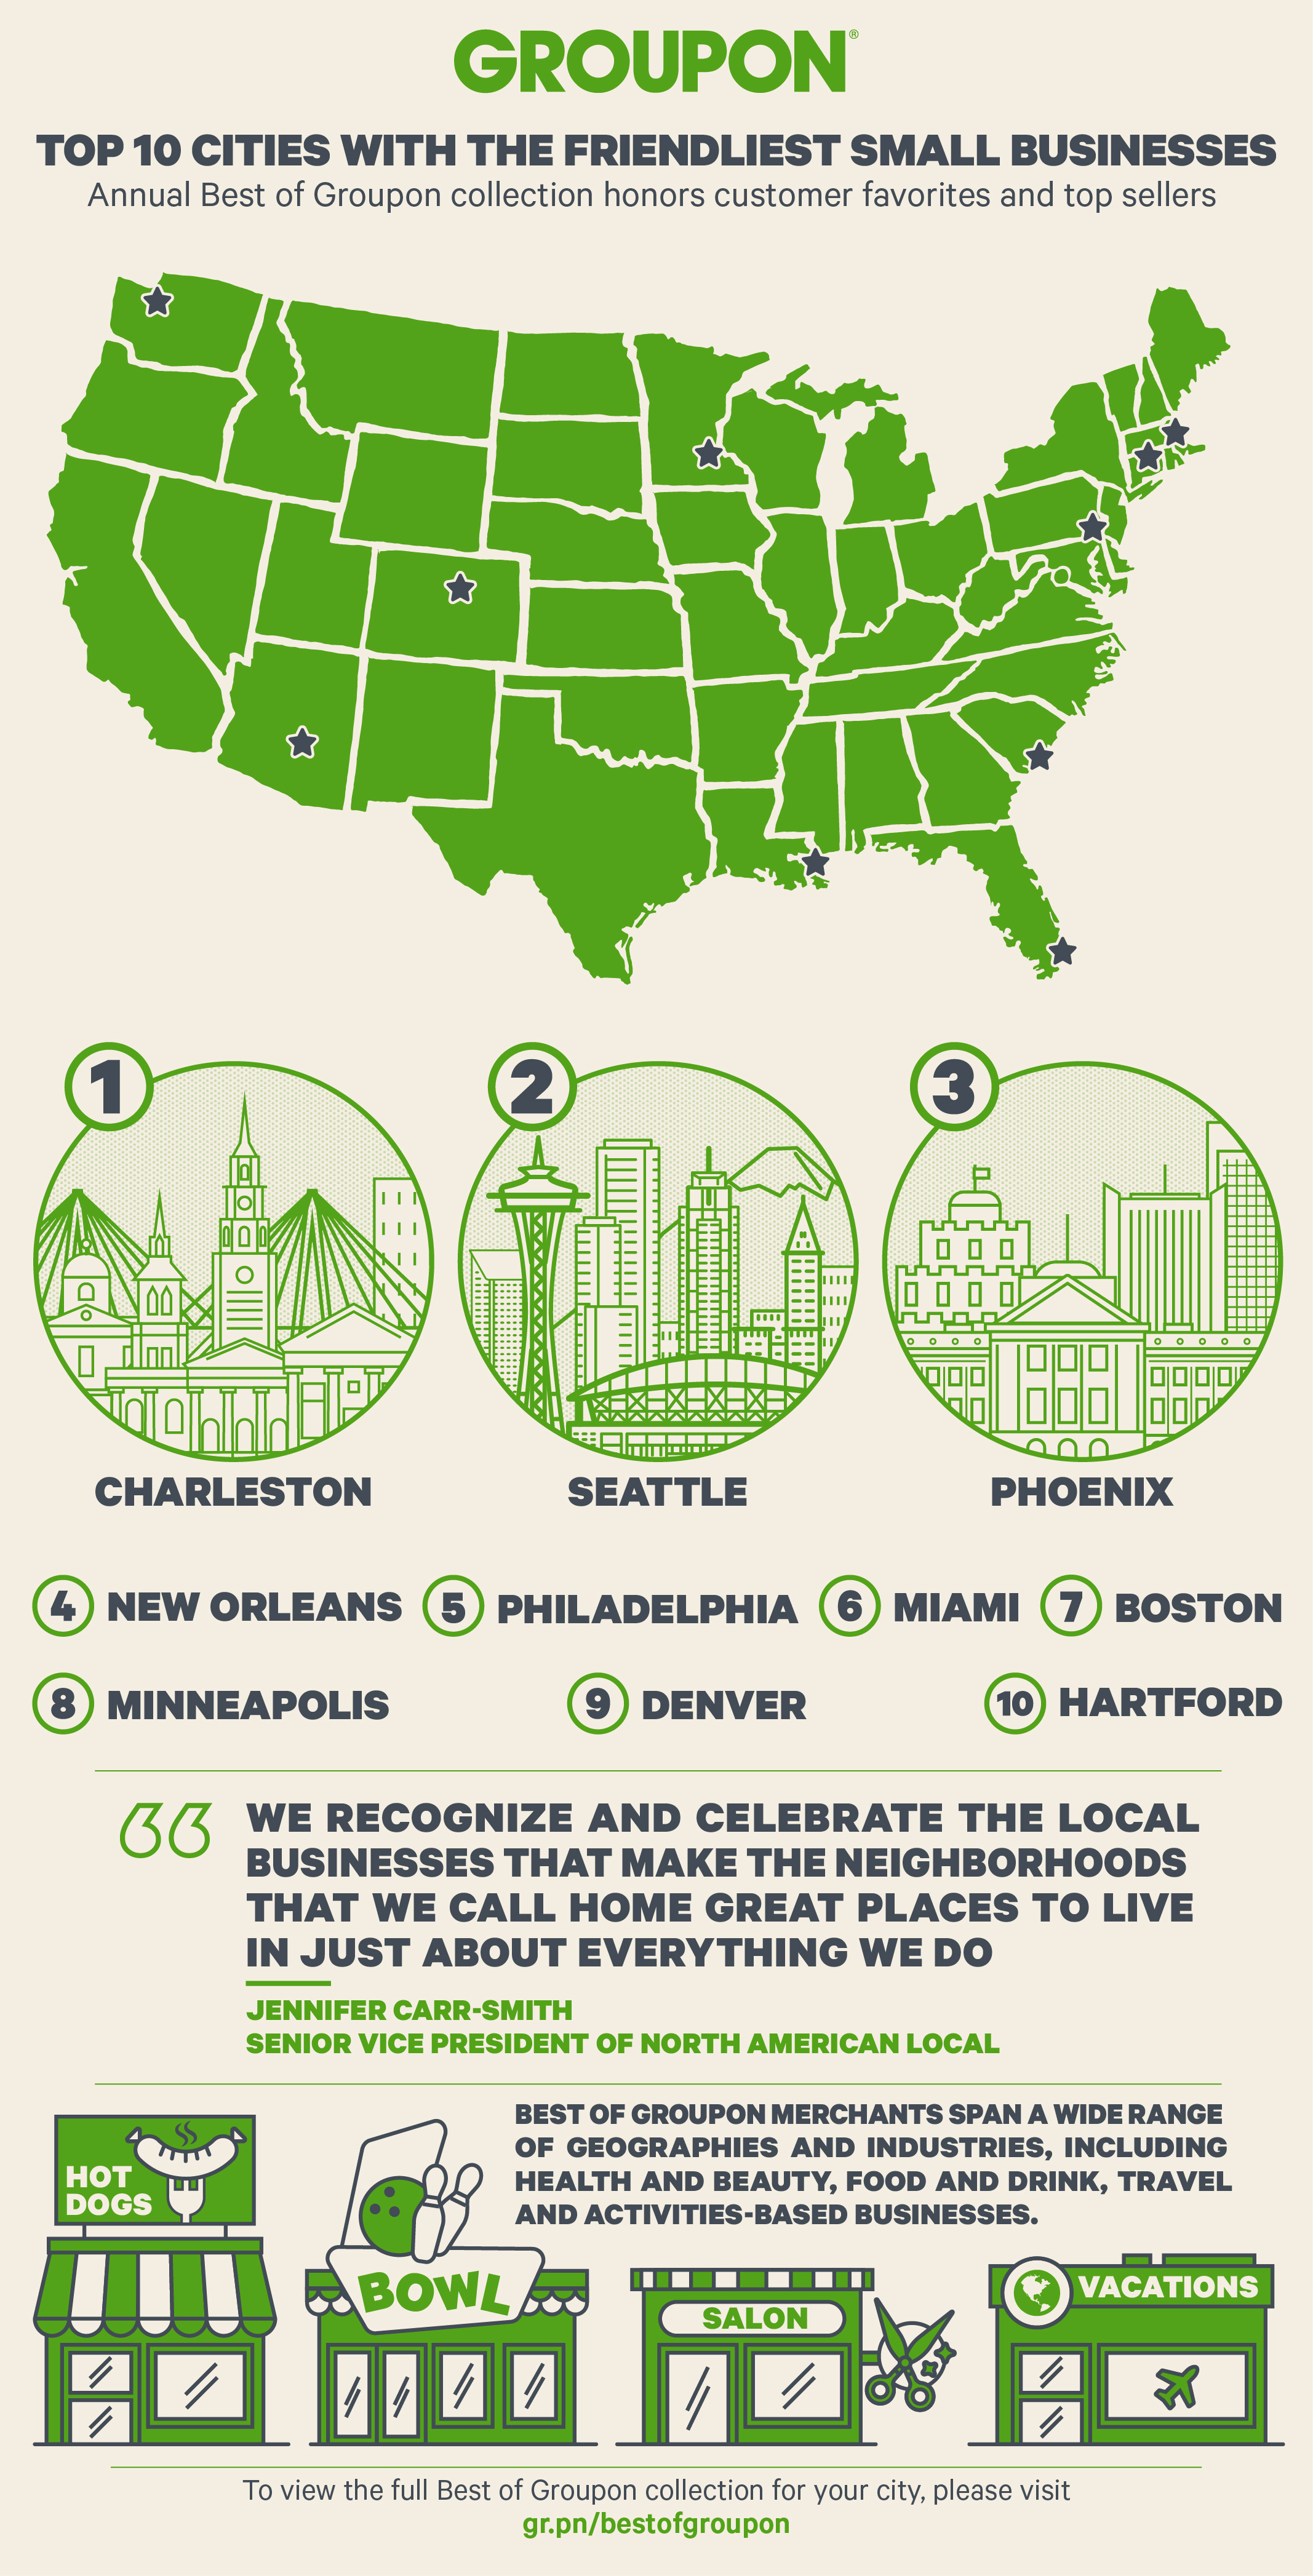
Best of Groupon merchants span a wide range of geographies and industries, including health and beauty, food and drink, travel and activities-based businesses.
State of Retail
raditional and online retailing are increasingly intertwined as customers seamlessly shop across touchpoints and the industry uses both platforms to better serve them, according to the annual State of Retail Online study released by the National Retail Federation and Forrester.
“This report shows more than ever that retail is retail regardless of where a sale is made or how the product is delivered,” NRF Vice President for Research Development and Industry Analysis Mark Mathews said. “Products ordered online are increasingly picked up in-store or shipped from a nearby store, and digital technology being used at bricks-and-mortar locations lets retailers help customers find what they want or make the sale even if the product is out of stock. Traditional retailers have seen the opportunities of online selling for years now, and those selling online increasingly see that stores are part of the key to success.”
Of the companies surveyed this year, 32 percent were “pureplay” online retailers while 57 percent were multichannel retailers, including traditional bricks-and-mortar retailers that also sell online.
This year’s data reveals that 43 percent of store-based retailers surveyed expect a net increase in the number of bricks-and-mortar stores they operate by the end of 2018 compared with 2017, and only 16 percent expect a net reduction. Additionally, retailers are proactively working on their real estate assets, whether testing new store formats such as opening some type of pop-up store (24 percent), and opening new warehouses or distribution centers (12 percent).
New physical locations are important because 42 percent of retailers surveyed say that faster delivery of online orders is their top customer-facing priority, and many plan to use stores to achieve that goal. Omnichannel services such as buy online, pick up in-store are an in-store priority for 21 percent, along with 15 percent that cite ship-from-store as a fulfillment priority.
“More brands plan to open stores versus close them this year, which proves that the physical retail store is not doomed as many think it is,” Forrester Vice President and Principal Analyst Sucharita Kodali said. “Smart retailers understand that the two go hand-in-hand, but customer-obsessed retailers will continue investing in areas like omnichannel to provide customers with the seamless on and offline experiences they expect and now require. This year’s survey proved that while they have work to do in 2018, retailers are moving in the right direction.”
Personalizing the shopping experience was another top priority, cited by 15 percent of store-based retailers. Retailers surveyed are also focused on using technology to better enable store associates to help customers (12 percent), as well as improving the in-store experience (12 percent). To support their store associates providing service to customers, 61 percent of retailers surveyed plan to spend more on employee training.
Digital continues to contribute significantly to retail overall, both directly and as it influences sales in stores. Seventy percent of retailers surveyed noted that online conversion rates – the number of people browsing an item online who actually follow through and make a purchase online – increased in the past year. Further good news: 62 percent said repeat customers were up and 57 percent said average order values had increased.
While online sales coming from desktop computers currently double those of mobile browsers, mobile sales are growing 36 percent per year versus 8 percent on desktop. Mobile app sales are growing at an annual rate of 16 percent, and accordingly, 89 percent of retailers plan to increase investments in mobile initiatives.
Canadian Fish Stats
Fisheries and Oceans Canada (DFO) released trade figures for fish and seafood products exported by Canada in 2017. The value of Canada’s fish and seafood exports continued trending upward in 2017, with an overall increase of $312 million (5 percent) over the previous year, and total sales reaching $6.9 billion. The largest growth market for Canada’s exports was China, which saw a 25 percent ($194 million) increase from 2016, followed closely by Japan at 13 percent ($40 million). Exports to the U.S. were steady at a value of $4.3 billion.
Canada’s top three species exported globally in 2017 were lobster ($2.1 billion), snow/queen crab ($1.0 billion), and Atlantic salmon ($909 million).
With thousands of seafood buyers and sellers from around the world, Seafood Expo North America is the largest trade exposition of its kind in North America. It presents a tremendous opportunity for Canada to promote our world class fisheries management regime and our high-quality, sustainably-sourced fish and seafood products. Once again this year, Canada will have a significant presence at the Expo, with over 100 exhibitors attending from across the country.
Quick Facts
- Canada exported fish and seafood products to 137 countries last year.
- Canada’s largest exports by value in 2017 were lobster, snow/queen crab, farmed Atlantic salmon, and shrimp.
“Yet again, Canada’s high quality, safe and sustainably managed fish and seafood products continue to be sought after the world over. With $6.9 billion exports just last year, our fish and seafood sector is strong and growing. Our government is committed to continuing to expand trade and economic opportunities for Canadian business,” said The Honourable Dominic LeBlanc
Minister of Fisheries, Oceans and the Canadian Coast Guard.
Combi Ovens Market
A new report published by Future Market Insights (FMI) titled “Combi Ovens Market: Global Industry Analysis (2012-2016) and Opportunity Assessment (2017-2027)” states that the demand for combi ovens across the globe highly depends upon the food preferences in different countries. For instance, people in China and the U.S. majorly consume fried items, whereas people in Europe make bakery, fried, and roast as their preference. The growing demand for combi ovens has impelled manufacturers to approach the market in accordance to the strong demand for heavy and medium capacity combi ovens in order to serve hotels, institutions, and commercial kitchens. According to FMI, the global combi ovens market is anticipated to witness a CAGR of 10.3 percent over the course of the forecast period.
Growing Demand from the Foodservice Sector to be Key Growth Driver
The growing demand from the foodservice industry and the need for more productive cooking methods are expected to be the core drivers for the global combi ovens market in the coming years. With the growth in economy and increment in the disposable income of people, people now endeavour to spend more on items that can fulfil their desires such as a luxury car, an apartment, or on the food and beverages they desire to eat or drink. Humans are inquisitive in nature, and have the tendency to explore new things and new varieties of food to taste, which has thus pushed culinary specialists or chefs to come up with new types of cooking methods. Combi oven is best for cooking meat owing to the reason that the heat in the chamber does the majority of the cooking and the moisture in the oven prevents the meat from drying out and also increases its consumable life. Combi ovens are a perfect alternative for cooks when they are in the need to serve food in quick service restaurants or serve bulk orders. In this way, combi ovens are in great demand in inns, hotels, restaurants, eateries, and at other food outlets. The development of the foodservice sector across the globe is expected to bode well for the progression of the global combi ovens market.
North America to Oust Europe in Terms of Value Share by the End of 2027
Among all the regions, Western Europe is expected to emerge as the leading region in the global combi ovens market with a share of 41 percent in 2017. However, by the end of the forecast period, Western and Eastern Europe are both likely to witness decline in their market shares and North America will witness a substantial rise in its share in the overall market by the end of 2027. The growth of North America can be attributed to the growing investments being done by leading market players. To expand their market presence and global footprint, numerous players are focusing on investing in the North America market. Key players are adopting the strategy of mergers and acquisitions to collaborate with the local emerging players and to penetrate into the North America and strengthen their sales channel distribution.
Enhancement of Product Portfolio to be Core Strategy of Key Market Players
Key market participants are focusing on enhancement of their medium-term expansion strategy, product portfolio strategy, and mergers with regional distributors to expand their business. The players operating in the market are Alto-Shaam Inc., Electrolux AB, Fujimak Corporation, The Middleby Corporation, Retigo S.R.O, and Dover Corporation, among others.
Food Colors Popularity
The global food colors market size is expected to reach USD 2.97 billion by 2025, according to a new report by Grand View Research, Inc. Growing demand for colored food products owing to their aesthetic appeal and increasing use in end user industries is expected to drive the demand for food colors over the forecast period.
Growing demand for the product across various industries such as beverages, bakery & confectionary, and dairy products is likely to have a positive impact on the utilization of food colors in the foreseeable future. The demand for food colors for the production of canned products is also estimated to drive the industry growth.
Growing consumer demand for low-fat food is another factors which is expected to supplement the market growth in near future The rising adoption of processed food by consumers across the globe is estimated to translate into the growth in demand of the product. In addition, rising demand for alcoholic and non-alcoholic beverages is likely to drive the market growth over the forecast period.
Rising disposable incomes and changing lifestyles due to rapid urbanization are likely to have a positive influence on the market over the forecast period. Ongoing product innovation, consumer preference for high-quality products, and solidification of government regulations is likely to propel the growth in the next few years.
The absence of any notable substitute to the product results in negligible threat of product substitution. However, the industry is expected to witness internal substitution with natural food colors being increasing used as a substitute for synthetic food colors. The market is expected to witness a degree of uncertainty due to high degree of volatility observed in the prices of raw material.
Further key findings:
- Natural food colors are expected to reach USD 2.50 billion by 2025, owing to growing awareness among consumers regarding the health benefits associated with the product.
- CSDs and non-alcoholic beverages is estimated to be the fastest growing application with a growth rate of 6.4 percent over the forecast period, on the account of rising demand for juices, soft drinks, and carbonated soft drinks in emerging economies.
- The demand for the product in Asia Pacific is expected to reach a value of USD 868.0 million by 2025 in the wake of growing food and beverage industry in the region.
- The companies have adopted different approach to compete with each other. For example, Allied Bioitech Corporation have adopted a mono-product approach. It is global supplier for carotenoids and manufactures & distributes only on product.
The Flavors & Fragrances Market has been segmented on the basis of ingredients into synthetic and natural. The natural ingredients segment is projected to grow at the highest CAGR during the forecast period. Natural ingredients are extracted from plants and animal sources. Increasing availability of natural ingredients and rising awareness among consumers towards healthier lifestyles are the major factors driving the market for natural ingredients.
Beverages end-use segment is expected to lead the flavors market during the forecast period
Beverages was the largest end-use segment of the flavors market in 2016. This end-use segment is projected to drive the flavors market from 2017 to 2022 due to the changing lifestyles and rise in consumer spending on soft drinks, and sports drinks in emerging countries, such as India, China, Brazil, and South Africa, among others. In addition, increasing demand for dietary drinks owing to the rising percentage of health-conscious individuals in countries such as the US, the UK, Germany, France, and Japan is also expected to drive the demand for flavors in beverages.
Asia Pacific is expected to be the largest market for flavors & fragrances during the forecast period
The Flavors & Fragrances Market has been studied for five regions, namely, Asia Pacific, North America, Europe, the Middle East & Africa, and South America. The Asia Pacific is projected to be the largest Flavors & Fragrances Market during the forecast period due to the growing population and rapid urbanization. Increase in per capita spending on consumer products in high-growth economies, such as China, India, South Korea, and Indonesia is also expected to drive the Flavors & Fragrances Market in the Asia Pacific.
Some of the key players in the Flavors & Fragrances Market include Givaudan (Switzerland), International Flavors & Fragrances, Inc. (US), Firmenich (Switzerland), MANE (France), Symrise (Germany), Sensient (US), Takasago (Japan), Frutarom (Israel), Robertet (France), and T.HASEGAWA (Japan).
Intimate Brands
YouTube ranked as the third most intimate brand among millennials, according to MBLM’s Brand Intimacy 2018 Report, which is the largest study of brands based on emotions. Brand Intimacy is defined as a new paradigm that leverages and strengthens the emotional bonds between a person and a brand.
“We were surprised and pleased to see YouTube as an addition to the top three most intimate brands for millennials this year,” stated Mario Natarelli, managing partner, MBLM. “We believe its rise is due to our culture’s continued need for escape and the brand’s immediate, diverse content, personalities and growing offerings in movies and live TV. YouTube is clearly an established ritual in the lives of many millennials today.”
Apple and Disney ranked as the first and second most intimate brands for millennials. Comparatively, in MBLM’s 2017 report, Disney placed first, followed by Amazon and Netflix.
The other brands that round out the top 10 are: Target, Amazon, Nintendo, Google, Xbox, Netflix and Whole Foods.
The age group of 18-24 year-olds had a slightly different mix of top companies. The top 10 for the group are: Apple, Amazon, YouTube, PlayStation, Starbucks, Nintendo, Google, Netflix, Coca Cola and Walmart.
The Brand Intimacy 2018 Report contains the most comprehensive rankings of brands based on emotion, analyzing the responses of 6,000 consumers and 54,000 brand evaluations across 15 industries in the U.S., Mexico and UAE.
The Power of Video Marketing
Top marketers know that digital video is one of the most powerful tools to increase consumer engagement and brand loyalty. In fact, according to a new study from Clinch. However, their lack of investment on personalized creative for each platform may put them at a disadvantage.
The study found that 78 percent of marketers plan to increase their production of video ads in 2018, while only 43 percent of marketers plan to increase their production of static banner ads this year.
Social is Video
When it comes to digital video campaigns, Facebook reigns supreme, representing 46 percent of all video ads produced. When adding Facebook-owned Instagram into the mix, this number leaps to 74 percent. YouTube comes in a close second at 41 percent.
“It’s no secret that Facebook and YouTube dominate the digital media landscape and we don’t expect this to slow down, particularly with the Facebook algorithm change which requires brands to pay in order to be seen. In 2018 brands will increase spend and leverage the rich data that these platforms provide. However, the data and platform are just two pieces of the puzzle. Creative is the critical third piece. If brands aren’t uniquely tailoring their creative specifically for each platform and by audience, opportunities will be missed and ROI will be lowered,” said Oz Etzioni, co-founder and CEO of Clinch.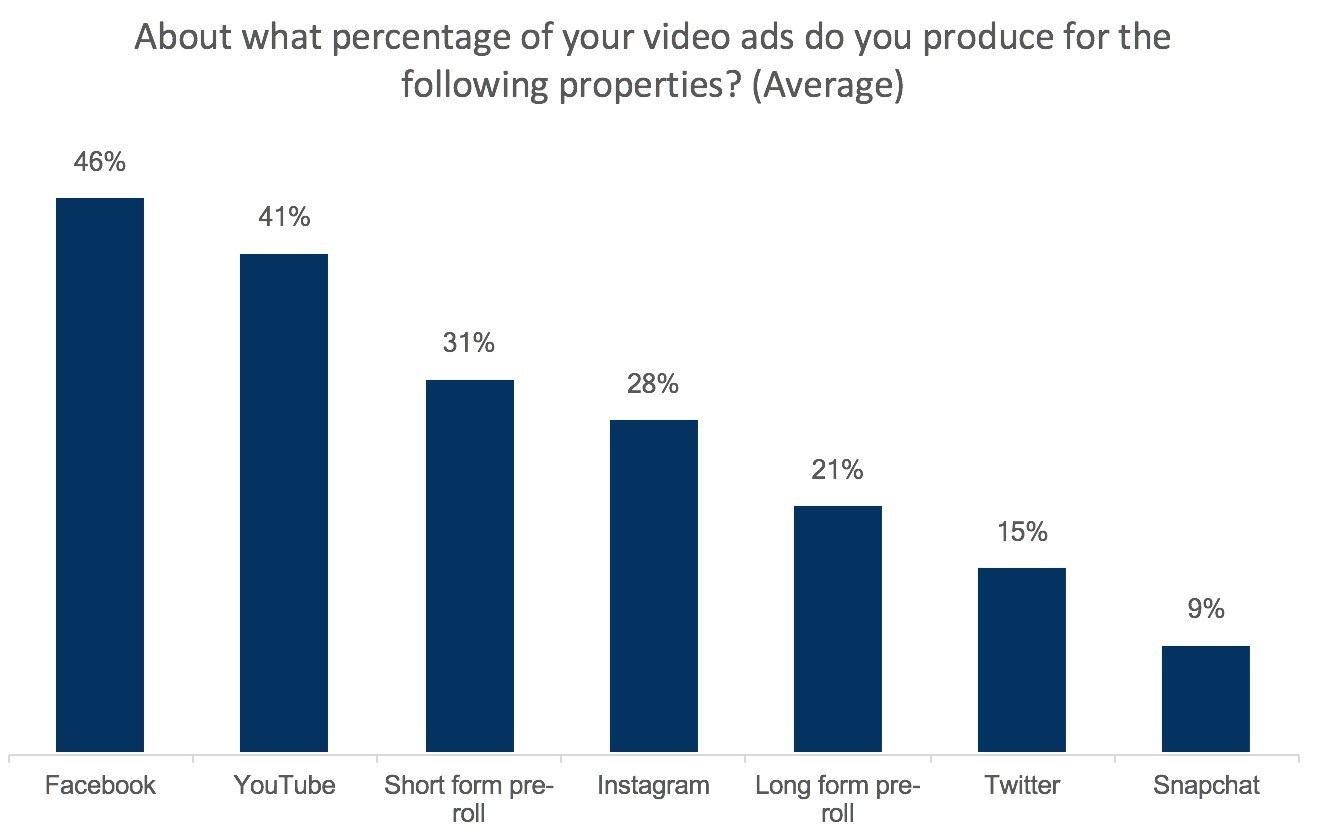
While digital video continues to grow, nearly three quarters of marketers adopt online video from their TV commercials with 44 percent indicating that they don’t shorten commercials for each platform’s suggested length. While TV ads remain a critical source of video content, the user experience of each social platform is very different than traditional TV. For example, TV ads are 15 to 30 seconds long but Facebook and YouTube recommend six second videos.
Etzioni continued, “We were really surprised to learn that marketers were taking a one size fits all approach to video. In 2018, marketers will awaken to the fact that investment in creative will increase ROI and personalization at scale will become the norm for digital video as it has become for static ads.”
Defining Social Personalization
While 50 percent of respondents say they personalize their video campaigns, brands can be doing a lot more. Those that are personalizing their creatives based on data are seeing big results. Nearly 90 percent of respondents who have customized Facebook or YouTube video ads reported seeing benefits. Furthermore, 70 percent of those who customize said that they have seen improvements in their key performance indicators (KPIs).
“In the next few months, the definition of personalization will change. Rather than creating a handful of versions – one for men, one for women, one for the East Coast and one for the West Coast, we expect brands to be using data insights to personalize at scale. This means hundreds if not thousands of versions of videos where the message and creative is tailored to their specific needs and interests. This will create a more meaningful experience for the consumer and transform video campaigns from simply brand awareness to direct response opportunities,” Etzioni concluded.
The full report, “How Leading Brand Marketers are Using Personalized Video to Drive Sales,” is available for download here.