
According to a Recent Study/Survey … Mid-June 2017 Edition
40 Min Read By MRM Staff
This Mid-June 2017 edition of Modern Restaurant Management (MRM) magazine’s research round-up includes TripAdvisor’s Diner Engagement Study, the Love List: Food, the cost of feeding teenagers and Father’s Day statistics from our friends at Upserve.
Diner Engagement
The new TripAdvisor “2017 Diner Engagement Study” analyzes the way in which consumers interact with TripAdvisor’s more than 4.2 million restaurant listings. With over 150 million average monthly restaurant browsers, TripAdvisor is increasingly becoming one of the most effective and popular performance marketing channels for restaurateurs, and thU.S>, it is important that owners understand how to better manage and maximize their bU.S>iness listing.
Some key findings from the 2017 Diner Engagement Study include:
- Diners spend double the amount of time viewing TripAdvisor restaurant listings that have at least 20 reviews, compared to similar restaurants with no reviews.
- Owners who respond to at least 1% of reviews see twice as much diner engagement with their TripAdvisor listings
- Restaurant listings with a single management photo incur up to 44% more interaction than a restaurant with no photos.
- Restaurants that display hours of operation on their TripAdvisor listing have an average of 36% more diner engagement than restaurants without them.
What Dad Wants
In May, restaurants know to dust off their brunch menu for the traditional Mother’s Day Brunch. But how should they be preparing for Father’s Day? Upserve, the restaurant management platform company, wanted to find out, so they surveyed 629 people from around the US to find out how they spend their Father’s Days. The results are surprising – and offer some great tips for restaurateurs preparing for this weekend:
- Staff up for dinner: 51 percent of respondents plan to eat dinner out with their dads this weekend
- It’s not the night to try your hand at a fancy new recipe: 32 percent of respondents say Dad wants to eat “good old fashioned steak and potatoes”
- Don’t worry about stocking the bar: wine and cocktails aren’t that popular. 36.6 percent of dads around the country want a cold beer to celebrate

Are we celebrating our parents in the same way? Mother’s day brunch – Father’s day BBQ … right? Turns out, nothing we thought was true is! We’re all much more likely to eat dinner on those days, but Dad is much more likely to be celebrated with a “relaxing day” this weekend (16 percent) than Mom is on Mother’s Day (only three percent)
· What are we doing for father’s day? Families everywhere reliably take their moms out to eat for mother’s day … but father’s day is not so clear cut. We’re just as likely to meet for a bbq as we are to go out to dinner – and dad is much more likely to get a “Relaxing day” than mom is.
· Families are equally as likely to go out to eat (23 percent) this weekend as they are to host a family gathering (24 percent)
· 51 percent of respondents plan to eat dinner with their dads this weekend
· Restaurant Tips: Prep for dinner, and bring out the beer: dads everywhere prefer a cold one.
· Beverage trends: Craft beer reigns supreme. Dads everywhere prefer a beer on father’s day … but the older they are, the more likely they are to order a wine or a cocktail.
· 37 percent of dads around the country want a cold beer to celebrate
· What’s on the menu? Tried and true: dads want “old fashioned steak and potatoes” for dinner. But, if you’re 18-29 – you are twice as likely to take dad out for a “greasy indulgence”
· 32 percent of respondents say Dad wants to eat “good old fashioned steak and potatoes”
Age Trends
18-29
What are Millenials and Gen Z Planning?
They’re mostly taking mom out to eat (39.6 percent) – for dinner (44.54 percent), followed by having a get-together (26.9 percent)
They’re more apt to have a get-together for dad (28.57), followed by going out to eat (22.69 percent)
Much more likely than other groups to take dad out for a “Greasy indulgence” (pizza, cheeseburger, etc) (20.17 percent)
By Gender
· Young men are definitely taking Mom out (42.9 percent) – but just as likely to do a recreational activity with dad (22.5 percent) as they are to eat dinner (26.5 percent) or have a get together (20.4 percent). Equally likely to have lunch (36.7 percent) with dad as dinner (42.9 percent)
· Young women are much more interested in having a family get together for father’s day (34.3 percent) vs going out to eat (20 percent)
30-44
· Much more likely to take mom out to eat (38.5 percent) but split right down the middle with dad: 24.3 percent want to eat; 24.9 percent want a get together.
45-59
· Beer is still the leader (30.1 percent), but cocktails (11.9 percent) and wine (10.8 percent) start to make a mark
· Most likely group to give dad a relaxing day (21.6 percent)
60+
· Dad’s favorite drinks: beer – 25.8 percent; wine – 15.1 percent; cocktail – 9.4 percent
Tech Trends
Overall, the restaurant industry is pushing certain technology trends in order to be more profitable and competitive, but consumers are not necessarily agreeing.
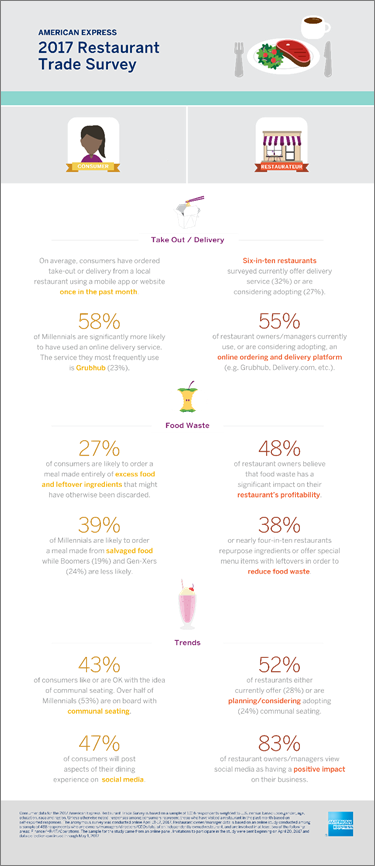
According to recent results from the 2017 American Express Restaurant Trade Survey, there may be a miscommunication between what customers are interested in and what restaurants are serving up. For starters, as much as one-third (33 percent) of restaurants are already using or are considering adopting automated customer service, such as kiosk or table-side ordering; however, most customers prefer a restaurant with traditional wait staff who can provide in-person service (75 percent) over one with digital customer service platforms (25 percent). Other key findings include:
- Most consumers prefer old-fashioned dining-out (51 percent) over ordering take-out for pick-up (29 percent), but, nearly two-thirds (65 percent) of restaurants have plans for technology investments in the next 12 months – on average around $4,200 – which can be expected to be spent on ordering technology.
- Consumers are more likely to rely on consumer review websites such as Yelp or Foursquare (33 percent), than professional review websites (7 percent) or posts on social media (16 percent). The majority of restaurants however, are more likely to use some type of social media promotion for their business, most frequently Facebook (85 percent) and Instagram (46 percent).
- Outside of tech, 29 percent of restaurants have or are considering adopting a no tipping policy but 63 percent of customers would like to continue being able to tip their servers.
- Additionally, restaurants may not be marketing to their core audiences… On average half of restaurants indicate that the majority of their patrons are Gen Xers (49 percent) and just over a third say the majority of their patrons are Millennials (35 percent). However, more restaurant owners are currently targeting Millennials (45 percent) with their marketing and promotion than Gen Xers (39 percent).
Fast-Casual Challenges
Findings from Technomic Inc.’s recently released Top 250 Fast-Casual Chain Restaurant Report indicate that despite industry-leading growth, the fast-casual segment is not immune to the challenging operating conditions facing the broader restaurant marketplace. Technomic’s annual report reveals that the Top 250 fast-casual chains grew sales a cumulative 8.4 percent in 2016 to a total of $40.4 billion.
While this growth significantly outpaces other industry segments, it lags compared to the 11.9 percent sales growth in 2015 and 13.8 percent growth in 2014. A key factor contributing to the slowing sales growth trend is decelerating unit development within the segment, which registered at 8.9 percent in 2016, following a rate of 9.6 percent unit growth in 2015.
From a chain-level perspective, the struggles of Chipotle had a substantial impact on the overall performance of the Top 250, as the second-largest fast-casual chain saw its sales drop by more than 13 percent in 2016. Helping to push the segment in a positive direction, however, were leading chains Panda Express, Jimmy John’s and Zaxby’s, which all saw double-digit growth and operate with annual sales volumes well over $1 billion. The fast-casual pizza segment continues to be a growth engine as well, with the menu category increasing its sales at a cumulative rate of 35 percent. Look for specialty and health-focused concepts to continue to shine and move up the rankings over the coming years as chains like Sweetgreen, Modern Market and Lemonade expand their location presence and attract increasingly health-conscious consumers.
“As the overall chain restaurant marketplace tightens and the fast-casual segment slowly moves toward a point of maturity, it will become increasingly important for chains to differentiate themselves and stand out in a crowded playing field,” noted Kevin Schimpf, industry research manager at Technomic. “Look for chains to engineer success by reaching further into the breakfast daypart, spotlighting novelty menu offerings to generate customer interest, and by embracing the off-premise market and making smart investments in ordering technology.”
Disappointing May
May was a disappointing month for chain restaurants by most measures. Same-store sales were down -1.1 percent, which represents a 0.1 percentage point drop from April. The industry has not reported a month of positive sales since February of 2016. These results come from data by TDn2K™ through The Restaurant Industry Snapshot™, based on weekly sales from over 27,000+ restaurant units, 155+ brands and representing $67 billion dollars in annual revenue.
Same-store traffic growth was -3.0 percent in May, a 0.2 percentage point improvement from April. Although traffic results improved from prior month, the growth in check average was lower than it has been in recent months, causing the fall in sales growth vs. March and April.
“The industry is clearly still struggling, but there is some optimism based on the latest results,” expressed Victor Fernandez, Executive Director of Insights and Knowledge for TDn2K. “Both sales and traffic growth quarter-to-date at the end of May show improvements over the first quarter and the second quarter is currently on track to post the best results we’ve seen for the industry since the third quarter of 2016.”
“Additionally, restaurant sales were relatively soft last year, and the easier comps should help results,” he continued. “However, at this point, we believe the most likely scenario for the current quarter will be an improvement over recent quarters, while still suffering negative sales given the current consumer spending trends.”
Slow Economic Growth & Consumer Spending
“With little happening in Washington to alter the landscape for growth, it appears as if the economy will again expand this year at the same pace it has averaged for the past seven years, which is 2.2 percent,” explained Joel Naroff, President of Naroff Economic Advisors and TDn2K Economist.
That is enough to continue driving down unemployment rates and putting greater pressure on firms trying to expand and hire new workers. Wage gains are still accelerating slowly, though, limiting household spending power. Recently, there has been an upturn in retail spending on most goods and services. That stands in stark contrast to the continued decline in sales growth at restaurants. Consumers appear to be maintaining their spending at restaurants but increasing it for other goods and services. This change in consumer spending patterns was identified about a year ago and how much longer it will continue is unclear.
Catering, Delivery & Drive-Thru: Opportunities for Growth
While overall sales continue to be a challenge for most of the industry, there are pockets of opportunity that some brands have capitalized on to boost performance. Dine-in sales have been negative year-to-date, but to-go is up 2.9 percent. Sales are also up in catering, delivery and drive-thru.
From a day part perspective, breakfast and mid-afternoon sales offer continued opportunities for growth, while lunch and, especially, dinner sales continue to stumble.
Industry Segment Performance
May sales were weak across all segments. Only the fine dining segment was able to achieve very small positive same-store sales growth during the month. The second best performing segment during May was quick service. That soft performance notwithstanding, the best performing segments continue to be those with the lowest and highest average guest checks. “Dining experience on one end and value and convenience on the other seem to continue to be key components of restaurant sales performance based on current consumer spending trends,” said Fernandez.
The weakest performing segment in May was casual dining. This was a bit unexpected since the segment showed improved performance during the first four months of 2017 after lagging the industry for several years. Casual dining has added a modest number of new units, but same-store sales declines have contributed to its overall loss in market share.
Despite weak sales results year-to-date, fast casual continues to win the market share battle. It gained the most share in the first quarter of 2017 compared with the same quarter a year ago. Aggressive expansion has driven total sales growth, but increased competition and market build-out have undoubtedly impacted same-store sales for the segment. The only other segment that gained market share year-over-year was quick service.
Retention and Staffing Still Plaguing Restaurants
In addition to what they are facing in terms of falling guest counts and consumer spending, strong challenges continue to confront restaurants in both staffing and retaining enough qualified workers. TDn2K’s People Report Workforce Index™ continues to indicate that restaurant operators are pessimistic regarding the difficulty of recruiting in the upcoming quarters. Part of the problem is that hiring for new restaurant positions has started to pick up again. The number of employees in the chain restaurant sector increased by 1.9 percent during April compared with a year ago, up from 1.5 percent growth recorded in March. The other issue affecting staffing is rising turnover.
Turnover rates for both hourly employees and management staff increased again during April. “The turnover numbers that we are reporting are stunning,” said Joni Thomas Doolin, TDn2K CEO and founder of People Report™. “Many of the brands that we track are already facing unsustainable levels of staffing vacancies. Most alarming is the fact that over 70 percent of employees are leaving voluntarily as opportunities for better work increase.”
Meanwhile the overall labor market nearing full employment doesn’t hint at relief for operators any time soon. The consequences of turnover are well documented by TDn2K. Not only does it impact service levels and guest satisfaction, which correlate to traffic and sales, but it is also a huge source of additional costs hurting the bottom line. According to a recent study by People Report, it costs on average about $2,200 to replace a single restaurant hourly employee, while the cost of turnover for all levels of restaurant management is on average about $15,000 per manager. “The companies who are leading in the marketplace are starting by winning in the workplace. Being a great employer has never been more important,” stressed Doolin.
Opportunities in Business Dining
For the second consecutive year, Dinova, Inc., and The BTN Group have partnered on a joint industry research study. Once again, the research finds that business dining is one of the more undermanaged areas of the corporate expense budget. Business dining spend historically has represented around 10 percent of overall annual T&E spend, but 44 percent of respondents indicated it represented 11 percent or more this year. This increase in spend offers the opportunity for significant cost savings efforts on the part of corporations nationwide.
According to the survey, 49 percent of respondents reported that his or her company spent $1 million or more on meals and entertainment in 2016. This number increased 9 percent over 2016 survey results. Despite the economic downturn in consumer spending, business dining continues to deliver high-margin guests to restaurants around the country. With the high amount of money rolling through corporate T&E on business dining spend, there’s an opening to better manage the expense.
The business dining expense comes in a variety of ways, including out-of-town travelers, marketing and events, client entertainment, internal business catering and private dining. When asked to choose all restaurant types that are most frequented by business employees eating on expense accounts:
- 45 percent said fast-casual
- 26 percent said independent restaurants
- 18 percent said chain-dining establishments
- 15 percent said quick-service restaurants
When asked what percentage of meals and dining expenditures occur in employees’ home market(s) versus business travel, only 10 percent of respondents indicated that 50 percent or more meal expenses are at home while 24 percent indicate less than 10 percent of meal spend is in home markets.
Similar to last year, 46 percent of respondents reported they have yet to focus on dining spend as an area of savings significance. And when it came to how often meal expenditures are reported to management:
- 42 percent said as requested by management
- 27 percent said monthly
- 16 percent said quarterly
- 7 percent said annually
- 18 percent said never
“Despite consumer traffic softening in the first quarter of 2017, business dining has increased year-over-year from 2015 to 2016, which makes it advantageous for travel managers to reclaim a portion of the overall company dining spend,” said Vic Macchio, Founder and CEO at Dinova. “We estimate business dining spend in the U.S. to be around $60 billion annually, and the ability to manage this spend is critical in overall T&E savings.”

“The research indicates that business travel and meal expenditures as a percentage of overall T&E are on the rise. Yet less than one-third of those surveyed have taken steps to better manage this spend category. Far too many corporations are missing opportunities for quantifiable savings on business dining expenses,” said Louis Magliaro, The BTN Group senior vice president and group publisher. “Leading companies are trying some very innovative tactics and we look forward to sharing more insights with our audience as this area matures.”
The Love List
Condé Nast and Goldman Sachs today released the 2017 Love List: Food, which expands the companies’ Love List Brand Affinity Index franchise to the food category. The first of its kind study identified three key trends:
Millennials want healthy snacks: 40 percent of brands that made the Love List are traditional snack brands, of those, 75 percent have a health focus like Angie’s & Noosa. Top attributes for all brand favorites include: “convenient,” “easy to find,” and “good tasting” – a clear snacking alignment.
Millennials are one-stop-shoppers: Focused on convenience, they are more likely to shop at retailers that offer a variety of options outside the food category, notably Wal-Mart is their #1 shopping destination and they are nearly twice as likely to shop at Target—a probable result of their new small format stores and redesigned layout with grocery front and center.
When price and quality are consistent, brand ethos is paramount:Consumers are focused on authenticity, transparency and connectivity when it comes to the brands they buy—successful brands are clear about what they stand for.
“Our Love List Brand Affinity Index is a strong indicator of next generation consumers’ attitudes toward the retail experience, and among millennial food enthusiasts, we’re seeing similar trends that surfaced in our fashion study – namely that brands shouldn’t underestimate the powerful combination of convenience and authenticity,” said Pamela Drucker Mann, chief marketing officer of Condé Nast. “Millennial consumers are looking for good value, convenience and consistency, which is why we’re seeing retailers like Wal-Mart and Target rise to the top of the list. However, when it comes to the brands they’re choosing to purchase, like Kashi, Clif and Bear Naked, millennials are looking to brands that connect with them and fit into their lifestyles.”
Additional micro findings include:
San Pellegrino is the #1 favorite brand for millennials
Yogurt brands are on the rise: Yogurt brands took three of the millennial Love List spots (Yoplait, Noosa, Fage) and four of the Next List spots (Oikos, Fage, Noosa, Chobani)
Millennials want premium coffee: Nespresso and Starbucks are #6 and #9, respectively.
The 2017 Food Love List was conducted as an aided brand affinity study among a national sample of 7,555 U.S. consumers, with a subset of 564 Condé Nast Millennial food-enthusiast consumers who expressed a high interest in cooking, dining and entertaining. The study prompted respondents with 35 attributes that they used to describe brands they purchased from a master list of 172 brands and 58 retailers. The following research reflects brand preferences and shopping behaviors ranked by percentage.
MILLENNIAL FOOD ENTHUSIASTS:
San Pellegrino 81 percent
Angie’s 77 percent
Haribo 71 percent
Duncan Hines 70 percent
Bertolli Frozen 67 percent
Nespresso 67 percent
Poland Spring 67 percent
Starbucks 67 percent
Yoplait 67 percent
Noosa 64 percent
Ferrero Rocher 60 percent
Justin’s Nut Butters 59 percent
Coca-Cola 59 percent
International Delight 57 percent
Kashi 57 percent
Dove Chocolate 56 percent
Pillsbury 55 percent
Clif 55 percent
Cheez-It 53 percent
Fage 52 percent
NATIONAL SAMPLE:
Nespresso 68 percent
San Pellegrino 59 percent
Starbucks 57 percent
Ben & Jerry’s 55 percent
Coca-Cola 55 percent
Noosa 55 percent
Angie’s 54 percent
Folgers 53 percent
Fage 51 percent
Peet’s Coffee 51 percent
Boar’s Head 51 percent
Stouffer’s 51 percent
Simply Orange 51 percent
Ghirardelli 50 percent
Cracker Barrel Cheese 50 percent
Hershey’s Chocolate 50 percent
Special K 50 percent
Tates 50 percent
Yoplait 49 percent
Haagen-Dazs 48 percent
MILLENNIAL FOOD ENTHUSIASTS:
Oikos 100 percent
Clif 100 percent
Udi’s 100 percent
Bear Naked 96 percent
Kashi 95 percent
Smartfood 94 percent
Birds Eye 93 percent
Ghirardelli 92 percent
Honest Tea 91 percent
Fage 91 percent
Justin’s Nut Butters 91 percent
Angie’s 91 percent
Yoplait 91 percent
Silk 90 percent
Noosa 90 percent
Chobani 89 percent
Amy’s 90 percent
Sabra 89 percent
Nature Valley 88 percent
V8 88 percent
NATIONAL SAMPLE:
Siggi’s 98 percent
Tates 98 percent
Sahale Snacks 95 percent
Odwalla 94 percent
Fage 92 percent
Justin’s Nut Butters 91 percent
Bear Naked 90 percent
Sabra 89 percent
Kashi 89 percent
Naked Juice 89 percent
Simply Orange 89 percent
Kind Snacks 88 percent
Oikos 87 percent
Popcorn, Indiana 87 percent
Noosa 87 percent
Weight Watchers 86 percent
SkinnyPop 86 percent
V8 86 percent
Cape Cod 86 percent
Chobani 86 percent
Feeding Teens
Hungry teens are home for the summer, and parents might want to brace themselves for a bumper grocery bill. That’s after new research finds the average parents spend an incredible $51,790 in footing the bill to feed a ravenous teenager.
The new national survey of 2,000 parents of kids between ages 13 and 19, conducted by Farm Rich, found:
- Teenagers devour more than $50k worth of food between the ages of 13-19
- $142 per week is the typical cost of feeding one teenager
- A third of parents say their teen is a ‘bottomless pit’
- Teen snacking goes up by 50 percent in summer
Feed Me!
There’s a lot of time and effort that goes into feeding a teen. Moms and dads average 1 hour and 33 minutes per week planning, buying and preparing meals – and this goes up as much as 25 percent during the summer break, as parents go the extra mile to battle the seemingly insatiable appetites of their teenagers. It’s no wonder then that 1 in 3 parents say their teen can only be described as a ‘bottomless pit’ when it comes to their appetite. In fact, 75 percent of parents admit they don’t know how their teens devour as much food as they do.
More Trips to the Store
In keeping up with the requests for food, parents make three trips to the grocery store per week – buying a third more food in the summer months when kids are out of school and more regularly scrounging for snacks. And 83 percent of parents make a point of stocking up on food as summer approaches to keep their voracious teens happily fed.
“Feeding teenagers can sometimes be a mental and financial challenge, particularly in summertime when kids are around the house more,” saidShannon Gilreath, Farm Rich Director of Marketing. “It’s no wonder parents can feel frustrated, with tensions rising at times, so stocking up on their kids’ favorite foods is just one way to help.”
Teen Hanger – For Real
Parents beware: “hangriness” is very real and shows up in the form of four, hunger-related mood swings, which hit the average teen every week.
Among parents, 57 percent admit their child is ‘quick to grumble’ about what’s available at home for them to eat.
It takes just an average of 4.5 minutes for a teen to start getting annoyed about not finding something they want in the house.
Five times per week a teen will ask: ‘What’s for dinner?’ and three times a week they’ll proclaim, ‘There’s NOTHING to eat in the house!’
More than 65 percent of teens regularly skip breakfast in the summer, but two thirds are more likely to raid the kitchen at night.
Perhaps then it’s no surprise that 58 percent of parents have admitted to having given in and ordered takeout or delivery when their teen refused to eat any meal or snack options that were already at home. And 75 percent of parents say they simply run out of inspiration sometimes when it comes to providing snacks and meals for the family.
According to the survey, pizza is the foodstuff kids are most likely to dive into while at home, followed by fruit and vegetables and cereal.
Top 10 Foods Teens Devour Most at Home
- Pizza
- Fruit/Vegetables
- Cereal
- Ice Cream
- Potato Chips
- Chicken Fingers/Strips/Nuggets
- Mac & Cheese
- Spaghetti
- French Fries
- Pancakes/Waffles
Why Go Local?
Malia Bacig, a 2017 graduate of the Fritz Knoebel School of Hospitality Management at the University of Denver, won the Global Tourism & Hospitality Conference’s champion prize for undergraduate research. She was awarded round-trip airfare, hotel accommodations and entrance into the prestigious conference at Hong Kong Polytechnic University.
Bacig took top honors for her paper, “Why Should Restaurants Source Local Food?”
“Honestly, I was pretty surprised when I found out I’d won, simply because it’s an international conference so any student in the world could apply as long as the paper had to do with tourism or hospitality,” Bacig says.
Driven by a passion for the restaurant industry, Bacig focused her research on consumers’ perceptions of restaurants that are described as using local foods. She found that when restaurants market their sourcing of food locally, consumers perceive the restaurants as engaging in more environmentally-sustainable practices, having more nutritious food, offering better prices and value, and being more conveniently located than restaurants that do not source their food locally.
“I found it particularly interesting that the phrase ‘local food’ seems to translate into a psychological sense of closeness for many people,” said Bacig.
Cheri Young, associate professor in the Fritz Knoebel School of Hospitality Management, who served as Bacig’s advisor on the project, cited the practical applications of Bacig’s research.
“The bottom line for restaurants in terms of this study is for them to highlight and leverage their sourcing of food locally,” she said. “If consumers perceive local food to be of superior quality, then the restaurants serving it may be the beneficiaries of a positive halo effect.”
Bacig’s future starts in July when she begins working full time at the Four Seasons Hotel in Denver as a food and beverage manager in training. While she hasn’t identified her dream job just yet, Bacig wisely understands the value of soaking up as much knowledge as possible at the start of her career.
“I don’t really know where I want to end up. I think for the next three to five years, I want to work in operations and grow my skill set, and then move on to something else,” she said, citing her interest in the wine industry, as well as in international vacation planning companies like Inspirato and Exclusive Resorts.
Food and Beverage Report
Despite shrinking profit margins over recent decades, the U.S. food and beverage industry is still developing, thanks to the adoption of consumer preference changes and newly emerging food trends. Details about the latest overview of the US food and beverage industry, major U.S. food and beverage manufacturers, and new trends in the vegan and vegetarian food sector are some of this week’s top stories on BizVibe.
The food and beverage industry in the U.S. makes up around five percent of the country’s GDP and 10 percent of its employment
Highlights for the food and beverage market in the U.S.
The food and beverage industry in the US makes up around five percent of the country’s GDP and 10 percent of its employment. According to the US Committee for Economic Development, there are over 27,000 food and beverage organizations and businesses in the US employing 1.5 million people, making the market highly competitive.
Emerging trends are changing the food and beverage market in the U.S. today. For example, general food preference in the US is becoming more health-conscious, demanding more natural and organic products. Sustainable food products from environmentally friendly and socially responsible companies are becoming increasingly popular among US consumers. Additionally, the growing demand for food and beverage E-commerce services is also shaping the industry.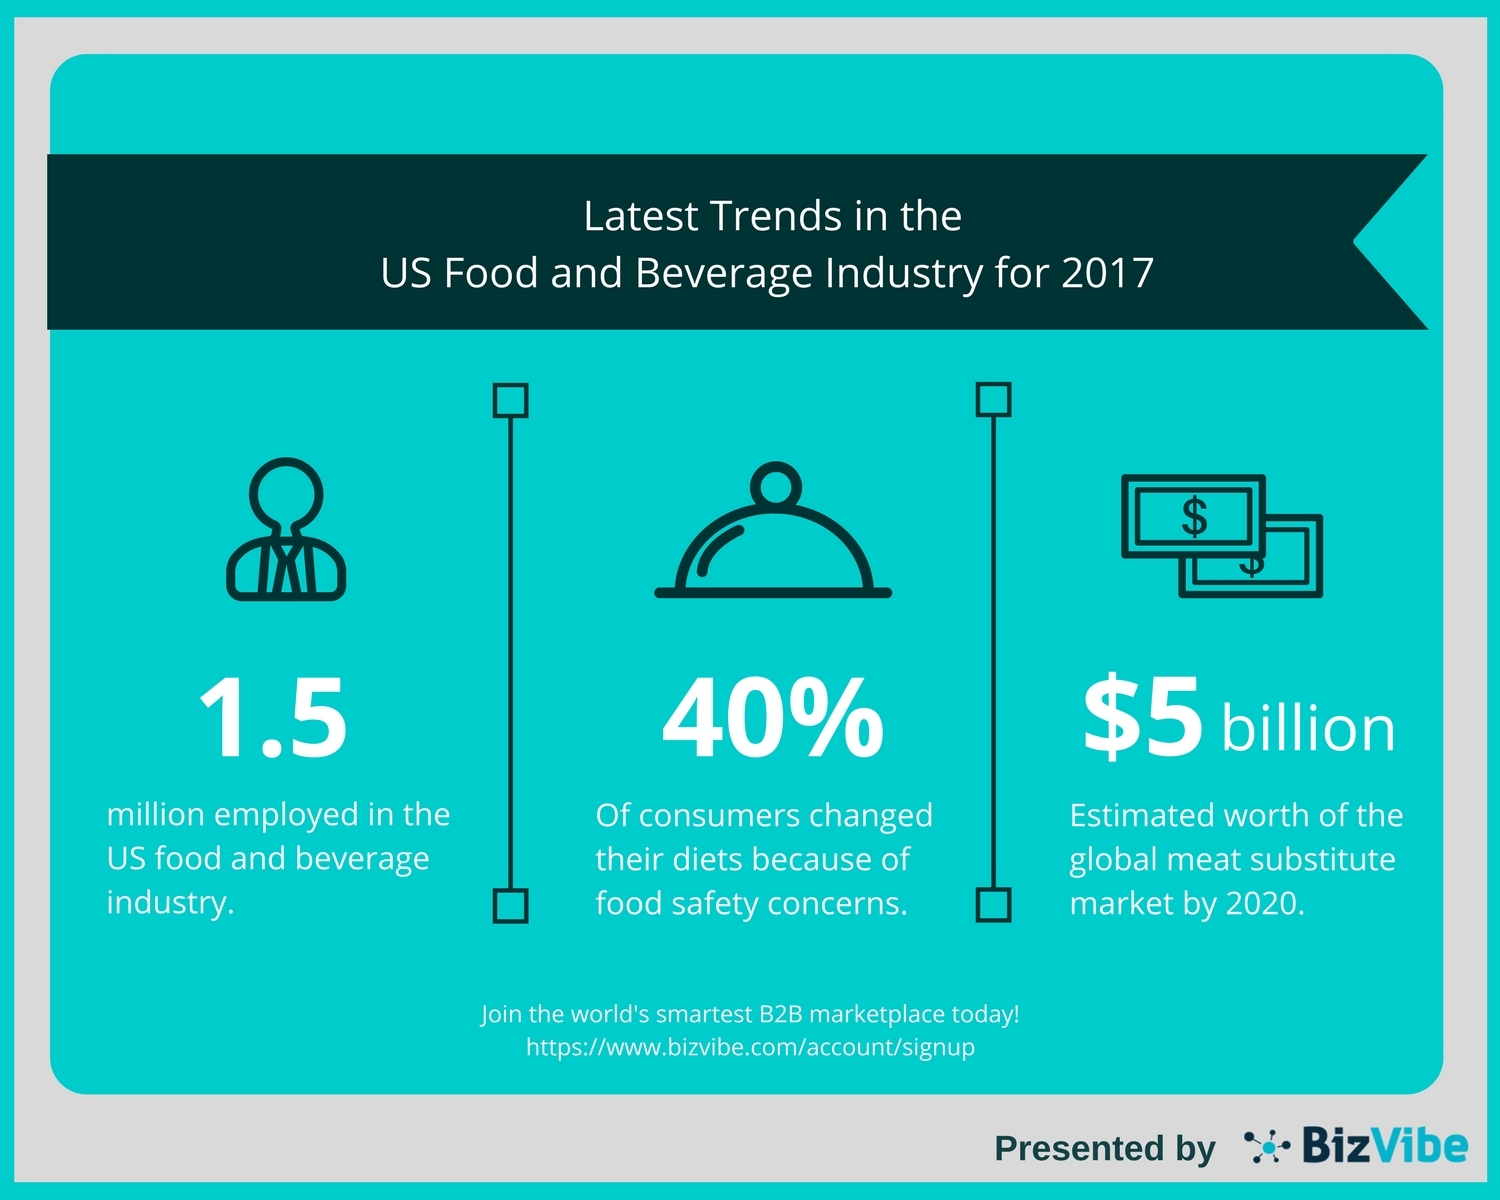
BizVibe’s list of the top 10 food and beverage manufacturers in the U.S.
The food and beverage market in the US is becoming more competitive as it grows, and the major food and beverage manufacturers in the country are highly influential in the industry. Here’s BizVibe’s list of the top 10 major food and beverage manufacturers in the US, featuring some of the largest food and beverage manufacturers in the country, such as Conagra Brands Inc., PepsiCo Inc., The Kellogg Company, The Coca-Cola Company, and Campbell Soup Company etc.
See the entire list of the top 10 food and beverage manufacturers in the US from BizVibe.
Top trends in the vegan and vegetarian food and beverage industry
As vegan and vegetarian diets become increasingly popular all over the world, the market has witnessed some ongoing trends that are shaping the growth of vegan and vegetarian food industry. Many fast-casual restaurants in North America and Europe are offering vegan and vegetarian options, and the number of vegetarian-only restaurants are also soaring.
Additionally, the global meat substitute market—which includes products like tofu, textured vegetable protein, seitan, and others – is also booming, and expected to grow at a CAGR of 8.4 percent until 2020, when it will be worth over USD 5 billion.
The Why? Behind the Dine
Since 2011, consumer spending in the foodservice channel has seen significant growth, with U.S. diners now spending, on average, $144 per month on food prepared outside the home — $25 more than two years prior — according to new research published in the third edition of The Why? Behind The Dine™. This annual report released by Acosta, a leading provider of integrated sales and marketing solutions for major food and non-food manufacturers, distributors and operators across all away-from-home meal channels, and Technomic, a fact-based research and consulting firm in the food industry, reveals this spend represents 35 percent of U.S. diners’ total monthly food budget, a jump of five percentage points from last year.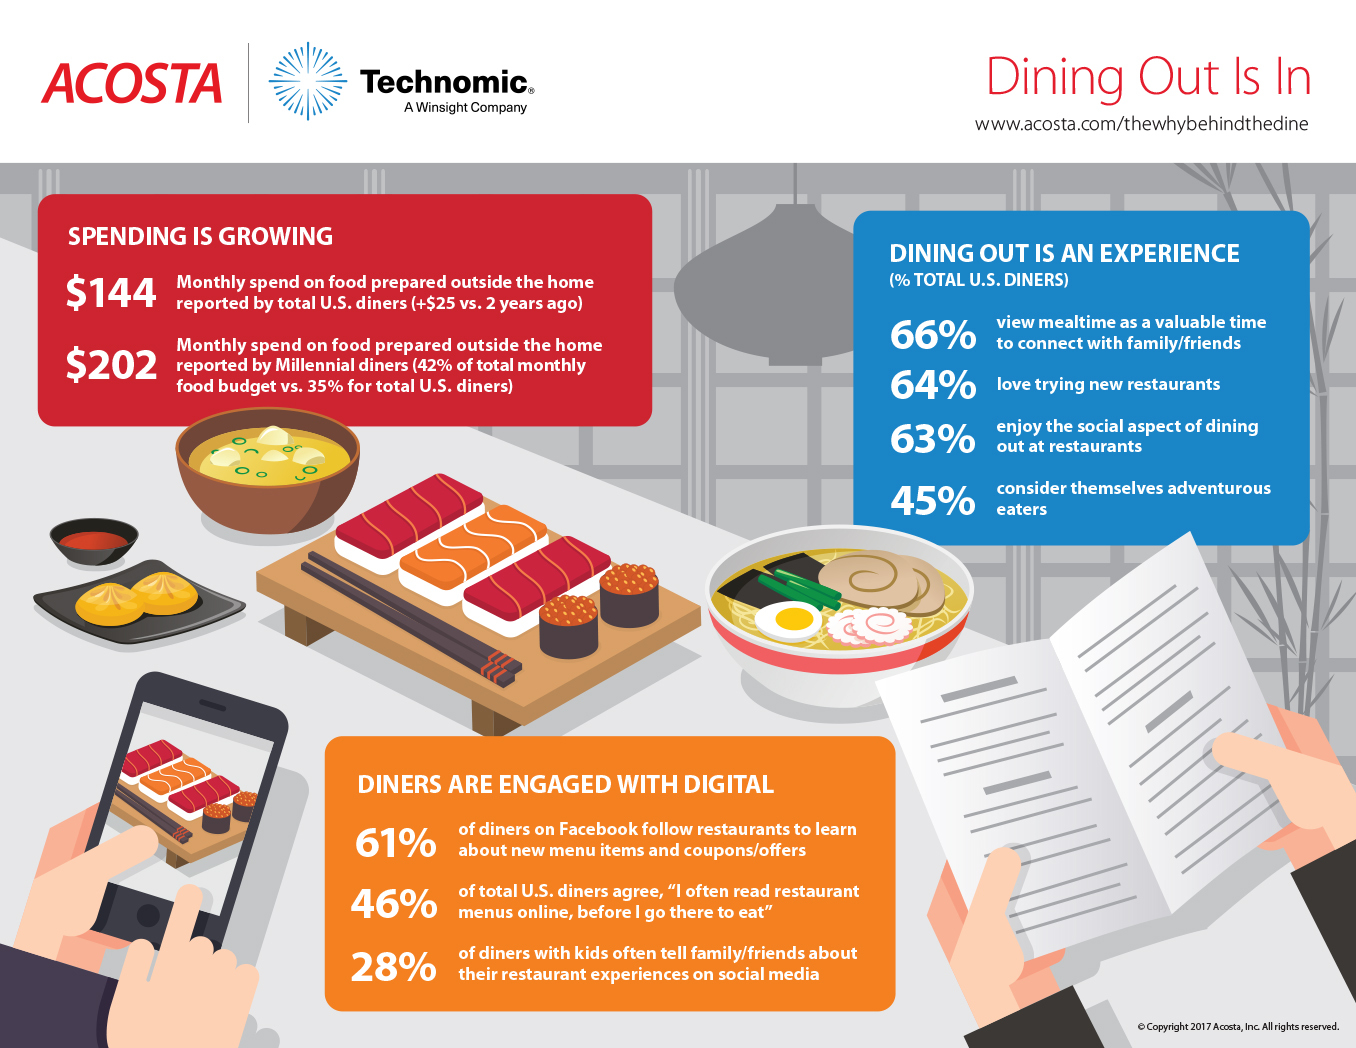
U.S. diners spend, on average, $144/month on food prepared outside the home, according to The Why? Behind The Dine.
“Along with an increase in spending on food prepared outside the home, the market is also seeing a surge in the variety of dining options available, from different types of cuisine to new ways to eat off-premise, such as ordering delivery from sit-down restaurants,” said Colin Stewart, Senior Vice President at Acosta. “More than anything, our research makes it clear that dining out is more than just a meal. It’s an experience for diners — and a growth opportunity for foodservice operators.”
“The rate of consumers dining at restaurants over the last year has leveled off, but look beyond face value and you will see diners’ dollars are now being spread across various out-of-home channels, not only concentrated at dine-in establishments,” said Jennifer Passmore, Regional Vice President at Technomic. “In fact, many diners anticipate spending even more on food prepared outside the home in the coming year, and they will have a full menu of dining options to choose from regularly.”
In addition to this growth in spending on food prepared outside the home, Acosta and Technomic’s The Why? Behind The Dine™ also unveiled the following foodservice trends:
More Than a Meal
Total U.S. diners surveyed agreed that time spent dining out is both valuable and enjoyable, even more so than the year prior, illustrating how experiential factors frequently drive dining decisions.
Sixty-six percent of diners agree they view mealtime as a valuable time to connect with family or friends.
Sixty-four percent of diners say they love trying new restaurants.
Sixty-three percent of diners agree that visiting restaurants is a form of entertainment for them.
Forty-five percent of diners consider themselves adventurous eaters.
Today’s Diner
Spending on food prepared outside the home varies greatly across generations, with Millennial and Gen X diners taking the lead.
Forty-two percent of Millennials’ monthly food budget is spent on food prepared outside the home, more than any other generation. This is seven percentage points above the percent of the monthly food budget spent by total U.S. diners on food prepared outside the home.
Thirty-five percent of GenXers’ monthly food budget is spent on food prepared outside the home.
Over the next year, 53 percent of Millennial diners plan to eat more meals outside the home.
Options Abound
Dining at restaurants remains the most popular format for eating out, but compared to the year prior, more diners report using carryout, delivery and drive-thru options, with convenience being a primary motivator.
The rate of U.S. diners who ate-in at a restaurant’s dining area in the past three months has remained steady year-over-year at 82 percent.
Seventy percent of diners ordered carryout from a restaurant over the past three months, while 67 percent ordered from a drive-thru, and 50 percent ordered delivery food in that same time period.
Fifty-six percent of Millennial and Gen X foodservice dollars are being spent “off-premise” (such as through carryout or delivery).
Social Influencers
The digital world serves as a catalyst for dining decisions, as U.S. diners research options online, and continue the conversation on social media by posting reviews of their experiences.
Forty-nine percent of diners look for coupons/offers online for restaurants.
Forty-six percent of diners often read restaurant menus online before going there to eat.
Sixty-one percent of diners on Facebook follow restaurants to learn about new menu items and for coupons/offers.
Twenty-eight percent of diners with kids indicate they often tell family and friends about their restaurant experiences on social media, with many including photos of their meals.
“There’s no question that dining out is in,” added Stewart. “However, restaurant owners and foodservice operators need to consider what they can offer diners beyond good food. This can include focusing on factors that create a unique dining experience by differentiating elements such as the atmosphere, convenience and ways to connect with others.”
The third edition of The Why? Behind The Dine™ study was fielded in December 2016 in partnership with Technomic Inc., using a random sample of 1,500 U.S. diners. To access the full report, visit www.acosta.com/thewhybehindthedine.
Being Transparent
FoodLogiQ and 1WorldSync published a survey that reveals supply chain transparency by food companies is a critical driver in consumer purchasing decisions and brand loyalty. Commissioned by FoodLogiQ, A Food Company’s Guide to What Consumers Care About in the Age of Transparency found that 54 percent of respondents want as much information as possible on the label, and nearly 40 percent want country of origin, allergen alerts and GMOs all identified on the label.
For food companies to provide this transparency and maintain their customers’ loyalty, they need full end-to-end supply chain traceability technology. This technology centralizes their data, creating a single source of truth to enable consumers to make informed decisions about food safety and compliance issues.
“Food companies are aware that consumers are demanding transparency but it can still be a struggle to modernize their supply chain processes,” said Ken Yontz, Global Vice President of Transformation Management of 1WorldSync. “Starting with data synchronization through 1WorldSync’s product content exchange network coupled with FoodLogiQ’s traceability and supply chain management technology allows the food industry to meet this demand and empower consumers to make safer, more informed decisions about the food they eat.”
“Building a culture of transparency that is focused on safety and quality can be an incredible marketing advantage and give food companies an edge over competitors,” said Dean Wiltse, CEO of FoodLogiQ. “The 1WorldSync – FoodLogiQ partnership enables food companies to be as transparent as possible with the path their food takes from farm to table while meeting regulatory requirements.”
Key findings from the FoodLogiQ survey include:
- Over 50 percent of respondents expect food companies to fully address a recall or foodborne illness within one to two days.
- If a brand/restaurant that consumers like experiences a recall leading to consumer sickness, nearly 25 percent of respondents admitted they would never use the brand or visit the restaurant again. Thirty-five percent of respondents will avoid this company for a few months and only maybe return after the issue has been fully resolved.
- Eighty-eight percent of respondents across all demographics – from Millennials to Boomers – are willing to pay more for healthier foods including those that are GMO-free, have no artificial coloring/flavors and are deemed all natural.
Food Production Impact
Food production results in hidden impacts for people and planet. Financial auditor EY and sustainability consultant Soil & More have now developed a method for small and medium-sized enterprises to calculate these hidden or’external’ costs. To illustrate the method, they calculated the impacts of organic distributor Eosta for nine types of produce and the company as a whole. For soil and health impact, large differences were found between organic and non-organic production. The ‘True Cost Accounting in Food, Farming, and Finance’ study calculated the cost of water pollution, pesticide exposure, greenhouse gas emissions, and soil erosion for several types of produce. A comparison was made between organic products and non-organic products. The report includes an Integrated Profit and Loss statement for Eosta, one of the first to be published for a SME company worldwide.
Volkert Engelsman, CEO of Eosta, presented the report to Peter Bakker, President of the World Business Council for Sustainable Development. Bakker commented: “True Cost Accounting changes the definition of profit and tackles perverse incentives. I predict that it will seriously affect the valuation of companies and their access to capital within a few years.”
Volkert Engelsman added: “We need TCA to empower consumers and stakeholders, including the finance sector, to act responsibly and make informed business decisions. It’s a game-changer.”
One of the findings is a difference between organic and non-organic products in health costs as a result of pesticide application. The study combined data from Danish scientist Peter Fantke, the European Food and Safety Authority, and the EcoInvent database to determine the effects of pesticide exposure. The WHO provided the metrics to monetize health impacts. The difference was biggest for apples from Argentina-with an advantage of the organic variety of €0.19 per kilo.
The soil erosion difference was significant as well; on average, organic produce had a positive impact in terms of cost while conventional production had a negative impact. At a consolidated Eosta level, the difference for erosion was €1.8 million.
Keep Loyalty Alive
Valassis, a leader in intelligent media delivery, shares tips for marketers and millennials, keeping in mind this consumer segment’s unique preferences and need for a budget-conscious lifestyle upon graduation.
College graduates are often faced with a new set of financial responsibilities as they prepare to enter the workforce, including rent, utilities and student loans, for starters. For those who are accustomed to convenient amenities in their dorm rooms and dining halls, new tasks like weekly grocery shopping and home maintenance may have a significant impact on their bank accounts.
“As college graduates embark on life’s next adventure, they will inevitably establish new shopping and eating habits,” said Curtis Tingle, chief marketing officer, Valassis. “Marketers have an opportunity to spark new relationships with these young consumers by encouraging them to try a product or visit a local store through relevant offers as a first step. Millennials are known for their tech-savvy mindset, but as research has shown, they aren’t exclusively reachable via digital channels – print strategies still play a key part in influencing their path to purchase.”
For marketers who want to reach millennials as they transition to post-college adulthood, Valassis provides the following insights:
Offer coupons online and offline. Marketers should ensure a robust, integrated strategy is in place, as 94 percent of millennialsuse coupons when purchasing consumer packaged goods. Keep in mind that 91 percent of millennials use paper coupons – received in the mail, newspaper, in store or printed from a computer – and 89 percent use paperless discounts, via their smartphone or downloaded to a loyalty card.
Activate via mobile. Mobile is obviously critical to any strong marketing plan as consumers – especially millennials – spend more time on their devices. Through use of location-based targeting, local businesses in the restaurant, entertainment, retail and beauty industries – among others – can offer convenient, relevant messages and deals that reach and activate consumers at the right time.
Don’t let your loyalty strategy be an afterthought. It’s important to retain your existing customer base, as it costs five times as much to attract a new customer than to keep an existing one. Loyalty programs can keep customers coming back, as proven by The 2016 Bond Loyalty Report, which cites that 81 percent of consumers are more likely to frequent a business that has a loyalty program and 73 percent would recommend brands with good loyalty programs. See Valassis’ tips on driving brand loyalty for lasting customer relationships: Top 10 Loyalty & Local Marketing Practices.
High on Hydroponic
Transparency Market Research (TMR) states that leading companies in the global hydroponic vegetables market are AMCO Produce Inc., Village Farms International, Inc., Soave Enterprises LLC., and Thanet Earth Ltd. As the competition intensifies, these companies are staying focused on investing in advanced technologies such as adopting computer-controlled drip irrigation systems and shrink wrapping among others.
According to the research report, the global hydroponic vegetables market is expected to be worth US$12,106.5 mn by the end of 2025 from US$6,934.6 mn in 2016. During the forecast period of 2017 and 2025, the global market is expected to register a CAGR of 7.5 percent. Out of the various vegetables, the lettuce segment is projected to lead the global market in the coming years as it is poised to expand at a CAGR of 6.6 percent during the forecast period. From a geographic point of view, the Europe hydroponic vegetables market is slated to acquire a share of 52.3 percent by the end of 2025 in the global market.
The growing demand for locally grown vegetables has been instrumental to the flourishing hydroponics vegetables market across the globe. Owing to this reason, several farmers are catering to the burgeoning need for local vegetables, which is a far more profitable business. The freshness of hydroponically grown vegetables and the demand for organically and naturally grown food items are expected to propel the global market. The emerging trend of farmer’s markets, increasing number of community-sponsored agriculture initiatives, and growing adoption of direct-to-consumer distribution are expected to work in the favor of the global hydroponic vegetables market. The increasing inclination of retailers to source vegetables that are locally-grown as they are better in taste, do not need additional transportation costs, and longer shelf life is expected to favor market growth.
The growing concerns about food security due to increasing population and rapid urbanization have also become important in propelling the rise of the global hydroponic vegetables market. The growing challenges pertaining to cultivation of grains and vegetables in conventional ways has made farmers take a serious interest in hydroponics. Thus, several countries are investing in developing vertical hydroponic farms that are likely to be cost effective in the coming years. The promise of food safety and reduced exposure to pathogens has also titled attention toward hydroponics.
On the flip side, the global hydroponic vegetables market is being hampered by the high capital investments required for developing these modern farms. This impact is especially severe in developing countries of the world. The exorbitant cost technology, consultations, and maintaining greenhouses is likely to discourage market growth. Additionally, the high energy requirement as compared to traditional farming is likely to restrain the market from achieving its full potential.
Plant-Based Fears
According to a just released consumer survey, flavor and texture are the top reasons people enjoy cooking with meat, and the fear of missing that is the reason fewer people follow a plant-based diet. Conducted by the California Walnut Board1, the study also revealed meat remains the focal point of plates in more than half of weekly meals. However, because of increased concern about nutrition and health, people want to add more plant-based foods to their routine. The simple solution is to create meatless meals that maintain the qualities they enjoy in meat. To do so, consumers are less interested in tofu and soy products as plant-based options and instead turn to walnuts, legumes and mushrooms.
“Just like meat, plant-based foods offer an array of textures and can be seasoned countless ways to take on a variety of flavor profiles,” said Frances Largeman-Roth, registered dietitian nutritionist and New York Times best-selling author. “Consider the texture you’d like to create when selecting a meatless alternative and add the same bold flavors you enjoy in more meaty recipes to create satisfying plant-based versions of the meals you love.”
According to the survey, 83 percent of Americans are open to making meatless dishes, particularly if they have a similar taste or texture to meat-centric dishes. Walnuts, mushrooms and legumes, including beans, lentils and peas, rise to the top as the three foods they’re willing to try in meatless meals. Walnuts, specifically, are an appealing option for their texture (70 percent), flavor (65 percent) and nutrients (62 percent).
“Walnuts are a great option to use in plant-forward dishes because they have a wonderful crunch and mild, nutty flavor that adapts well to an assortment of recipes,” said Largeman-Roth. “They also provide a range of nutrients that are important for good health. Walnuts are the only tree nut predominately comprised of polyunsaturated fats2, including an excellent source of the plant-based omega-3 ALA.3”
Grab Healthy
The global healthy snack market is expected to reach USD 32.8 billion by 2025, according to a new report by Grand View Research, Inc. Rising awareness about healthy snacking habit along with the easy to use, and mobility of product is further propelling the market growth.
The hectic lifestyle and changing demographics with the rise of young population in Asia Pacific region are some of the factors positively influencing the market. In addition, the preference for healthy snacks over the traditional ones is increasing as it is convenient to carry and consume. These properties are expected to have a positive impact on the industry.
The growth in demand for single serve bars of cereals, granola, nuts & seeds, and, meat is rising due to growing working class, which is engaged in long working hours, and prefers nutritious snacks in between meals. The booming retail sector, coupled with efficient supply chain, and creative marketing strategies, is expected to augment market growth over the forecast period.
The nuts & seeds, and dried fruit segment are expected to collectively account for 27.2 percent of the global market share in 2025. The demand for these products is attributed to the immediate energy requirement fulfilled by the consumption of these products. In addition, the availability of various flavors is projected to boost the demand for these products over the forecast period.
Europe was the leading region due to changing perceptions about snacking among the younger consumers. The younger population is demanding more nutritive function from the snacks, which is leading to growing reliance on snacking as a healthy alternative. The availability of a variety of healthy snacks options is leading to the expansion of the overall market in this region.
Further key findings from the report suggest:
- The market is expected to grow at a CAGR of 5.1 percent from 2017 to 2025 on account of increasing awareness about healthy snacking habits. Cereals and granola bars will witness fastest growth in terms of revenue at a CAGR of 6.3 percent from 2017 to 2025 owing to its nutritious contents.
- Europe market is expected to witness significant development and was valued at USD 7.3 billion in 2016 on account of rising demand from the increasing younger population
Key participants include General Mills, Mondelez International, Inc., PepsiCo Foods, Nestlé S.A., B&G Food Inc, The Kellogg Company and others. These companies are focused on increasing their global presence using product differentiation strategies
In January 2017, General Mills, Inc., launched a new product series to address the increasing demand of snacks across the globe. The product range includes popular company brands such as Nature Valley Granola bars, Haagen-Dazs ice cream, Yoplait Custard in healthy snacks category.
Craft Beer European Growth
Technavio market research analysts forecast the craft beer market in Europe to grow at a CAGR of more than 11 percent during the forecast period, according to their latest report.
The market study covers the present scenario and growth prospects of the craft beer market in Europe for 2017-2021. Craft beer is the variant of beer that is brewed in a traditional fashion and is usually produced in small quantities. The report also lists eight different variants of craft beer, which includes Indian pale ale (IPA), amber ale, lager, bocks, wheat, fruit beer, seasonal, and pale ale. The global craft beer market is primarily concentrated in the Americas and Europe, with the US being the largest craft beer producer, followed by the UK.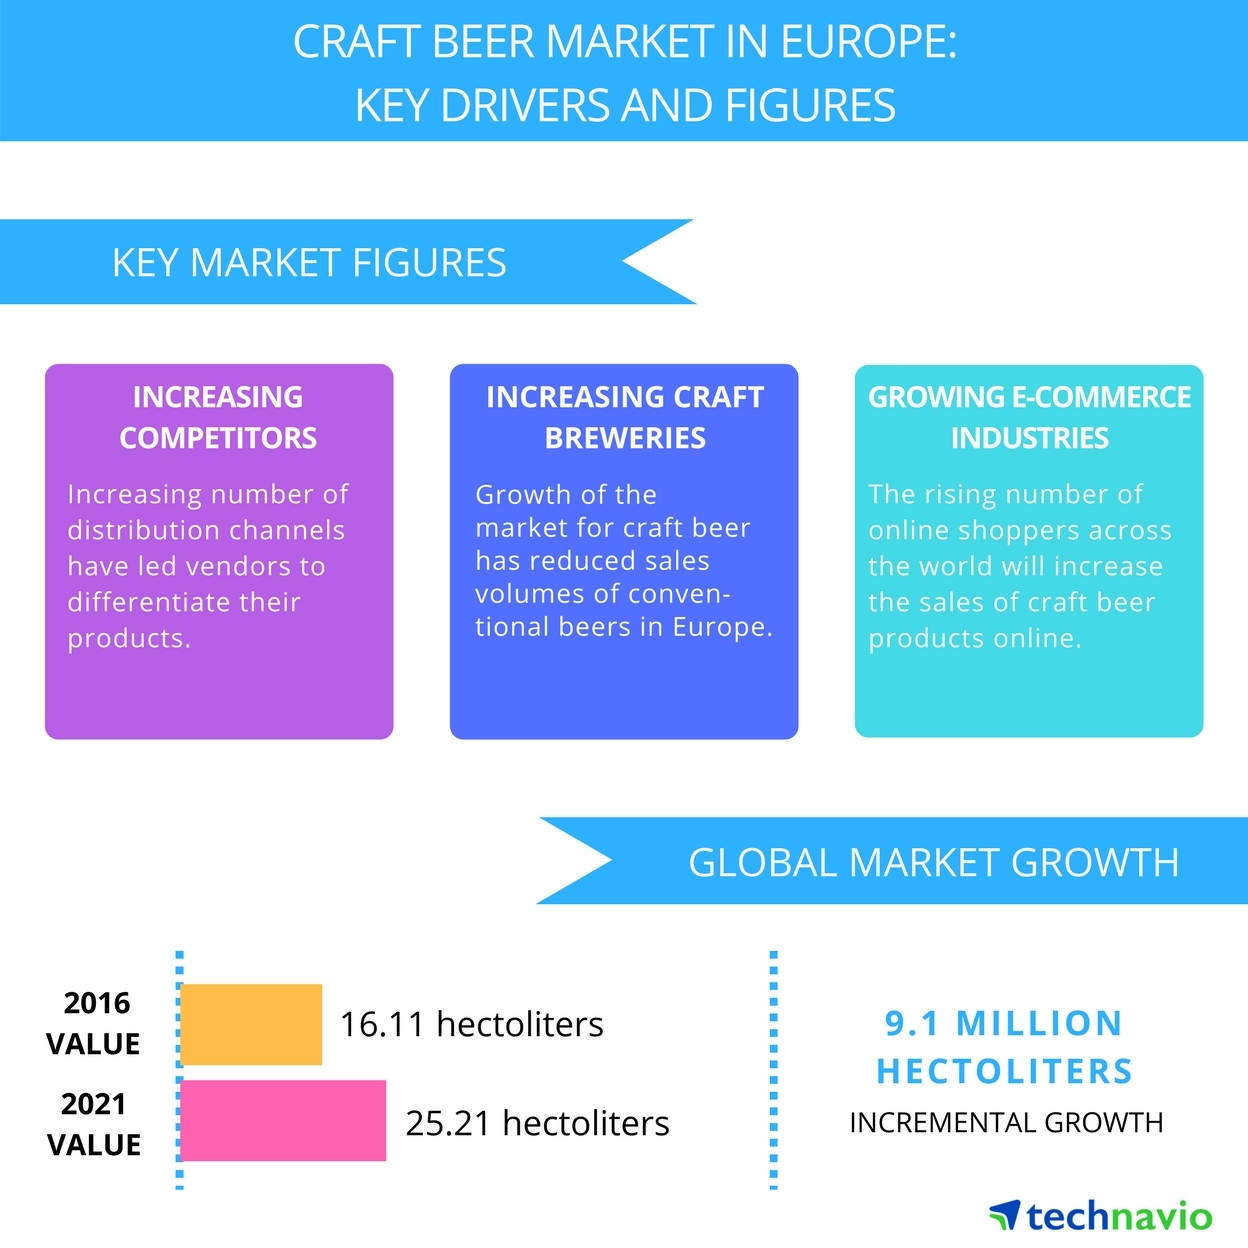
According to Manjunath Reddy, a lead analyst at Technavio for alcoholic beverages research, “Rising popularity of craft beer, increasing disposable incomes of consumers in Eastern European economies, and growing awareness about the health benefits of consuming beer are major drivers that will impact the growth of the beer market in Europe during the forecast period.”
With the number of microbreweries and other distribution channels increasing exponentially in Europe, it has become imperative for vendors to differentiate their products from those of their competitors. The most important parameters for product differentiation are the application of innovative packaging techniques and attractive labeling. The two most popular types of packaging variants are bottles and cans, with bottles being the dominating packaging variant. However, in recent years, the popularity of cans has increased, and many consumers have shown an inclination toward using cans.
Rising number of microbreweries in Europe
Europe has witnessed a significant growth in the number of microbreweries operating in the region in the last five years. The number of microbreweries grew by nearly 73 percent in the last five years. A microbrewery is defined as a brewery that produces only limited quantities of beer, primarily specialty beer, and craft beers. The UK and Germany have the most number of microbreweries in Europe.
With the rising number of microbreweries in the region, the competition in the craft beer market in Europe has intensified over the years. This has proved to be beneficial for consumers in terms of quality, price, and flavors. In 2015, Europe had 5,830 microbreweries operating in the region.
Increasing mergers and acquisitions of small breweries by global beer vendors
Europe’s microbreweries and craft breweries are continuing to fuel the craft beer revolution in bars, pubs, and liquor stores across the region. With 5,830 microbreweries and 4,486 regional craft breweries in 2015, craft beer now represents close to 12 percent of the beer market in Europe in terms of revenue.
“The growth of the market for craft beer has also brought down the sales volumes of conventional beers in the region. This has forced many global vendors in the beer industry to acquire small craft brewing companies to enter the craft beer market,” says Manjunath.
Animal Welfare Concerns
More than half of U.S. consumers (58 percent) are more concerned about food animal welfare than they were just a few years ago, according to market research firm Packaged Fact’s recent report, Animal Welfare: Issues and Opportunities in the Meat, Poultry, and Egg Markets in the U.S. In the report, “animal welfare” encompasses key areas including housing, handling, feeding, and slaughter.
Rising interest in animal welfare issues is due in part to consumers’ increased concern about the safety of their food, and the growing belief that if an animal is raised in healthy circumstances, then its meat and dairy products will be healthier, as well as better-tasting and more nutritious. Although the common assumption that organic standards currently include animal welfare provisions is a misconception, organic foods such as grass-fed beef succeed precisely because of the consumer assumption that organic certification in meat, poultry, and dairycase foods is inherently linked to animal welfare.
Consumers have different levels of understanding and trust when it comes to product claims associated with animal welfare. Packaged Facts survey data reveal that 19 percent of consumers only have a general idea of what ‘grass-fed’ means, with another 19 percent reporting they don’t have a good idea of what the term ‘certified humane’ means. Only a minority of grocery shoppers (33 percent) view themselves as well-informed about claims such as hormone/steroid/antibiotic free, cage-free, free-range, pasture-raised, and certified humane. Nonetheless, nearly two-thirds of consumers agree that humane treatment of animals raised for food should be a societal concern and a regulatory issue.
Food companies spanning the production and delivery spectrum, increasingly attuned to consumer as well as investor concerns, have been taking steps to improve the quality of life of the animals in their supply chains. Animal welfare organizations supported by consumers have been a driving force for change, though the decision to improve animal welfare is ultimately left to the individual company, whose response is often grounded in the desire to be competitive in a changing marketplace and proactively responsive to emerging trends. Pork producers are abandoning gestation crates, while egg producers are switching over to cage-free practices. Despite consumers’ varying levels of understanding the relationships between organic brand foods and animal welfare standards, new standards are being shaped by next-generation consumer expectations.
Processed Meat Market
According to the latest market study released by Technavio, the processed meat market in the US is expected to grow at a CAGR of almost 3 percent.
This research report titled ‘Processed Meat Market in the US 2017-2021’ provides an in-depth analysis of the market in terms of revenue and emerging market trends. This market research report also includes up to date analysis and forecasts for various market segments and all geographical regions.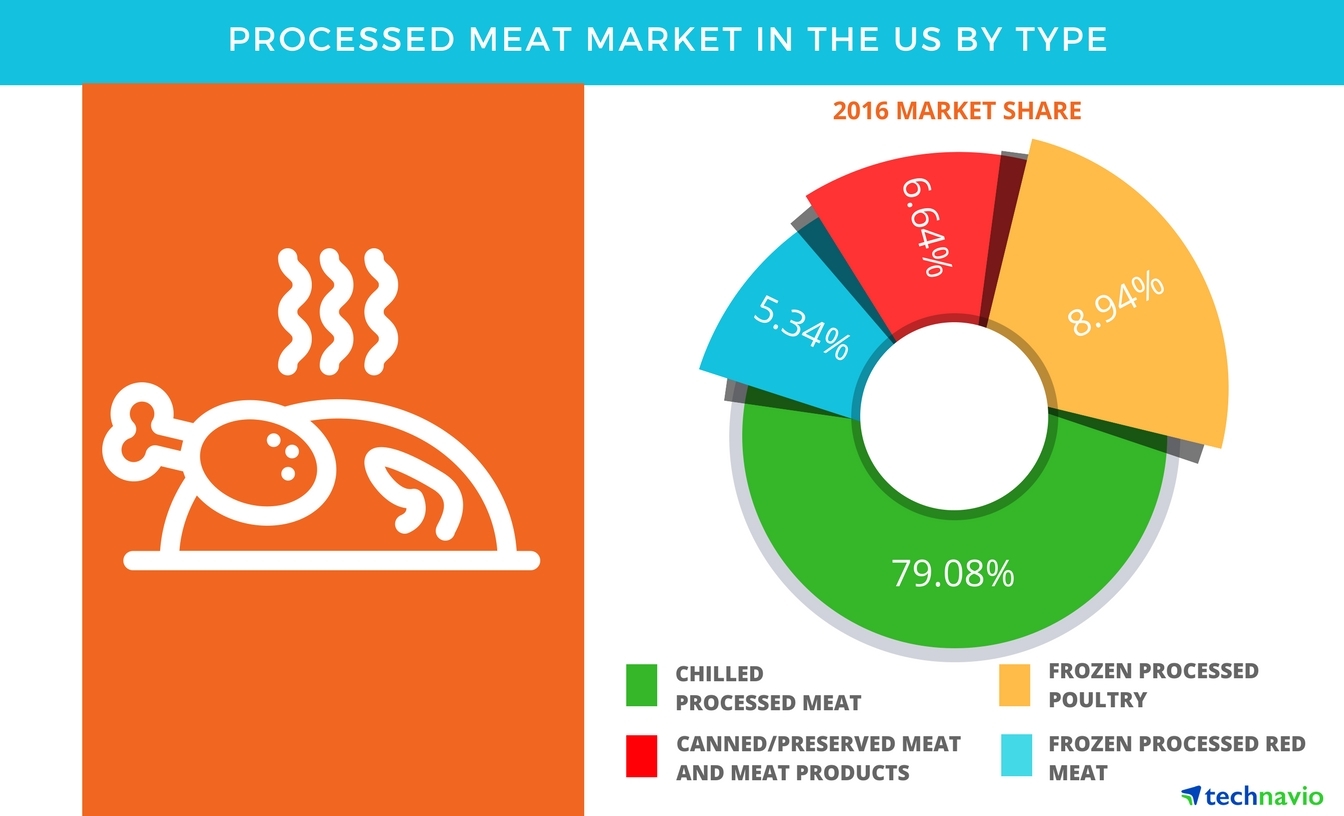
The processed meat market in the US is expected to grow at a steady pace during the forecast period. The market is driven by the demand for convenience food products among consumers. Health-conscious customers are keen on adding protein to their daily diet, and meat acts as an excellent source of protein.
According to Akash Pandey, a lead food research analyst from Technavio, “Pork sausages, beef sausages, and bacon are the most popular chilled processed meats in the US. An example of a product offered in the market is Chilled Natural Lamb provided by JBS under the brand name of Spring Crossing Cattle.”
Frozen processed poultry market in the US
The processed poultry market will grow at a steady pace during the forecast period is because consumers are experiencing a change in lifestyle and growing urbanization is also affecting the consumption patterns of the consumers. Frozen processed poultry has gained higher acceptance over the other meat such as pork and beef due to its high protein content and comparatively affordable price.
“Frozen processed poultry meat has a higher demand among consumers as it is less expensive in comparison to other processed meat products. Increased intake of poultry meat owing to its high protein content amongst health-conscious individuals is a key factor boosting the growth of the frozen processed poultry market in the US,” says Akash.
Canned/preserved meat and meat products market in the US
Canned meat can be stored for a longer duration of time than other meat variants and can be used when fresh ingredients are scarce. Canned/preserved meat products are less popular compared to frozen food products as consumers consider frozen meat products to be healthier, free of preservatives and additives, and fresh.
Canned/preserved meat products are facing competition from ready-to-eat frozen meat products. However, the canned/preserved meat market has started maturing in the US, leading to product commoditization.
Why We Snack
While consumers may be growing more health-conscious with their food choices, it seems there is still room for life’s little indulgences. New research from Mintel reveals that the top reason Americans say they snack is to treat themselves (50 percent) and more than one quarter (28 percent) agree that taste is more important than health when choosing a snack.
In addition to rewarding one’s self, snacking for self-care continues to be a popular motivator as nearly two in five (37 percent) consumers say they snack to give themselves a break during the day and 24 percent snack to relieve stress. What’s more, one in six (17 percent) Americans snack today in order to control their weight, up from just 10 percent who said they snack to help them lose weight in 2015.
Despite the propensity to indulge, health plays a key role in the types of snacks consumers eat. One third (32 percent) of consumers say the majority of snacks they eat are healthy and over one quarter (28 percent) say they are snacking on healthier foods this year than in 2016. In fact, snacks with health-related claims are among the fastest growing snack launches, with low/no/reduced allergen claims accounting for 46 percent of total new snack product launches in the US in 2017, an increase of 30 percent over 2013, according to Mintel Global New Products Database (GNPD).
While the percentage of Americans who say they snack has remained steady in recent years*, snack frequency is on the rise as those who say they snack two to three times per day increased from 50 percent in 2015 to 55 percent in 2017, while those who report snacking once per day decreased to from 29 percent to 24 percent over the same time period.
Not surprising, younger consumers are leading the snacking revolution as Millennials (aged 23-40) are the most likely to snack four or more times per day (25 percent), compared to just 10 percent of Generation X consumers (aged 41-52) and nine percent of those in the Baby Boomer generation (aged 53-71).
“The importance of snacking in America is undeniable and it is creating more and more opportunity for companies and brands as snacking frequency increases, particularly among younger consumers. While health is a factor for consideration in food and drink decisions, the majority of snackers do so for a treat, meaning even health-focused snacks should appeal with messages about enjoyment and indulgence. In recent years, brands have focused product innovation largely on cleaner formulations, highlighting an opportunity for innovative products with health attributes that appeal to health-conscious consumers,” said Beth Bloom, Associate Director of US Food and Drink Reports at Mintel.
Mintel research indicates that time of day has a strong impact on what consumers turn to for a snack. Snackers appear to be interested in starting the day on a high note, looking for snacks that are healthy (29 percent), light (23 percent) and energizing (23 percent), while sweet (30 percent), comforting (25 percent) and indulgent (22 percent) snacks are more sought after in the evening. When it comes to an afternoon pick-me-up, consumers are most likely to look for snacks that are healthy (26 percent), sweet (23 percent) and energizing (22 percent). This is also the time of day consumers are most likely to reach for a beverage as a snack, including 15 percent of snacking Americans, compared to 12 percent who say the same for the morning and 11 percent in the evening.
It seems opinions of what constitutes a snack are expanding as nearly two in five (38 percent) consumers agree that anything can be considered a snack and one in seven (14 percent) say they are snacking on ‘less traditional’ snack foods, such as sandwiches and cereal.
“Capitalizing on the snack craze goes beyond the traditional food categories that are commonly recognized for snacking,” continued Bloom. “One snack type does not necessarily fit all, highlighting an opportunity for brands to grow adoption in the snack market by creating products that align with the differing snack preferences throughout the day, as well as by positioning products as a good choice for snacking.”
When it comes to salty indulgences in particular, Mintel research reveals that the types of salty snacks** consumers eat depends on the occasion. While consumers are most likely to enjoy popcorn while watching TV or a movie at home (62 percent), the various types of popcorn available, such as caramel corn or microwavable, make it versatile as a snack for when consumers want to treat themselves (37 percent) or want something healthy (19 percent).
Meat snacks, on the other hand, are unique due to their functionality, as they are most likely to be eaten to satisfy hunger (43 percent), provide energy (26 percent), to eat on-the-go (35 percent) or to have something healthy (21 percent).
Overall, sales of salty snacks have grown 30 percent since 2011, reaching an estimated $11.2 billion in 2016, with growth primarily driven by innovation in the meat snacks and popcorn categories. Sales of meat snacks reached an estimated $3.3 billion in 2016, up 51 percent from 2011, while sales of popcorn increased by 39 percent to reach $2.4 billion.
“Despite competition from other snack foods, the salty snack market continues to grow at a steady rate. The functional benefits of meat snacks and the convenience and health halo of ready-to-eat (RTE) popcorn are driving strong growth in each category; however, this success is also due to increased flavor and format innovation. Brands are demonstrating that popcorn can be a platform for any type of flavor, with sweet flavors gaining popularity, while meat snacks are going premium and artisan,” concluded Caleb Bryant, Senior Foodservice Analyst at Mintel.
To learn more about The State of Snacking: What’s Happening in Foodservice and Retail, join Mintel’s expert food and drink analysts for a webinar on Tuesday, June 20, 12 p.m. PT/2 p.m. CT/3 p.m. ET. Register here.
Beef Jerky Sales on the Rise
Beef jerky sales grew by nearly seven percent last year, according to Nielsen. Meat snacks are second only to potato chips in the salty snack category, but potato chips posted only 1.7 percent dollar growth over the same time period.
“Beef jerky provides all of the convenience of a traditional savory snack with no cooking or refrigeration needed, but packs a punch of protein and essential nutrients that make it stand out on the snack aisle,” said Alisa Harrison, Senior Vice President of Global Marketing & Research for National Cattlemen’s Beef Association, a contractor to the Beef Checkoff.
A Booming Category
Research shows that nearly 75 percent of consumers crave healthier salty snack options1, with beef jerky outselling seeds, party mixes and pita chips – combined.2 As consumers eat fewer sit-down meals and snack more on the go, the demand for portable protein has never been higher with more than half of Americans wanting to add more protein to their diet.3
“Beef jerky is the most underrated component of a busy person’s life when trying to eat healthy,” said Michael Roussell, Ph.D., nutrition consultant. “It helps solve the tricky balance of how to get enough protein throughout the day when you live a hectic, on-the-go lifestyle because it’s extremely portable, compact and high quality. All my clients travel with beef jerky and I recommend it to enhance meals and snacks that are lacking protein.”
Science Backing Beef Jerky as Recovery Food
The need for healthy snacks on the go increases as consumers take to the outdoors during the summer. With race season kicking off, beef jerky also is a powerful tool post-race or workout. In fact, a 2015 study published in theInternational Journal of Sport Nutrition and Exercise Metabolism looked at beef jerky’s effect on hydration status and sodium balance of endurance runners and found that beef jerky as a recovery snack following an endurance bout was comparable to traditional carbohydrate-electrolyte beverages.
“Enjoying sources of high-quality protein, like beef jerky, soon after exercise can enhance training, maximize muscle health and get you ready for your next workout,” said Nancy Rodriguez, Ph.D., RD, FACSM, the study’s author. “An alternative to post-workout snacks that often contain high carbohydrates, beef jerky is a high-quality protein snack that provides your body with essential amino acids needed to build, maintain and repair muscle.”
Distilled Spirits Growth
The distilled spirits industry continued its impressive 19 straight years of growth, rising 2.7 percent in 2016 to 221.0 million 9-liter cases. Continued employment gains and wage increases have led to increased consumption of premium, quality products at home and on-premise. According to the Beverage Information Group’s Liquor Handbook 2017, consumers are spending more and drinking more – 5.8 million cases more than in 2016, to be exact.
The American straight whiskey category shows no signs of slowing down after a 6.2 percent increase in 2016. Premium brands continue to grow most rapidly as consumers show a willingness to trade up. As millennial consumers experiment within non-Bourbon segments of the whiskey category, imports are up as well. Canadian Whisky and Scotch rose 2.2 percent and 4.6 percent, respectively, in 2016, while Irish Whiskey saw its thirteenth straight year of double-digit growth, rising 15.0 percent to 3.6 million cases. After demonstrating strong growth last year and after years of negligible growth, the blended whiskey category fell flat again growing just 0.5 percent or 5.2 million cases.
Other distilled spirits categories saw mixed results in 2016. Tequila and brandy/cognac showed strong gains of 6.9 percent and 7.8 percent respectively. Vodka, whose growth rate has been slowing in recent years grew 2.1 percent to 74.3 million cases. But gin, rum and cordials/liqueurs showed little or negative growth. Rum consumption remains the second-largest spirit category, but decreasing volumes suggest consumers’ willingness to explore other categories.
In 2017, we expect consumers to continue that experimentation, especially as improving economic conditions raise disposable income. Millennials will continue to be the major force behind the growth of distilled spirits with their focus on quality products, perceived heritage and authenticity of legacy brands. Female and Hispanic consumers will represent growth opportunities for the industry now and into the future.
Food Safety Testing Market
According to the latest market report published by Transparency Market Research titled ‘Food Safety Testing Market’: Global Industry Analysis and Forecast 2017-2025′, globally the revenue generated from food safety testing has been estimated to be valued over US$ 658.5 Mn in 2017, which is projected to increase at a CAGR of 8.9 percent during the forecast period (2017-2025).
Various factors, right from the rising incidence of food contamination there is a growing demand for food safety testing by food manufacturers. Owing to increasing awareness about foodborne diseases and various technologically advanced techniques and equipment deployed for food safety testing, boosting market growth. The significant expansion of the food and beverage industry, coupled with the growth of the food service industry, has been the primary factor driving the growth of the global food safety testing market, by 2025 end
Over the last decade, key players in the market have emphasized on garnering the attention of the consumers by keeping pace with their ever-changing testing patterns. Product innovation to perform more accurate tests has seen an increasing demand from the supply side, to increase the brand appeal and also to provide better services, which is one of the most important parameters considered by consumers. Various macroeconomic factors such as rising disposable income and increasing food trade in Asia Pacific region and other developing regions are expected to fuel the demand for food safety testing over the forecast period. Diagnostic test products are primed for sturdy growth over the forecast period, aiding the expansion of the market. The growth of these products can be attributed to the increased inspection of food plants by regulatory bodies.
There are certain factors which might hamper the growth of the global food safety testing market such as lack of uniformity in global regulatory guidelines. Different regions have different guidelines for trading of consumer goods including food and feed, agricultural products, and other products. This is expected to adversely affect the growth of the global food safety testing market. Another factor adversely affecting the market growth is budget constraints. Food testing laboratories in developing countries allot low budget and resources due to budget constraints for upgrading food testing equipment and software.
By contaminants type, the global food safety testing market is segmented into pathogens, genetically modified organisms, chemicals and toxins, and others. Among all the segments, Pathogens segment is estimated to account for 42.5 percent of market Share, in the overall global food safety testing market, in 2017.
By end-use, the global food safety testing market is segmented into food, agriculture and environment. Among all the segments, food segment is expected to dominate the global food safety testing market by the end of forecast period. Factors such as Increasing awareness regarding genetically modified fruits and vegetables and increasing regulatory restrictions on GMO-derived foods are factors expected to drive growth of this segment over the forecast period.
By technology, the global food safety testing market is segmented into q-PCR and d-PCR. Among technology type, the d-PCR segment is expected to account for high CAGR in the market over the forecast period. q-PCR is expected to closely follow the d-PCR segment during the forecast period.
Some of the major companies operating in the global food safety testing market are Bio-Rad Laboratories, Inc., Intertek Group Plc, SGS SA, Eurofins Scientific SE, Thermo Fisher Scientific, Inc., ALS Limited. Laboratory Corp. of America Holdings, AsureQuality Limited, Bureau Veritas SA, and Scientific Analysis Laboratories Limited.
Trends in Oils and Fats
Butter sales reached their highest level in decades as reviews of past research by some scientists now suggest there is no basis for implicating saturated fat in heart disease, according to Food Formulation Trends: Oils and Fats, a report by market research firm Packaged Facts. The research reviews have generated much controversy with highly regarded nutrition authorities concerned that the conclusions are irresponsible and will result in consumers abandoning decades of moderation and good judgment (or maybe just guilt) when it comes to selecting dietary fats and the foods that contain them.
In reality, there is a strong case to be made that other factors matter a lot more to consumers in relation to dietary sources of fats and oils than a distant threat of heart disease. This is especially true when it comes to Millennials and Generation Z consumers, found Packaged Facts survey data.
“Even if the latest scientific studies and reviews had confirmed a direct link between saturated fat and heart disease, it can be argued that younger consumers might very well have made the same purchase decisions anyway,” says David Sprinkle, research director, Packaged Facts.
In addition to the fact that flavor and taste has always been the primary decision-making criterion when it comes to food products, younger consumers, who are generally very interested in health and wellbeing, demonstrate much greater concern about making choices that also reflect their values, such as choosing foods that have been minimally processed without additives and that contain organic and GMO-free ingredients, accompanied by short and simple ingredient lists. These consumers are more likely to reject fats or oils that have been chemically refined or that are sourced from commodity grains produced by large scale agricultural production.
Given this consumer orientation, the recent return to butter, along with growing interest in full-fat and grass-fed milk and yogurt, ancestral fats, and specialty oils derived from fruits, seeds, and nuts of plants with healthy connotations, such as coconuts, avocados, pumpkins, pistachios, walnuts, olives, and hazelnuts, should come as no surprise. Expect this new landscape for fats and oils to continue to extend its reach beyond the cooking oil aisle of the supermarket. Savvy processed food manufacturers are already taking note, with salty snacks some of the first products to showcase oils perceived as healthier and packaged cookie brands returning to the indulgent, full flavor of butter.