
According to a Recent Study/Survey … Mid-July 2018 Edition
26 Min Read By MRM Staff
This edition of Modern Restaurant Management (MRM) magazine’s “According to …” research roundup features the reasons why people do and don’t dine out, digital and loyalty trends from Tillster, hot dog on the menu, pizza and a movie and Millennial vs. Gen Z trends.
The Why? Behind The Dine
Across the U.S., 85 percent of diners decide what to eat for dinner the same day the meal occurs, so it may not come as a surprise that compared to 2015, convenient meal solutions grew across almost every category and generation. Research released today in the 4th edition of The Why? Behind The Dine™ from Acosta and Technomic explores the most recent dining developments and motivators that are changing the way diners engage with foodservice.
“Whether it’s enjoying a family dinner out or picking up carry-out food, diners are seeking convenient, healthy options for themselves and their families,” said Colin Stewart, Senior Vice President at Acosta. “We are seeing more diners take advantage of the seemingly endless array of meal solutions, be it a quick trip through the drive-thru, grocery prepared foods, lunch from a food truck, or preparing dinner using a meal/ingredient kit.
Acosta and Technomic’s The Why? Behind The Dine™ presents a comprehensive overview of dining habits across generations and key segments.
Highlights from the report include:
Convenient Eats
- Delivery food continues to be a popular meal solution for diners. In the three months leading up to the survey, 51 percent of total U.S. diners and 77 percent of Millennial diners reported ordering delivery food.
- Pizza isn’t the only food diners want delivered. Diners surveyed expressed interest in everything from hamburgers (28 percent), chicken wings (27 percent) and Mexican fare (21 percent), to barbecue (14 percent) and desserts (11 percent).
- In 2015, only eight percent of U.S. diners indicated they had ordered a meal/ingredient kit online. That figure increased by 10 percentage points to 18 percent of total U.S. diners by 2017, with more diners with kids and Millennial diners engaging with this option.
Welcoming Gen Z to the Table
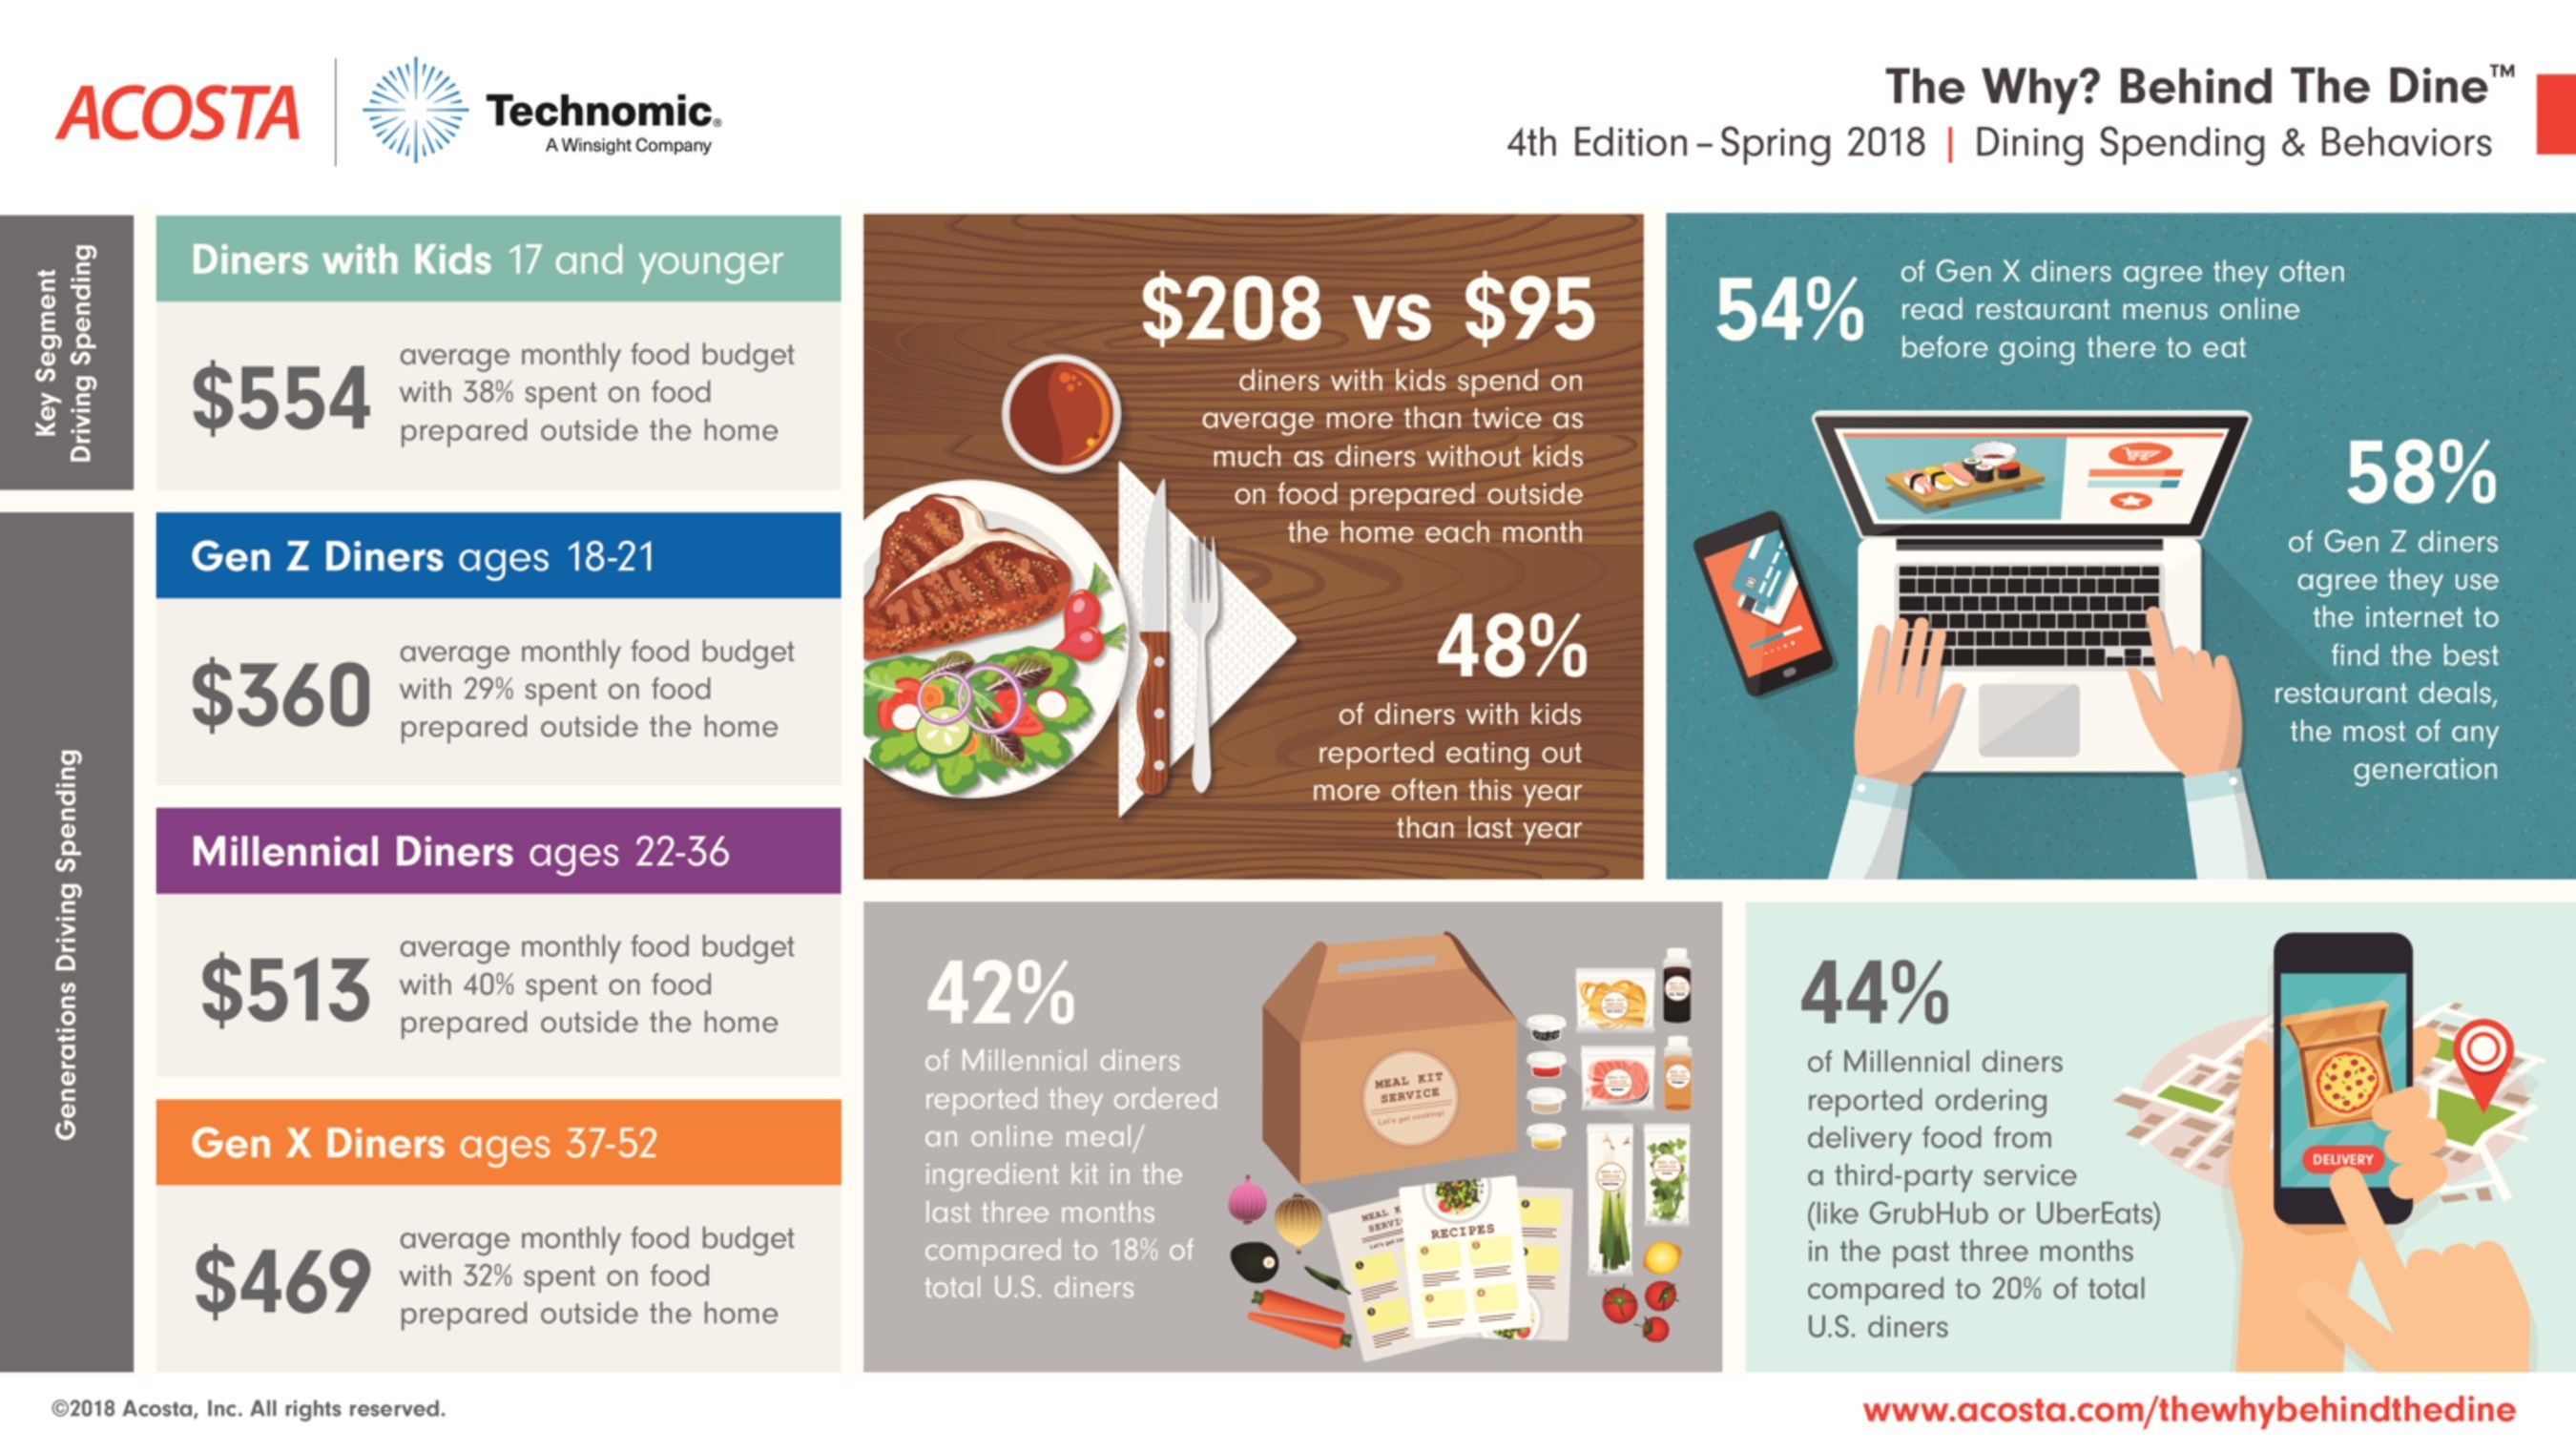
- Gen Z diners are already outpacing Boomer and Silent diners in reported monthly spending on food prepared outside the home.
- Fifty-eight percent of Gen Z diners agreed they use the internet to find the best restaurant deals, the most of any generation.
- Nearly 70 percent of Gen Z diners agreed they like it when they have restaurant leftovers for another meal.
Dining Out All Stars: Diners with Kids
- Diners with kids reported their monthly spending on food prepared outside the home was more than twice that of diners without kids ($208 versus $95).
- Healthier options continue to be important among diners with kids, with 46 percent eating more salads at restaurants over the past year, and 43 percent eating more restaurant meals with locally sourced ingredients.
- Diners with kids are plugged in while dining out. Twenty-eight percent connect to Wi-Fi on their personal mobile device while at a restaurant.
The 4th edition of The Why? Behind The Dine™ study was fielded in November 2017 in partnership with Technomic Inc., using a random sample of 1,500 U.S. diners. To access the full report, click here.
Reward Me: Demand Grows for Digital Coupons
In its new Digital Coupons and Loyalty Index, Tillster examines how a restaurant’s digital coupons or loyalty strategy can help them to grow sales and engage with customers. The Index showcases how QSR and fast casual customers are increasingly motivated by digital coupons and rewards.
For the second year in a row, Tillster partnered with esteemed research firm, SSI, to conduct the study on the digital coupons and loyalty program usage of more than 2,000 QSR and fast casual customers. The Digital Coupons and Loyalty Index summarizes the proprietary study’s key findings, studying trends from the last year and looking ahead to the next year. One significant finding from the study is that more than 80 percent of all QSR and fast casual customers would visit a restaurant more if digital coupons were offered or if they were part of a rewards program.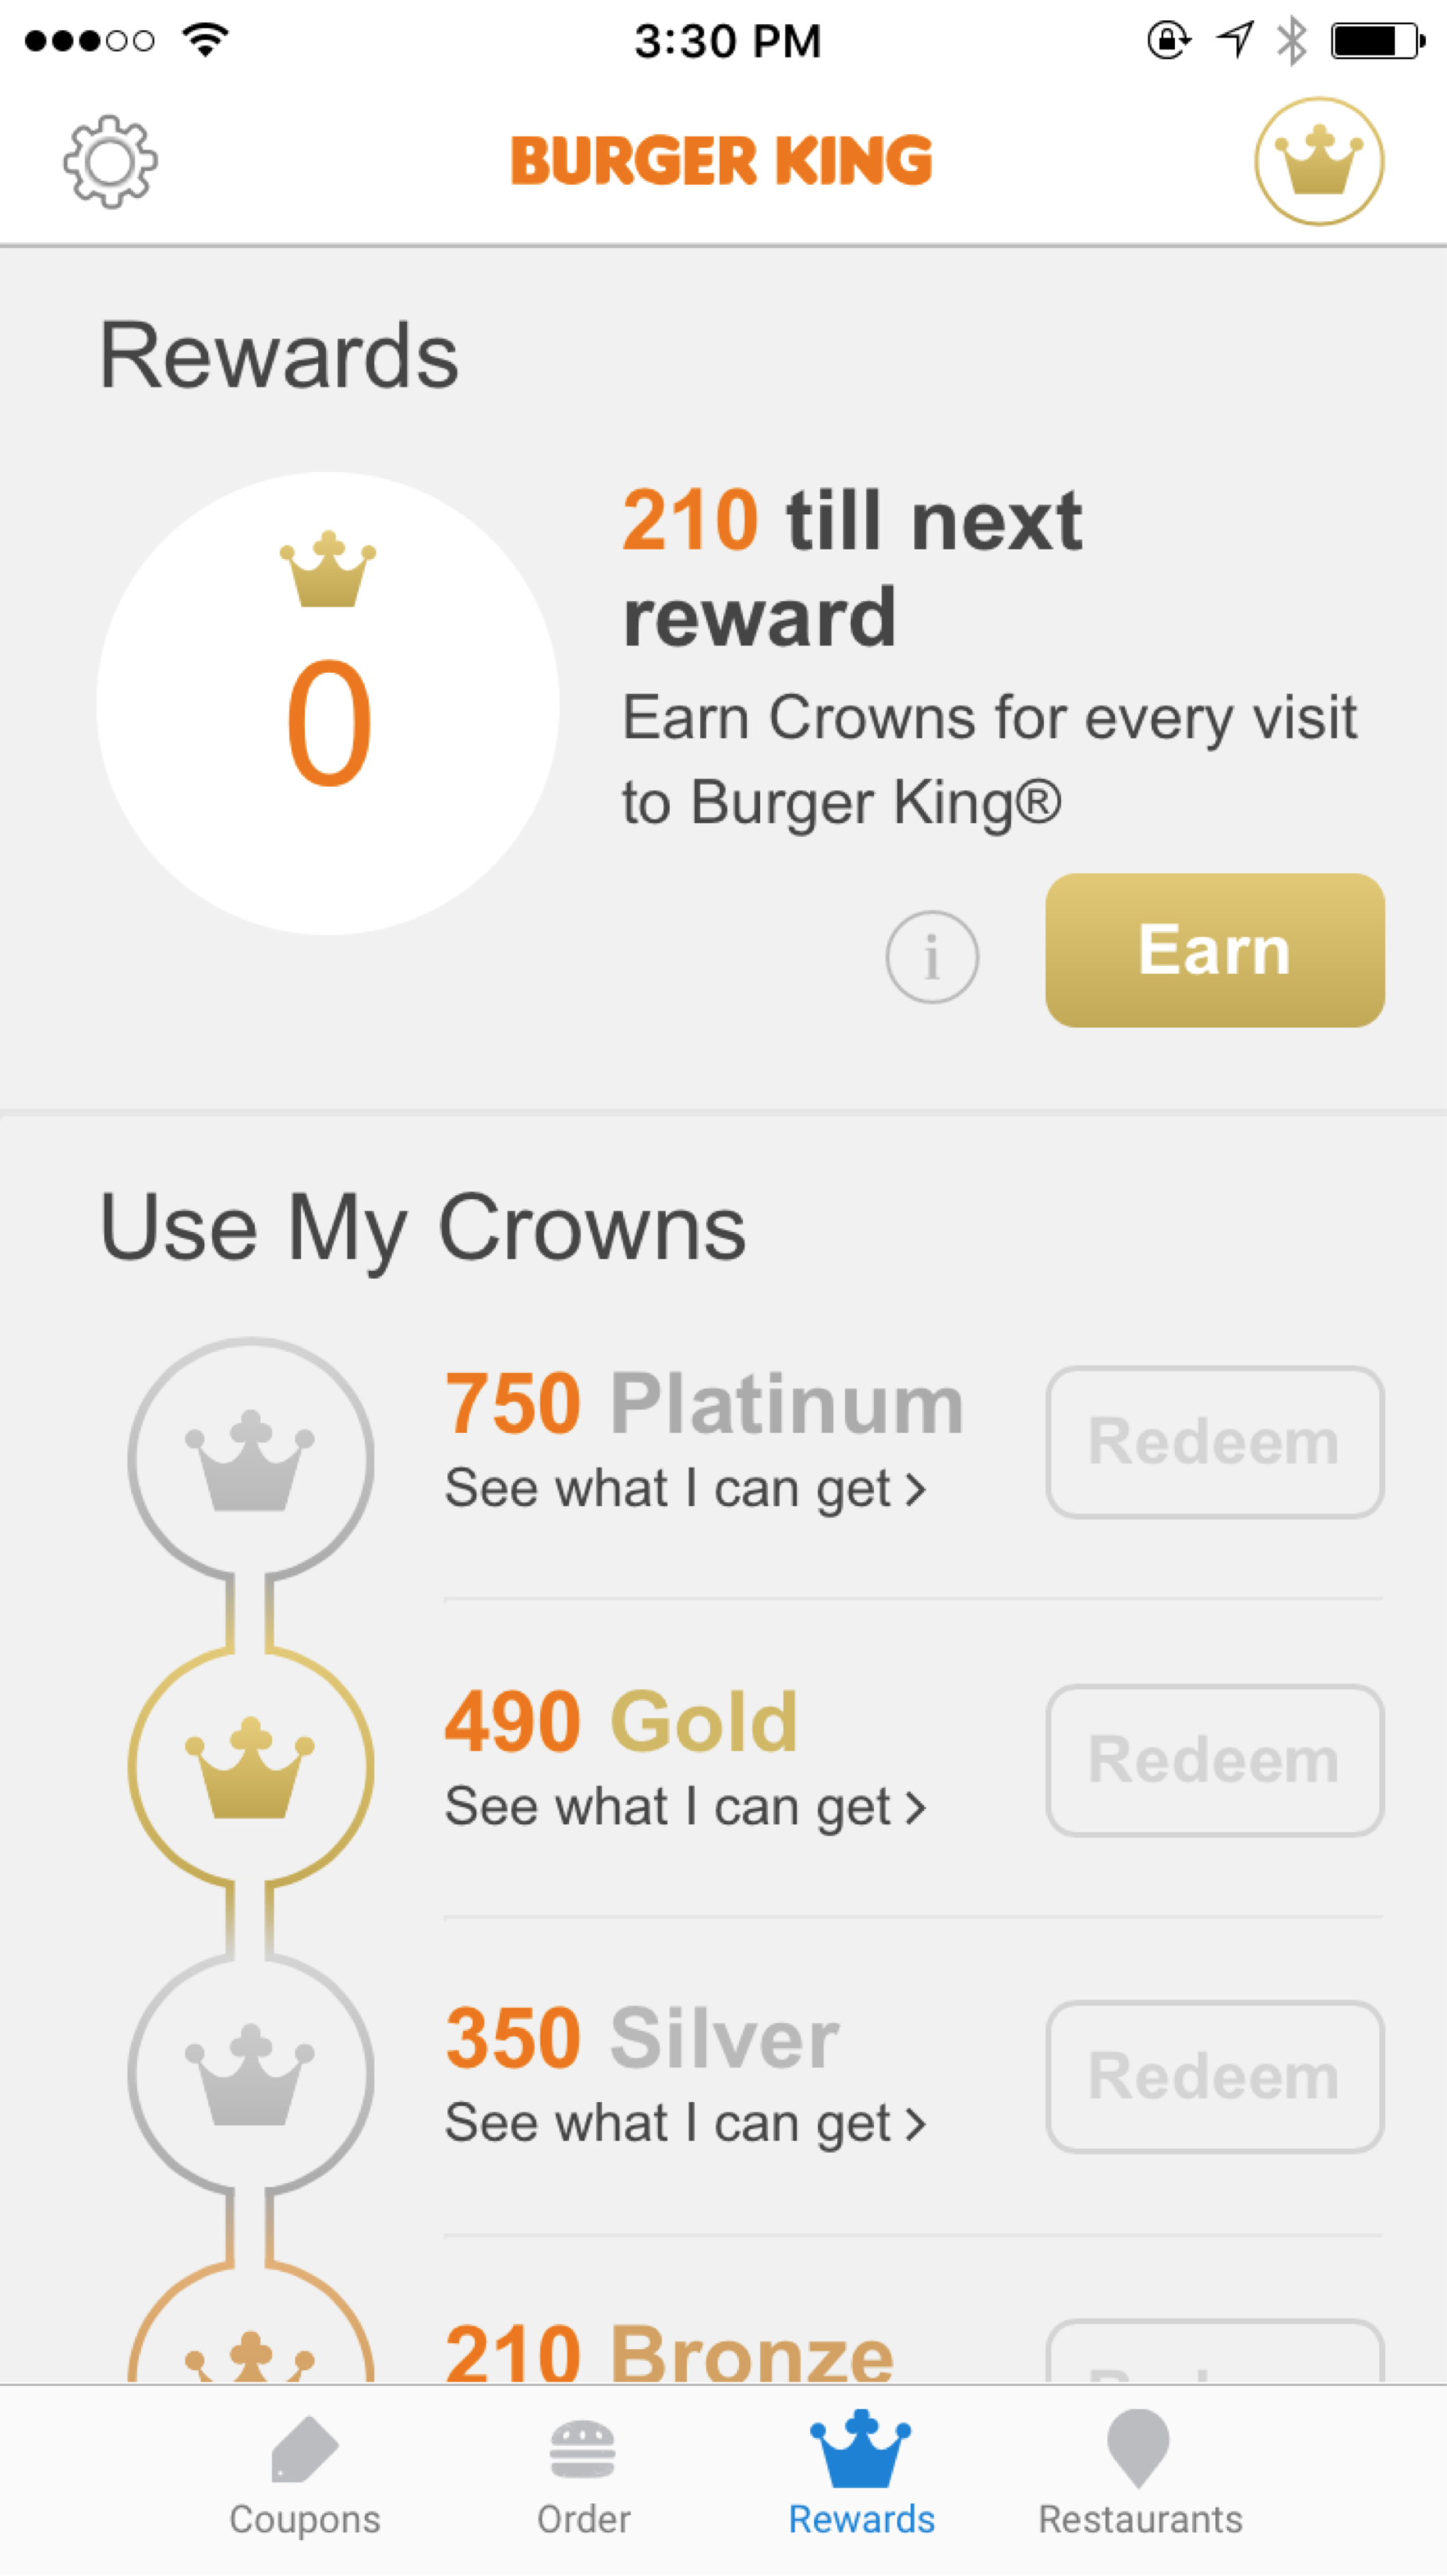
“We facilitate more than 50 million orders a year, for many of the largest restaurant brands in the world,” says Perse Faily, CEO of Tillster. “It’s clear that digital savings are no longer just for the tech-savvy or for the price conscious. App-based rewards are today, as our study shows, an important driver of brand loyalty and a growth opportunity in QSR and fast casual dining.”
Digital Coupons Drive Change in Customer Behavior, Restaurant Visits
Digital coupons are playing an increasingly important role in influencing customer choice. The Tillster Index found that a significant percentage of customers would choose one brand over another, or would try a new brand if a digital coupon were offered. Additionally, loyalty and rewards programs are driving restaurant visits across all age groups and income brackets.
Usage of Digital Tools
While consumers always trend towards a good deal, the Tillster Index highlights the importance of deploying digital coupons and loyalty programs at the right times and places to help restaurants drive incremental revenue, reward loyalty and target personalized offerings for greater effect. To see key stats on how digital coupons and loyalty programs are best deployed, download Tillster’s full Digital Coupons and Loyalty Index.
Uptick in Momentum
Year-over-year chain restaurant sales increased 1.1 percent in June, the fourth consecutive month of positive or flat comp sales. The increases compare to relatively soft prior year numbers, but continue to suggest a turning point from the consistent declines of 2016 and 2017. Performance began to improve in the fourth quarter of 2017 and the industry has reported monthly sales increases in six of the past nine months. These insights come from TDn2K’s Black Box Intelligence™ data, based on weekly sales from over 30,000 locations representing 170+ brands and nearly $70 billion in annual sales.
The comp sales numbers are encouraging, but come against a backdrop of continued softness in guest counts. Store traffic declined -1.7 percent in June. This is an improvement of roughly one percentage point over trends from earlier in the year, but it points out the headwinds faced by the industry with respect to driving visit frequency.
Same-store sales in the second quarter of 2018 were up 0.8 percent, the third consecutive quarterly increase and another indication of a strengthening industry environment. Growth was consistent throughout the period with positive sales in 12 of the 13 reporting weeks. Traffic was down -2.0 percent, a slight improvement over the -2.6 percent drop in the first quarter.
Off-Premise Sales Fuel Growth in 2018
Year to date, sales are up 0.5 percent in 2018 versus a -1.2 percent decline at this point last year. All segments except fine dining were stronger in 2018. Compared to 2017 performance, casual dining and fast casual reported the most improvement.
The numbers reflect a changing landscape with respect to how consumers use chain restaurants. Virtually all the observed gains have come from to-go and delivery sales. Every segment recorded a decline in dine-in sales and every segment except family dining and quick service experienced to-go sales increases. Fine dining and upscale casual reported large percentage increases, but off-premise is a relatively small portion of their business. Their in-unit sales were the strongest in the industry and reflect the importance of a dining experience to consumers visiting those brands. The degree to which they can expand food delivery remains to be seen.
The casual dining segment reported double-digit increases in to-go sales so far in 2018. Many of these brands already have significant existing off-premise businesses and are capitalizing on a variety of social media and technical innovations to exploit additional to-go and delivery opportunities.
Top Line Driven by Pricing
Check average is up significantly this year. For the first six months of 2018, average check is up 2.9 percent versus 2.2 percent for the same period last year. Price increases, largely in response to higher labor costs, are certainly a factor. But a large portion of the change in average check is attributable to casual dining, which may be influenced by the previously noted increase in to-go and delivery.
Economy is Robust, But Tariffs Loom
“The stronger growth in the second quarter was broad-based and has supported robust hiring,” according to Joel Naroff, president of Naroff Economic Advisors and TDn2K economist.
“With more people working and wages rising a little faster, consumers are spending again. The good news for the restaurant industry is that households are not over-extending themselves as much as they had been. They are now saving a little more as well as spending more. That means the improved demand at restaurants should be sustained. The only risk to the economy is the emerging trade war. Right now, it is largely a skirmish that should not affect economic activity significantly. But if the tit-for-tat on tariffs accelerates, growth could be harmed, inflation could accelerate and interest rates could rise even further. The best guess is that it will not reach that stage, so expectations are that the economy and consumer spending will be solid the rest of the year. That bodes well for restaurant sales.”
The Downside of a Robust Labor Market
Unfortunately, the same strong labor market that propels restaurant spending has also produced the most challenging staffing environment in many years. Turnover at both the hourly and management levels is at record highs and has become the “new normal”. Data from TDn2K’s People Report™ provides little comfort that market conditions will change soon. Accordingly, brands are struggling to adapt their service models to the new reality of low unemployment and rising wages. This is an especially difficult balancing act. Margins are always a priority, but experienced operators are well aware of the established linkage between quality service, consumer sentiment and revenue.
The upswing in sales is welcome news. General economic conditions are a bit fragile but should be favorable enough to support continued demand. There are fundamental challenges facing the industry, including difficult labor markets and an over-supply of restaurants. Nonetheless, we are encouraged that top-performing brands consistently find ways to deliver strong results in sales, people metrics, and social sentiment.
Gen Z Food Trends
Millennials have had their time in the spotlight; now, companies are looking to the next generation to see how they will impact the future of the food and drink industry. Generation Z*, who are also known as the iGeneration, has the potential to reset expectations for health and wellness, increase the reach of international cuisine and heighten creativity in the kitchen, according to the latest research from Mintel.
Head start on a healthy lifestyle
Regardless of age, sugar is at the top of parents’ watchlists when it comes to what their kids eat and drink. In fact, 60 percent of parents with kids aged 12-17 and 55 percent of parents with kids aged 18+ in the household report saying “no” to their kids’ food and drink choices based on sugar content. But while sugar is a key concern for parents, just 11 percent of US food and drink launches aimed at children (ages 5-12) from June 2017-May 2018 had low, no or reduced sugar claims, according to Mintel Global New Products Database (GNPD).
With parents on the lookout, America’s youngest consumers are increasingly growing health-conscious themselves. In fact, one quarter (25 percent) of teens aged 15-17 say they worry about staying healthy, with another 49 percent agreeing that they think drinking soda is unhealthy.
“Generation Z has come of age at a time when health and wellness is a major consideration. Many younger members of Generation Z follow their parents’ healthy ways and it seems health-consciousness only gets stronger as they approach adulthood. However, health is multi-faceted for this group, suggesting that better-for-you formulations, such as craveable fruits and vegetables, can be expanded to give this generation options that fit with their ever-changing diet priorities,” said Dana Macke, Associate Director, Lifestyles and Leisure Reports, at Mintel.
Gen Z goes international
Today’s younger generations are the most diverse in US history and in addition to their varied racial and ethnic backgrounds, parents are raising their children to have broader palates. Gen Z seems to be cultivating an appreciation for international cuisine from a young age as 36 percent of US parents of children under age 18 agree that their kids enjoy eating international foods.
Interest in international cuisine goes well beyond the more commonplace varieties such as Italian, Mexican and Chinese as Gen Z consumers are driving consumption of more emerging international food and drink. In addition to interest in eating at international restaurants such as Indian (36 percent), Middle Eastern (38 percent) or African (27 percent), adult Gen Z consumers are also much more likely than other generations to find culinary inspiration from social media: 62 percent of young adults aged 18-22 say they cook international cuisines at home from social media, compared to 46 percent of Millennials (aged 23-40) and 23 percent of Generation X consumers (aged 41-52) who cook at home.
“Generation Z is America’s most diverse generation yet. With exposure to international foods starting at an early age, whether in restaurants or at home, Generation Z is more likely to be open to the latest international food trend or innovative fusion creation. These adventurous habits are creating opportunities across categories, presenting potential for products such as tikka masala meal kits or Chinese Peking duck-flavored potato chips. While restaurants remain the most common points of discovery for international cuisine, younger consumers’ exposure to a range of cuisine types creates opportunities for brands to offer more authentic and hybrid flavors,” said Jenny Zegler, Associate Director, Mintel Food & Drink.
Digitally native upbringing leads to DIY mentality
Raised in an era where consumers have access to information at their fingertips 24/7, younger generations have grown up with the ability to thoroughly research their hobbies and interests, resulting in 80 percent of Gen Z consumers under age 18 saying their hobbies/interests are just as important as their school work. What’s more, 36 percent of consumers aged 10-17 and 31 percent of those aged 18-22 believe that being creative is an important factor to being successful as an adult. This highlights an opportunity for food and drink brands to offer do-it-yourself experiences that help tweens, teens and young adults be creative and, eventually, confident in the kitchen.
“The wide range of food media, whether MasterChef Junior or YouTube videos, has piqued an interest in food and drink among some members of Generation Z. This younger generation’s easy access to technology and interest in being creative presents an opening for interactive products that encourage Gen Z to safely experiment and extend their passion for food and drink, such as chips that allow consumers to make their own flavor or kits to make more complex recipes or international meals at home,” concluded Zegler.
Plant-Based Popularity Grows
Plant-based innovation is flourishing. Growing consumer interest in health, sustainability and ethics is driving plant-derived ingredients and products into high popularity. Innova Market Insights reports that plant-based product claims increased by 62 percent globally (CAGR, 2013-2017) with growth occurring on platforms such as plant proteins, active botanicals, sweeteners, herbs & seasonings and coloring foodstuffs.
“The dairy alternatives market has been a particular beneficiary of this trend,” says Lu Ann Williams, Director of Innovation at Innova Market Insights. “With the growing availability and promotion of plant-based options to traditional dairy lines, specifically milk beverages, and cultured products such as yogurt, frozen desserts and ice cream,” she stated.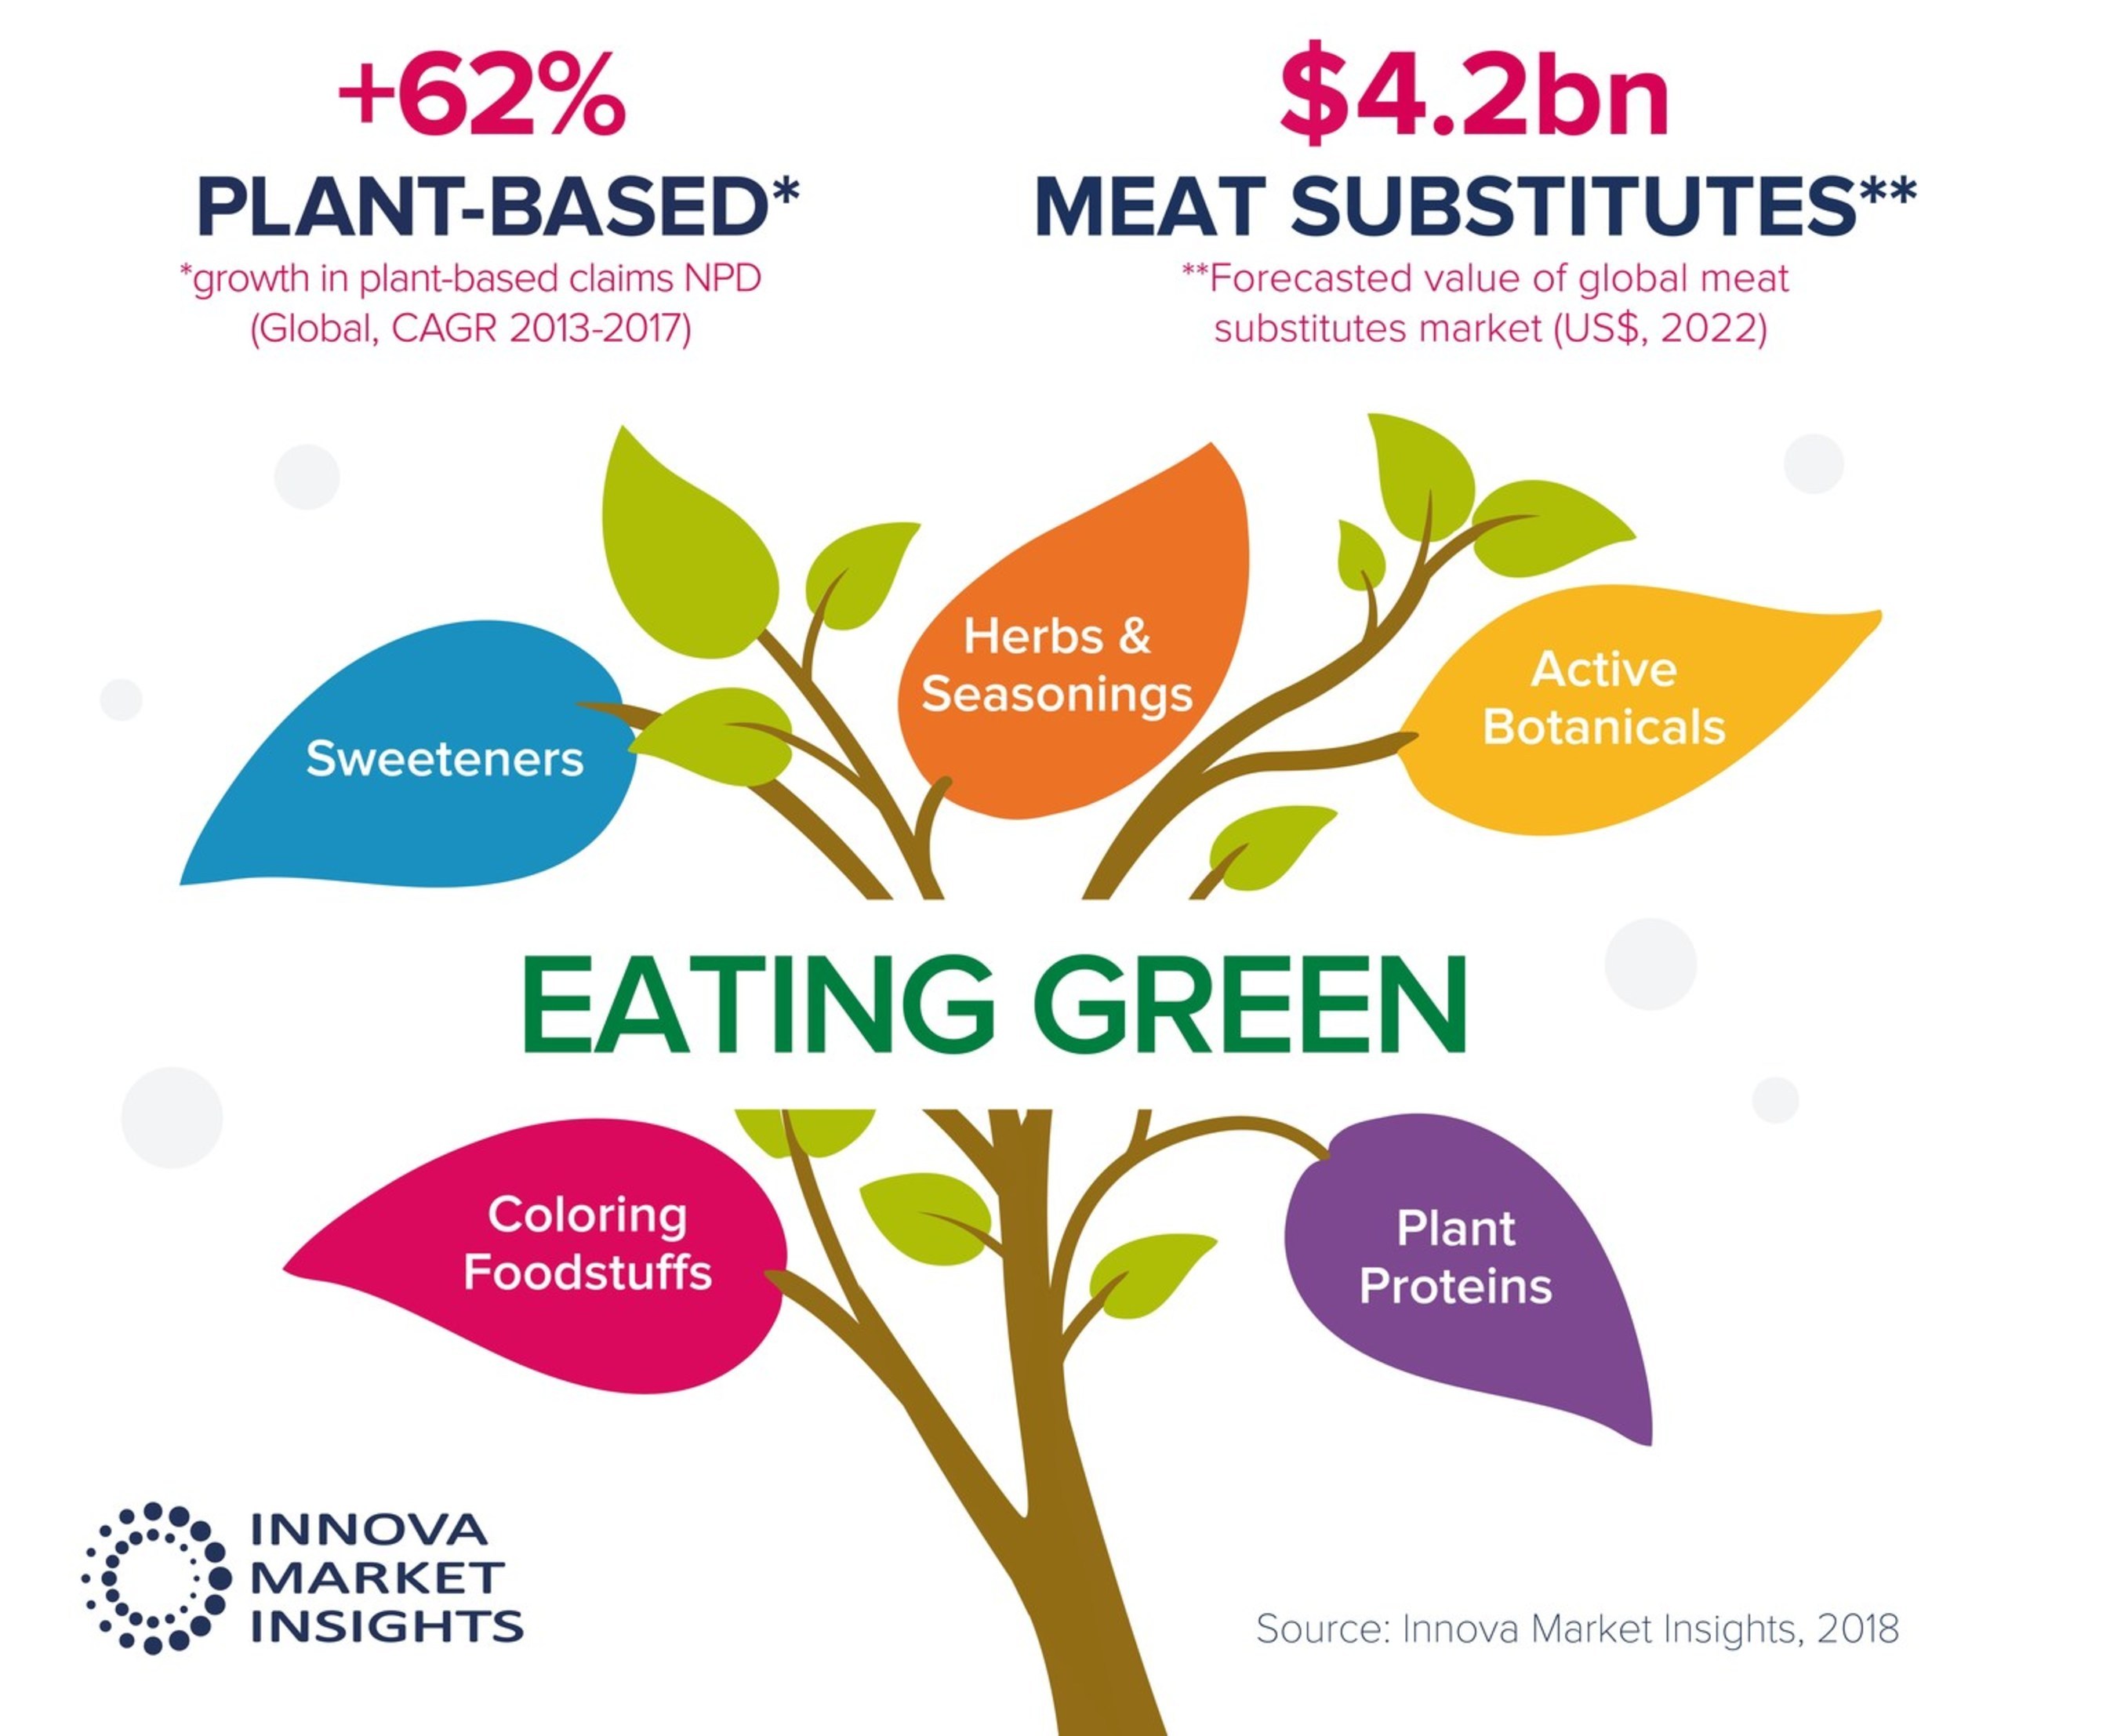
The dairy alternatives category was largely pioneered by and continues to be led by beverages. Global sales of dairy alternative drinks are set to reach US$16.3bn in 2018 and they accounted for over eight percent of global dairy launches recorded by Innova Market Insights in 2017, up from 7 percent over 2016. Actual global launches have more than doubled over a five-year period.
Spoonable non-dairy yogurt has also seen strongly rising levels of interest, but from a smaller base, with a 48 percent CAGR for the 2013-2017 period taking its share of dairy launches from less than 0.5 percent in 2012 to 1.5 percent in 2017. According to Innova Market Insights’ consumer research, one in three US consumers have increased their consumption of plant-based milk/yogurt in the two years to the end of 2017.
“In the move to offer something new, we are starting to see an increasing variety of non-soy plant-based ingredients, including cereals such as rice, oats and barley,” notes Williams. “We also noticed an increase in nuts, such as almonds, hazelnuts, cashews, walnuts and macadamias, as well as coconut and more unusual options such as lupin, hemp and flaxseed.”
Interest in plant-based eating is clearly reflected in developments in the meat substitutes market, where global sales are set to grow to US$4.2bn by 2022. The range of ingredients used for meat substitutes includes vegetables and grains, as well as traditional sources such as soy and specialist manufactured brands such as Quorn and Valess.
Gravitation towards plant-based diets in general, along with interest in vegan, vegetarian and flexitarian lifestyles and concerns over animal welfare, have together served to increase interest and NPD has subsequently seen an 11 percent CAGR for the 2013-2017 period. Research also indicates that four in ten US consumers increased their consumption of meat substitutes/alternatives during 2017.
The Tech Effect
Technology is becoming an increasingly integral part of shopping and dining experiences for Americans, and in turn, technology successes and failures are seriously impacting whether consumers return to a store or restaurant.
Nearly half of consumers say that positive experiences due to well-functioning technology lead them to greater brand confidence (46 percent) and more frequent visits to the business (44 percent). Conversely, negative experiences due to malfunctioning technology result in a decline in brand confidence and less frequent visits to the business for more than a quarter of consumers (28 percent), the report says.
Boomtown issued the report, titled “The Digital Forward Customer Experience: New Expectations and Obstacles for Today’s Storefront.” The report examined how tech savvy national brick and mortar retail and restaurant chains are transforming the experiences and expectations of consumers across the entire shopping and dining landscape.
Boomtown’s report is based on a survey of 1,033 U.S. consumers. Respondents identified a strong preference for brands that make widespread use of advanced, reliable and intuitive technology. These brands, which are often called ‘digital forward’, include stores and restaurants like Walmart, Target, Best Buy, Shake Shack, Chipotle and others, and are gaining the business and loyalty of today’s consumers.
According to the Boomtown report, consumers who frequent large chain establishments over smaller businesses name technology as one of the key aspects of their in-store experience, highlighting a range of digital payment options (critical to 57 percent of consumers), online ordering and local pick up capabilities (important to 50 percent), self check-out options (important to 49 percent), and other digital offerings like in-store WiFi and real-time order information.
But the report also found that delivering a technology-driven customer experience can be fraught with risk. According to the survey, over 80 percent of consumers have encountered technical issues at retail stores and restaurants, and the consequences of a failed experience can be dire (including complaints, as well as a decline in business and brand reputation).
“These findings confirm that the digital transformation of the consumer experience is fully underway and that businesses – from small, regional shops or restaurants to national, consumer-facing chains – must invest in their technology to court and keep consumers,” said Alfred ‘Chip’ Kahn IV, CEO and founder of Boomtown. “But, investment in technology-driven customer experiences creates complexity and risk, offering the opportunity to please the customer but potentially imperiling customer relationships if the promise falls short.”
Other key findings from the research include:
-
When shopping or eating at large chains, 57 percent of consumers prioritize a wide range of reliable digital payment options as central to their overall experience
-
After a positive experience involving technology, 63 percent of consumers will compliment the location owner or refer the location to others
-
For 56 percent of consumers, a negative technology experience will translate to filing an official complaint
-
Over 80 percent of consumers have had at least one encounter with a technical glitch (such as failed payment processing or non-functional Wi-Fi) as they shopped or dined; nearly 60 percent of consumers have encountered these technical glitches multiple times
-
Nearly 60 percent have encountered slow or malfunctioning electronic payment systems
-
One in three respondents has encountered faulty or unavailable Wi-Fi or incorrect information online (36 percent)
“Retail stores and restaurants should acknowledge that customers’ expectations and demands have grown to include an intuitive, seamless technology-driven experience,” noted Kahn. “Thanks to the precedent set by today’s digital-forward leaders, businesses large and small can learn from these strategies and deliver a better experience to their customers.”
Hot Dog Popularity
No food is more American than hot dogs. You may want to find which restaurants feature that old summer standby. We used Sirved to search every restaurant in the Eastern States and found that 18,000 restaurants offer hot dogs on their menus.
Here are some interesting facts about hot dogs:
- In 2016, Americans spent over $2.4 billion on hot dogs in supermarkets. Throw in every dog that was eaten in a ball park or at the beach, and the numbers are astronomical.
- LA Dodger fans consumed 2.6 million hot dogs last season.
- On Independence Day this year, Americans will eat 150 million hot dogs.
- Top 5 hot dog eating cities? Los Angeles, New York, Philadelphia, Boston and Phoenix
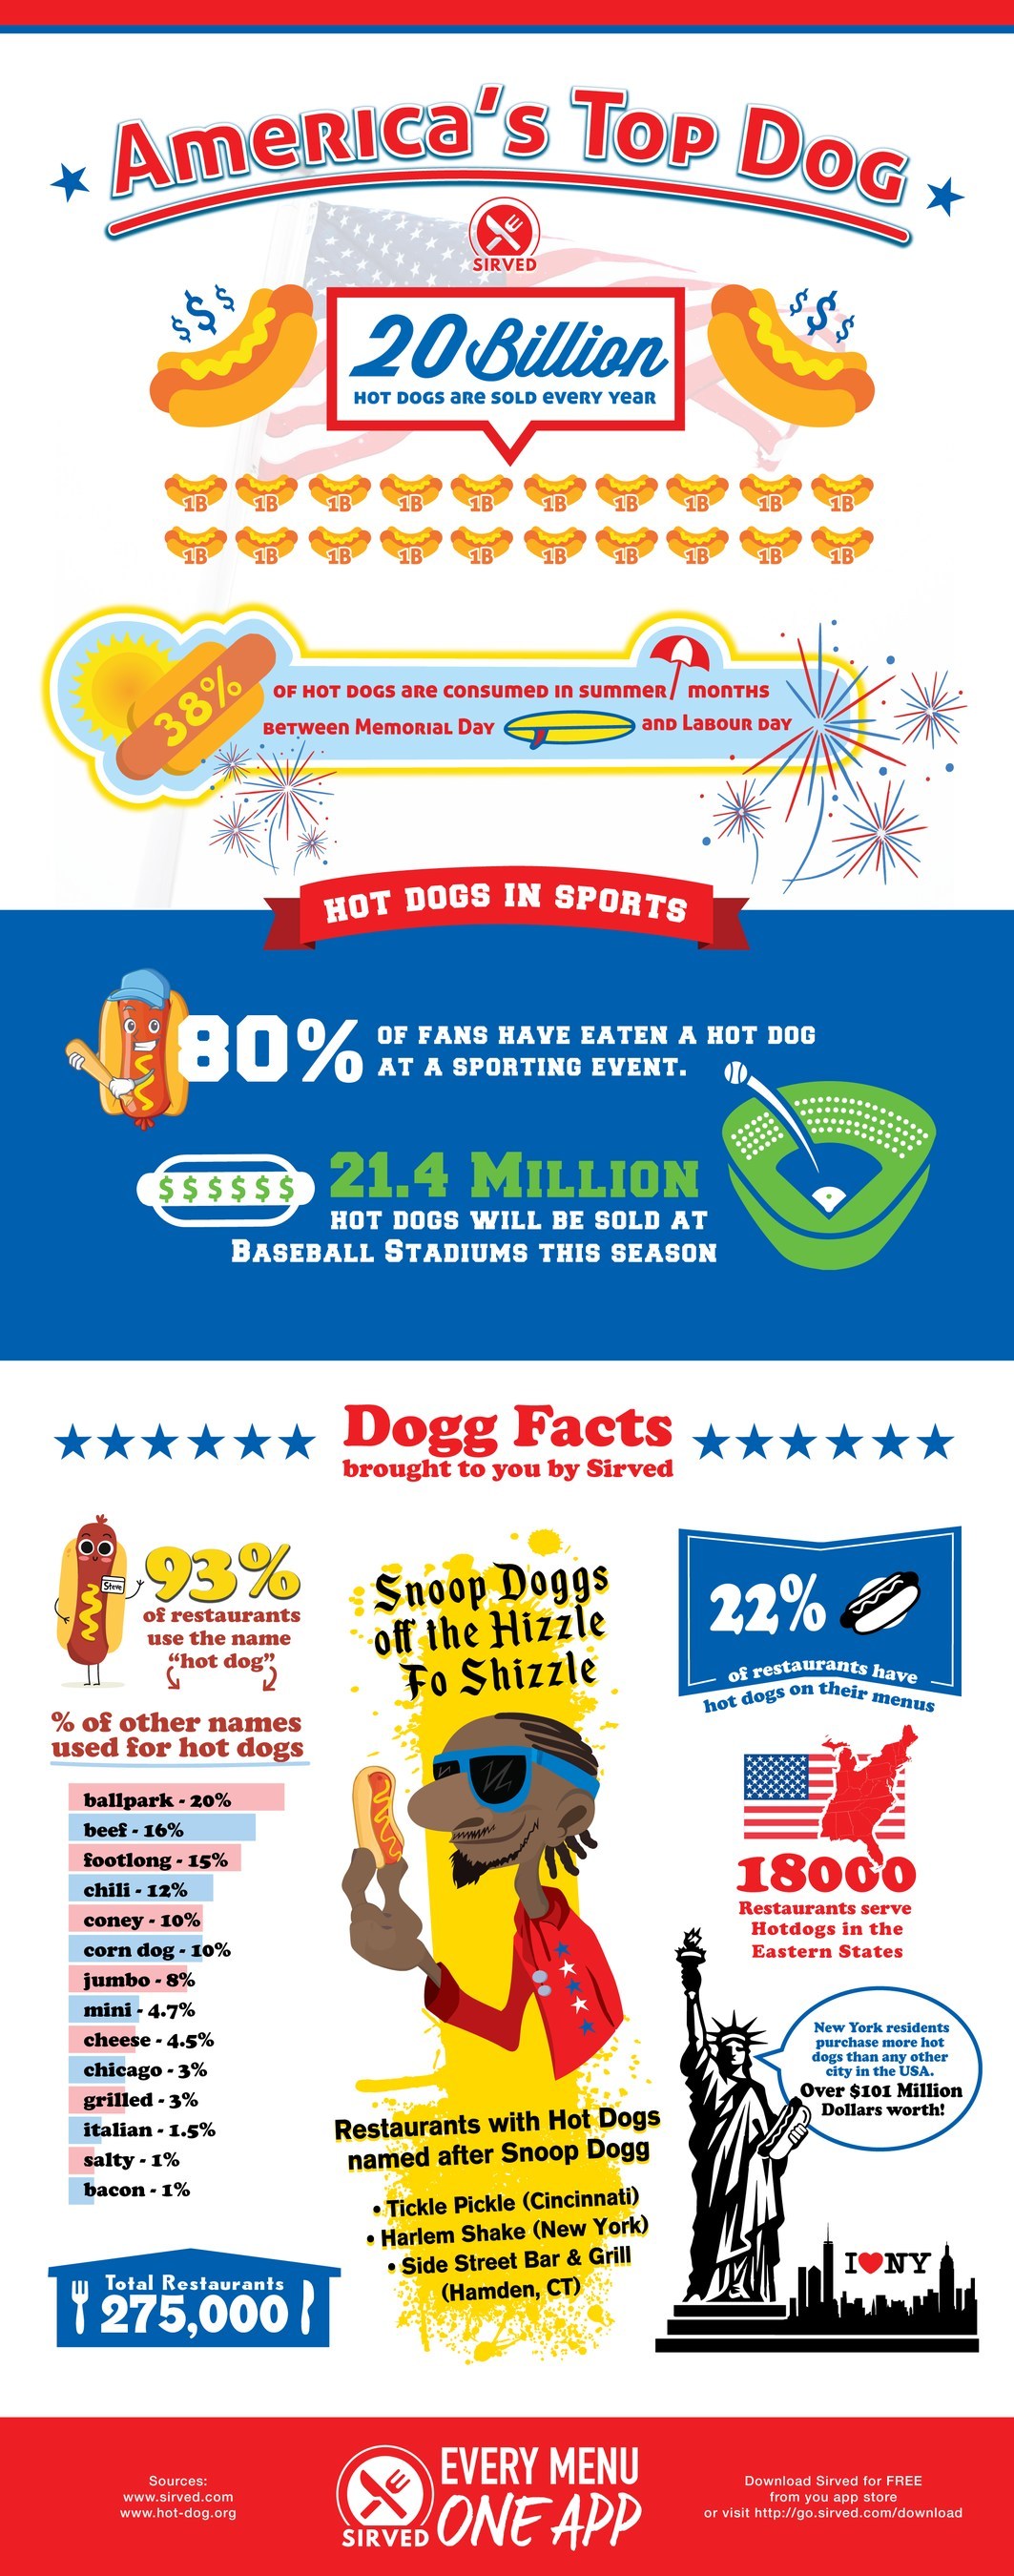
Approximately 93 percent of the restaurants call them ‘hot dogs’ but they appear with nicknames such as ballpark, foot long, corn dog, chilli dogs and jumbo as well. What other restaurant menu app can generate that kind of data in the time it takes you to spell ‘mustard’ out loud? And by the way, did you know that 71 percent of Americans prefer mustard on their dogs, that’s well ahead of ketchup and chilli as toppings. Customers in Atlanta, might want to try their famous dog loaded with coleslaw and Vidalia onions. Or how about a Fenway Frank at that famous Boston ballpark which features the classic mustard and relish but it often comes with baked beans as well. While in Cincinnati you may want to devour their famous Coney dog topped with chilli and a mound of grated cheddar cheese.
Casual Diners Want Fresh
Diners who have visited a casual dining chain in the last 6 months would be likelier to return if the chains served fresher food, according to TrendSource’s 2018 Food Service Industry Report.
The report—which considers consumers’ perceptions, practices, priorities, and pain points in the casual dining industry—focuses on the top-20 chains in the United States, from Texas Roadhouse all the way to Denny’s and back. For owners and operators, there is comforting and distressing news alike.
The majority of respondents choose casual dining chains for their comfort and casual atmosphere, because they are easy for everybody in a group to agree on, and because they can “be themselves” within them. As menus become increasingly complex at the hottest dining spots in town, many consumers find comfort in the familiar and simple, and casual dining chains seem to have that in abundance. These are not places to see and be seen, and, for many respondents, that is a positive attribute. For them, these establishments feel familiar and comforting, and that is an image operators must lean into.
But familiarity can breed contempt and, over the years, it seems consumers have grown savvy to the fact that foods are often prepared off-site and heated in the restaurant. Thus, they want these chains to serve healthier, fresher, and more interesting fare, which as TrendSource’s Director of Client and Consulting Services, Sarah Rowlett, notes, “is easier said than done” for many operators. “Pivoting to fresher food may require a rethinking of their culinary approach and business model,” she notes, “but it may ultimately prove to be a necessary change as today’s restaurant goers expect fresher and even local options at their local eateries.”
As the full report illustrates, casual dining chains, for the most part, have convinced consumers that their prices, menu variety, and even service are serviceable; consumers just want the food itself to be better. The report additionally breaks diners into clusters based on their dining priorities, separating the experiential eaters from the trend setters and the flavor fanatics. How can restaurants best appeal to these demographically disparate but ultimately similar groups of diners?
Also, which restaurants scored the highest among respondents; how do suburban, rural, and urban diners differ; and is anybody all that interested in pick-up and delivery? Learn more by downloading the full report.
Pizza and a Movie
- 90 percent of Americans think pizza and a movie are the perfect pairing for movie night at home
- More than two-thirds (77 percent) of Americans describe pizza and a movie as “Movie Night Done Right”
- Of those who answered “pizza” as their top pairing for movie night, 79 percent typically eat pizza from a pizza chain for Movie Night
- 48 percent of respondents were male, and 52 percent were female
- 35 percent of respondents were millennials, 30 percent were Gen X, and 35 percent were baby boomers
- 30 percent of respondents had children under the age of 18 living at home, while 70 percent did not
- 35 percent of respondents were high school graduates, 17 percent had some college education, and 16 percent had a degree from a four-year college
Legal Cannabis No Effect on Wine and Liquor Sales
As legalized, recreational cannabis becomes available in more states, it is not expected to have a significant impact on the purchasing of wine and liquor, according to the TABS Analytics 2018 Wine and Liquor Study. Similarly, consumers are not strongly influenced by brand, outlet and price when it comes to their making purchasing decisions. Even though nearly two-thirds of consumers make wine or alcohol purchases, the study shows a highly fragmented, immature market in which 27 percent or fewer of survey respondents noted they were familiar with liquor brands and only 19 percent for wine. In comparison, brand engagement for other consumer packaged goods (CPG) categories typically exceeds 40 percent to 50 percent, with customers shopping more frequently at specific outlets, while seeking discounts and other deals.
“The wine and liquor markets are quite unlike any of the other CPG categories TABS tracks. Both categories are intensely fragmented, and consumers are not as heavily engaged in purchasing, which results in weaker brand power than we see in categories like cosmetics, vitamins or grocery,” said Dr. Kurt Jetta, president and founder of TABS Analytics. “Additionally, we don’t see the traditional deal-seeking behavior consumers typically exhibit when it comes to the beverage alcohol market. Even though outlets like Costco, Walmart and Trader Joes – which offer lower costs products – are among the top retailers, prohibitions on discounting liquors and other state-specific regulatory limitations to where these products can be sold result in pricing being less of a driver.”
TABS Analytics’ inaugural Wine and Liquor survey was conducted in June 2018 by SSI Research to examine key consumer, product and channel trends across 11 types of red and white wines and eight types of liquor, as well as attitudes toward use of cannabis. The survey included 1,900 geographically and demographically dispersed consumers, ages 21 and older.
Other key findings from the study include:
- Legalization of cannabis to have minimal impact on beverage alcohol sales – Only 5 percent of regular wine purchasers and 9 percent of regular liquor purchasers indicated strongly that they would drink less if cannabis was legalized. Further, there does not appear to be a strong constituency against the legalization of cannabis, with less than 20 percent of wine and liquor drinkers saying they strongly opposed legalization.
- Higher Education and Income Drive Wine and Liquor Purchases – Education has a high correlation with wine purchasing, growing from 29 percent for high school graduates or less to 60 percent for those with post-graduate degrees. Liquor purchases follow a similar trajectory, peaking at 40 percent with college graduates. Income appears to be a stronger predictor than education, however, for wine purchase levels, with 68 percent of consumers with incomes of $250,000 or more saying they regularly purchase wine. Liquor also shows upward momentum at higher income levels but is only regularly purchased by 42 percent in the highest income bracket. The survey also showed definite skews in ethnicity, with white consumers purchasing wine more frequently, black consumers purchasing liquor more frequently, and Hispanic and Asian purchasers at equally high levels for wine and liquor.
- Geographic Wine and Alcohol Preferences Defy Conventional Wisdom – With the popularity of wine destinations of Napa and Sonoma in California, one would expect the West to dominate in wine purchasing. However, looking at regional preferences, the Northeast is the region where the largest percentage of people (53 percent) reported purchasing wine at least once during the past year, with the state of New Jersey outpacing the other top 13 states by a wide margin. Interestingly, the West region ranks lowest at 41 percent. Liquor purchasing is steady, around 35 percent in all regions overall. A closer look at census regions shows that only in the mid-South is liquor and wine purchasing equal at 41 percent.
- Types of Wine and Liquor Purchased Highly Fragmented – Merlot (44 percent), Chardonnay and Cabernet (tied at 38 percent) are the top three types of wine purchased, while the remaining eight types are being purchased by 33 percent or fewer of consumers. At 61 percent, vodka is the most popular alcohol, with whiskey (45 percent), rum (36 percent) and tequila (35 percent) rounding out the top four types.
- Walmart leads in wine, specialty retailers in liquor – Walmart accounts for 29 percent of wine purchases, followed by Costco (21 percent) and specialty retailers (19 percent). For liquor, specialty retailers rank at the top with 27 percent, followed by Walmart (20 percent), Costco (16 percent) and ABC stores (16 percent). The rest of the market for both wine and liquor is highly fragmented, with most other types of outlets accounting for less than 10 percent, including eComm, which has an estimated share of 5 percent
“Based on our survey, the wine and liquor industry appear immature, from the standpoint of market structure and consumer attitude, at present time,” Jetta said. “The combination of these factors create a fertile landscape for targeted marketing and investment spending to drive greater brand awareness. Since preferences and popularity of types of wines or liquors can change on a whim with a little catalyst, visibility at retailers – either through promotions at point of purchase or greater share of shelf – becomes disproportionate for wine and alcohol brands.”
‘New’ Ancient Grains
From every corner of the globe, rice and corn (maize) have been staples of the human diet for centuries. Rice and corn, along with wheat, feeds the vast majority of the world’s population. Therefore it’s easy to assume that we’ve seen virtually every conceivable incarnation of foods and dishes that incorporate rice or corn. Yet new and emerging culinary trends in restaurants across America indicate that there’s still plenty of innovation left for these “new” ancient grains, according to market research firm Packaged Facts in the recent report, Grain and Bakery Innovation: Culinary Trend Tracking Series.
“Grain innovation is a wide field of fertile soil. There’s a rising foodie fascination with traditional grains and grain food methods,” says David Sprinkle, research director for Packaged Facts. “For instance, the corn renaissance is playing out perhaps most obviously with multicultural foods such as chilaquiles & migas, more broadly with tacos as street food gone sacred, and even as taco-style toppings and tortilla chips are spiked into breakfast bowls. Plus, we can’t forget the trendy appeal of the natural and high-antioxidant colors of plant foods which play into the healthful aspects of specialty corns, rices (yes plural!), and grains.”
Even recent dietary trends favoring low-carb lifestyles haven’t been enough to derail innovation in the grain industry. Packaged Facts’ survey data published in Grain and Bakery Innovation: Culinary Trend Tracking Series, reveal that 80 percent of consumers are eating the same amounts of grain (58 percent) or have added more grain to their diets (22 percent) compared to five years ago. Additional survey data show that 85 percent of consumers don’t avoid any type of grain for dietary reasons. It adds up to good news for rice and corn.
The Reason for Rice
Why all the rice, and why now? Because #plantfoods, #healthygrains, #globalinfluences, #localsourcing, #elevatedcomfortfood. Specialty rice varieties—many of them ancient crops rescued from oblivion—and intriguing rice preparations answer all of these calls. Their tremendous variety and endless versatility open them up to innovation, and their familiarity with consumers—who may not yet know their amaranth from their farro—count for easier converts. (Corn is analogous.) Expect this trend to go far and wide.
The Case for Corn
What’s old is new again, and what’s regional is turning national. Traditional corn specialties ranging from elote (seasoned grill corn) to grits and corn nuts are being made new again by innovative menu makers and food producers, trading on neutral flavor and varied texture, as well as consumer fascination with artisanal processes and global inspirations. Elote corn on the cob is popping up as a fast-casual specialty in rainbow-hued preparations as well as a street food-inspired appetizer/snack interpreted by adventurous chefs who prize novelty. Corn nuts (chulpe or cancha in Latin America) add a pop of ultra-crunchy texture to recipes and can be flavored with all manner of adventurous seasonings, from chili powder to seaweed. Grits have evolved from a comfortingly creamy regional breakfast porridge into a cheffy signature dish, led by traditional Low Country Carolina shrimp and grits to become one of the newest trendy grains.
Impact of Restaurant Cleanliness
Foodborne diseases are responsible for about 48 million illnesses and 3,000 deaths in the U.S. each year, according to the Centers for Disease Control and Prevention. At least 60 percent of these illnesses are associated with restaurants. Now, researchers at the University of Missouri have found that the cleanliness of restaurant employees is vital to customer perceptions of food safety, equally as important as a clean environment and hygienic food preparation. Restaurants, however, are significantly underperforming in this regard, identifying a clear area for improvement.
Dr. Pei Liu asked more than 300 adults who ate at a casual restaurant at least once a month to rank the importance of various food safety factors. Respondents then ranked how restaurants performed for these same factors based on their recent dining experience. Three of these factors—employees keeping fingernails clean, wearing clean uniforms and wearing gloves while handling food—were ranked as highly important but received low performance ratings. This indicated restaurants may be harming perceptions of food safety by not meeting customer expectations for the cleanliness of their employees.
The study also demonstrated that three categories of cleanliness were equally important for customer satisfaction: the appearance and behavior of employees, food temperature and freshness, and the appearance of the dining room and other visual aspects of the restaurant. This underlines that clean employees are as important to customer perceptions as more traditional measures of food safety.
A vast majority of Americans say that negative online reviews about restrooms would deter them from visiting a hotel (91 percent) or a restaurant (89 percent), according to a recent survey commissioned by Sofidel. The survey, conducted online by The Harris Poll, June 14-18 among 2,024 U.S. adults age 18 and older, found that roughly three in four Americans cite dirty restrooms as the top restroom issue listed in an online review that would discourage them from visiting a hotel (75 percent) or restaurant (72 percent).
“Dirty restrooms, clogged toilets, foul odors and other common bathroom issues can result in disgruntled customers leaving negative online reviews,” said Fabio Vitali, Vice President AFH Marketing & Sales for Sofidel America. “Since these reviews can deter other patrons from setting foot in these businesses, it’s crucial for owners and managers to properly maintain restrooms and carefully select products that enhance guest satisfaction and promote repeat and new business.”
Following dirty restrooms, the other top restroom issues found in online reviews that would deter Americans from visiting a hotel include:
- Foul odors – online reviews mentioning smells will scare away 69 percent of Americans
- Clogged toilets – 2 in 3 Americans (66 percent) view these as a dissuading factor to visit a hotel
- Closed or out-of-order restrooms – more than half (52 percent) would avoid a hotel with reviews discussing unusable bathrooms
- Out-of-stock essentials such as toilet paper, soap and paper towels – 51 percent would steer clear of properties with reviews mentioning a lack of restroom necessities
- Broken soap or paper dispensers – nearly two in five (39 percent) wouldn’t visit a hotel that doesn’t properly maintain important fixtures
For restaurants, Americans rank restroom issues listed in online reviews in the same order as they do for hotels, with slight variations in the proportion that would avoid that type of business.
- Foul odors – 66 percent
- Clogged toilets – 63 percent
- Closed or out-of-order – 51 percent
- Out-of-stock essentials – 46 percent
- Broken soap or paper dispensers – 35 percent
Meat Alternatives Market
Transparency Market Research (TMR) delivers key insights on the global meat alternatives market in its upcoming outlook titled, “Meat Alternatives Market: Global Industry Analysis, Size, Share, Growth, Trends, and Forecast 2018 – 2026”. In terms of value, the global meat alternatives market is projected to register a healthy CAGR of 6.1 percent during the forecast period due to various factors, regarding which TMR offers vital insights in detail.
The consumer shift towards social media and information technology has raised consumer awareness about how their food consumption habits impacts the environment. Animal cruelty and health issues have impacted the consumer buying behavior, especially in developed regions such as North Americaand Europe. This has also recently resulted in a sudden and startling demand for organic and natural products. Also, there has been growing awareness about the link between meat consumption and non-communicable diseases. In an attempt to cut the risks for such diseases and also for obesity, consumers are shying away from meat in their diets, which will gradually encourage them to become vegetarians in the future.
Meat alternatives are perfect to cater to the permissive needs of these consumers. There are other such consumer attitudes, such as going against animal cruelty, reducing carbon emissions, and the conservation of water (a large quantity of water is utilized for meat production/processing), which will culminate in the high consumption of meat alternatives in the future. Besides, a spurt in population growth is also likely to create the need for alternative foods.
The price of the product is one of the factors that is well thought-out by consumers while purchasing a meat alternative. Many consumers have stated concerns over the prices of meat alternatives, which are relatively higher in some countries than meat itself. In such circumstances, these expensive prices of meat alternatives are likely to affect the market growth in a bigger way than it appears, as positive consumer approach towards meat alternatives is not very mature, and high prices may drive away even those customers which are ready to opt for meat alternatives.
As meat alternatives are highly processed products, they cannot qualify for being natural products. The demographic which exhibits willingness to opt for meat alternatives also exhibits a pull towards natural products, and hence, a tendency to opt out from meat alternatives is a possibility.
While multiple studies have correlated coffee consumption with longevity, including a large umbrella study published in October of 2017 by the BMJ, fewer studies answer the question of which specific compounds present in coffee affect health outcomes. Fortunately, new leaps in DNA testing are making it possible to single out the substances that might hold the key to the beneficial qualities of coffee.
Summer SpendTrend
With summer officially here, First Data has taken a look at spending data to identify the fastest growing summer vacation destinations in the U.S.—and the results might surprise you! While you may think of the sunny beaches of Florida or Southern California when you think of summer travel destinations, the report shows northern cities including Chicago (2.7 percent), Seattle (4 percent), Boston (9.6 percent) and even smaller markets like Providence, RI (12.1 percent) enjoyed significant YOY growth in summer travel spending from 2016 to 2017.
First Data’s SpendTrend Report—a macro-economic indicator based on aggregate same store sales activity across the 1.3 million merchant locations First Data processes transactions for in the U.S.—revealed the following travel and leisure spending trends across the U.S. for the 2017 summer travel season:
- While not internationally renowned as a vacation destination, Providence, RI, enjoyed the highest YOY increase in summer travel spending of any U.S. city at 12.1 percent. Providence was also the fastest growing market for international visitors, with 15 percent YOY growth in international spending from 2016 to 2017. The city was also a favorite summer travel destination among foodies, with a nation-high 20.6 percent YOY increase in restaurant spending in 2017 (compared to a 5.5 percent increase nationally).
- Myrtle Beach was the number one fastest growing market for hotel spending during the summer months, with a 14.2 percent YOY increase in 2017, while Seattle boasted the most expensive summer hotel visits with an average ticket price of $405 per hotel purchase.
- Milwaukee saw the highest increase in the travel spending category in 2017 at 8.4 percent.
- Nationwide, restaurants enjoyed the highest YOY growth across all summer travel and leisure spending categories at 5.5 percent.
The full report is available here
Gen Z’s Love to Travel
According to a new study by UNiDAYS and Ad Age Studio 30, 99 percent of what Gen Z ers like to travel and they have the interest, independence and means to do it – independently. These are among the many findings in the new study, which sets out to quantify Gen Z’s preferences for travel, dispel myths, and outline what marketers can do to attract this always-on-the-go, digital-native generation.
Called “Meet Gen Z: The Traveling Generation,” the report is based on qualitative research generated by a survey of 11,661 college students between the ages of 17 and 23 in the U.S., U.K., Australia and New Zealand and on the UNiDAYS network, the world’s leading Student Affinity Network. The full report can be accessed at http://www.adage.com/genzinsights.
Gen Z commands up to $143 billion in spending power in the U.S. alone. The survey identified how the young adults spend discretionary funds on travel, including: how often and how far they travel, how much they spend, where they go, where they stay, what they do, and what incentives attract them to a destination. Key findings include:
- Gen Z has means. A majority (62 percent) say they work and save to finance travel, and 69 percent describe their travel style as affordable with an occasional splurge. U.S. students spend between $250 and $750 per trip, on average, and only 18 percent of all surveyed rely on parents to pay for trips.
- Unlike their Millennial counterparts, Gen Zers actually prefer hotels over Airbnb and vacation rentals.
- Spring break-style, all-night parties are a thing of the past. In fact, partying came in at a distant sixth place in a list of things Gen Zers like to do when traveling. Instead, the No. 1 activity on a trip is eating out.
- A large portion of Gen Zers are college students, and value is important. When it comes to booking their flights, 76 percent said price was the key factor in their decision-making. Incentives and special offers are also attractive – 59 percent said they would take brands up on offers.
About the findings, Stacey Paul, Head of Travel Innovation at UNiDAYS said: “It’s clear that Gen Z seeks out new experiences and has the spending power to check things off their bucket lists. Travel brands will attract this influential generation if they abandon the one-size-fits-all marketing mentality and develop programs tailored to Gen Z with compelling offers aligned to their travel preferences. Gen Zers are at a time in their lives when they are just starting to make decisions about how and where they spend their money — and travel is quite clearly a category where this matters most. Brands that attract them now have a chance to create brand affinities that will last a lifetime.”
Meet Gen Z: the Traveling Generation is part of a year-long partnership between UNiDAYS and Ad Age Studio 30 that includes four global research studies exploring Gen Z attitudes among college students, ages 17 to 23 in the U.S., the U.K., Australia and New Zealand. Survey topics and questions are designed to highlight what’s newsworthy and trending, as well as showcase topics highly relevant to Gen Z and brands looking to attract them. For more insights and tips on how to engage Gen Z and build loyalty for a lifetime, visit GenZInsights.com, driven by UNiDAYS.
Millennial Wedding Trends
Millennials have taken weddings to new heights. They are spending more, receiving less, dressing differently, eating better, coordinating more efficiently and partying much harder.
“Over the past few years, we have seen an average increase of $10,000 for millennial weddings. Our clients are ditching churches and building their own venues in industrial settings. They are giving back to the community asking for donations to their favorite charities rather than hosting registries,” said Jenny Chang, Founder of ROCKNEVENTS.
Attire
The style of wedding dresses is still very individual. Brides choose what looks good to them and their setting, and really varies from wedding to wedding. In regard to groomsmen and bridesmaids, we observed a transition from short to long sundresses for women and a strong consistency with Tom Ford suits for men.
Cuisine
Food adventures have been on the rise along with: oyster trucking, raw coconuts and custom catering from the couples favorite restaurant. Celebrity chefs, build-your-own desert stations and luxury culinary experiences is drawing the attention of millennial foodies.
Entertainment
Take the Bridal Chorus to a whole new level with electric violinists, drummers and pianists that can play multiple instruments at once using any limb available. Millennial wedding DJs are now pressured to mix music while playing a foot pedalled instrument all while engaging the crowd.
Invitations: One of the most exciting parts of a wedding is bringing your family and friends together. As a result, there is usually an age gap that requires invitations to be tailored to both. Millennials are leaning toward paperless, online website invitations rather than traditional direct mail. Website invitations are ideal for deciding which events to attend, what individual preferences are and getting your messages/updates out as efficiently as possible. For more traditional guests, sticking to the envelope invitation is your best bet.