
According to a Recent Study/Survey … Mid-January 2018 Edition
32 Min Read By MRM Staff
It’s a new year, so there’s plenty of new research. This first edition of Modern Restaurant Management (MRM) magazine’s “According to …” research roundup for 2018 includes exclusive results on Captain D’s Lobster Feast LTO from the experts at Sense360 as well as promising restaurant sales growth, trends in eating for the New Year and coffee, milk and chicken preferences.
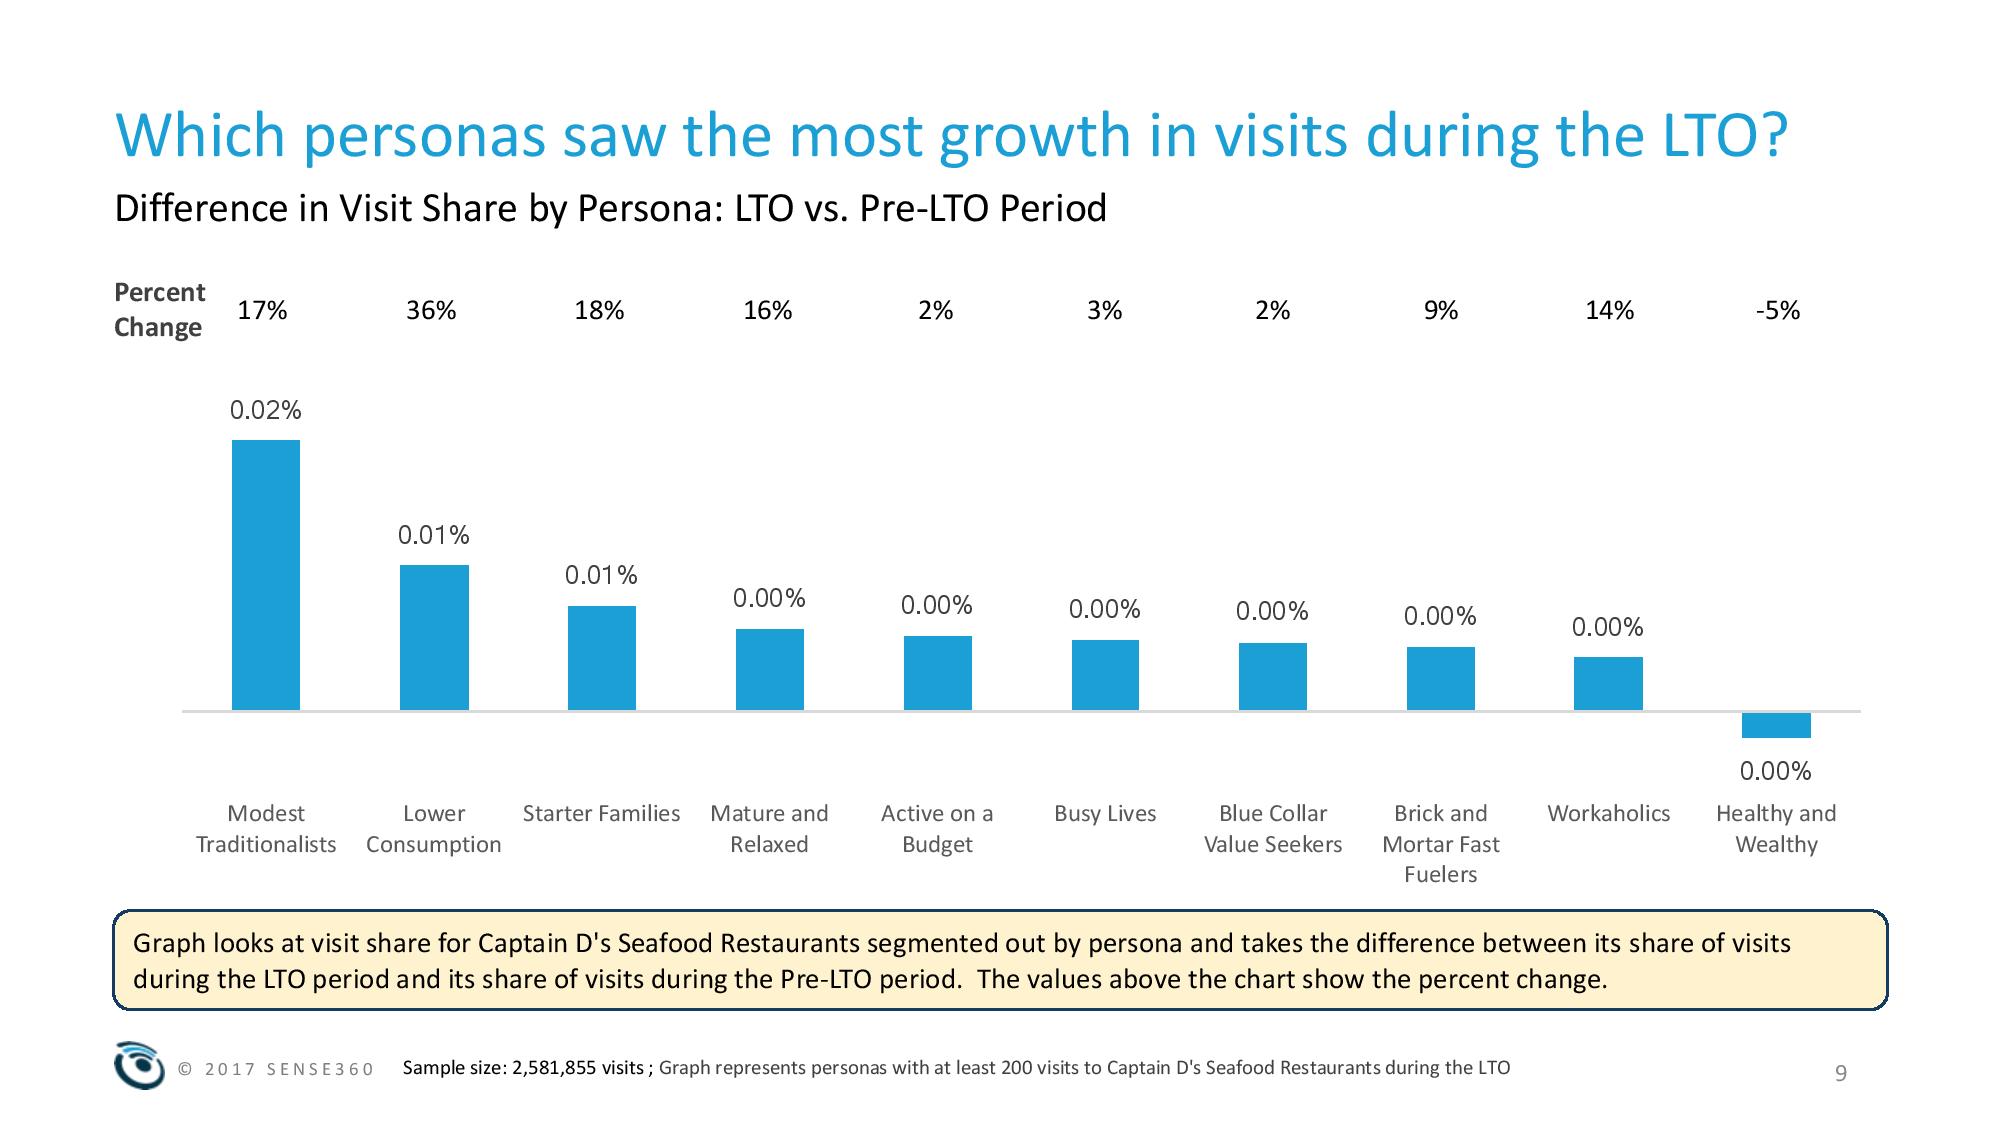
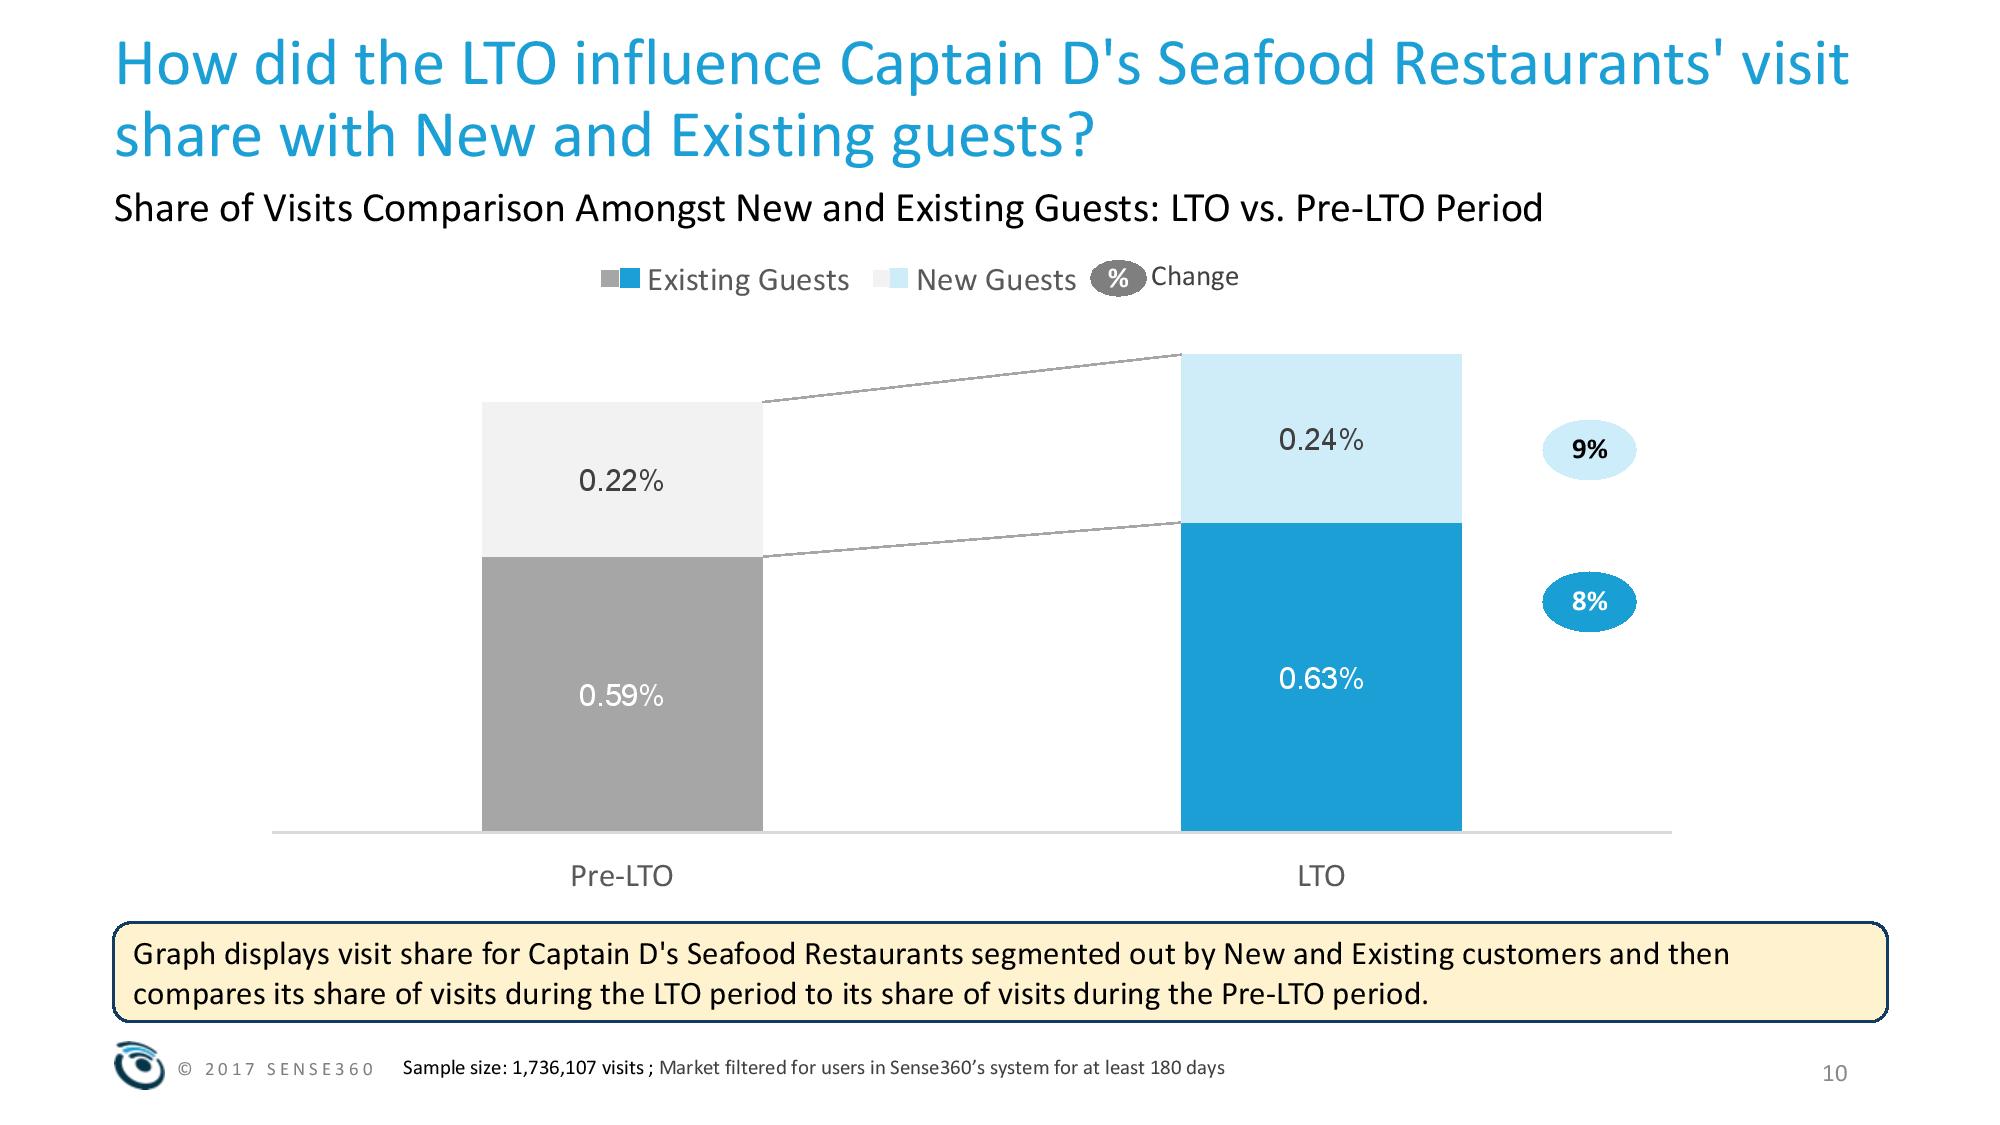
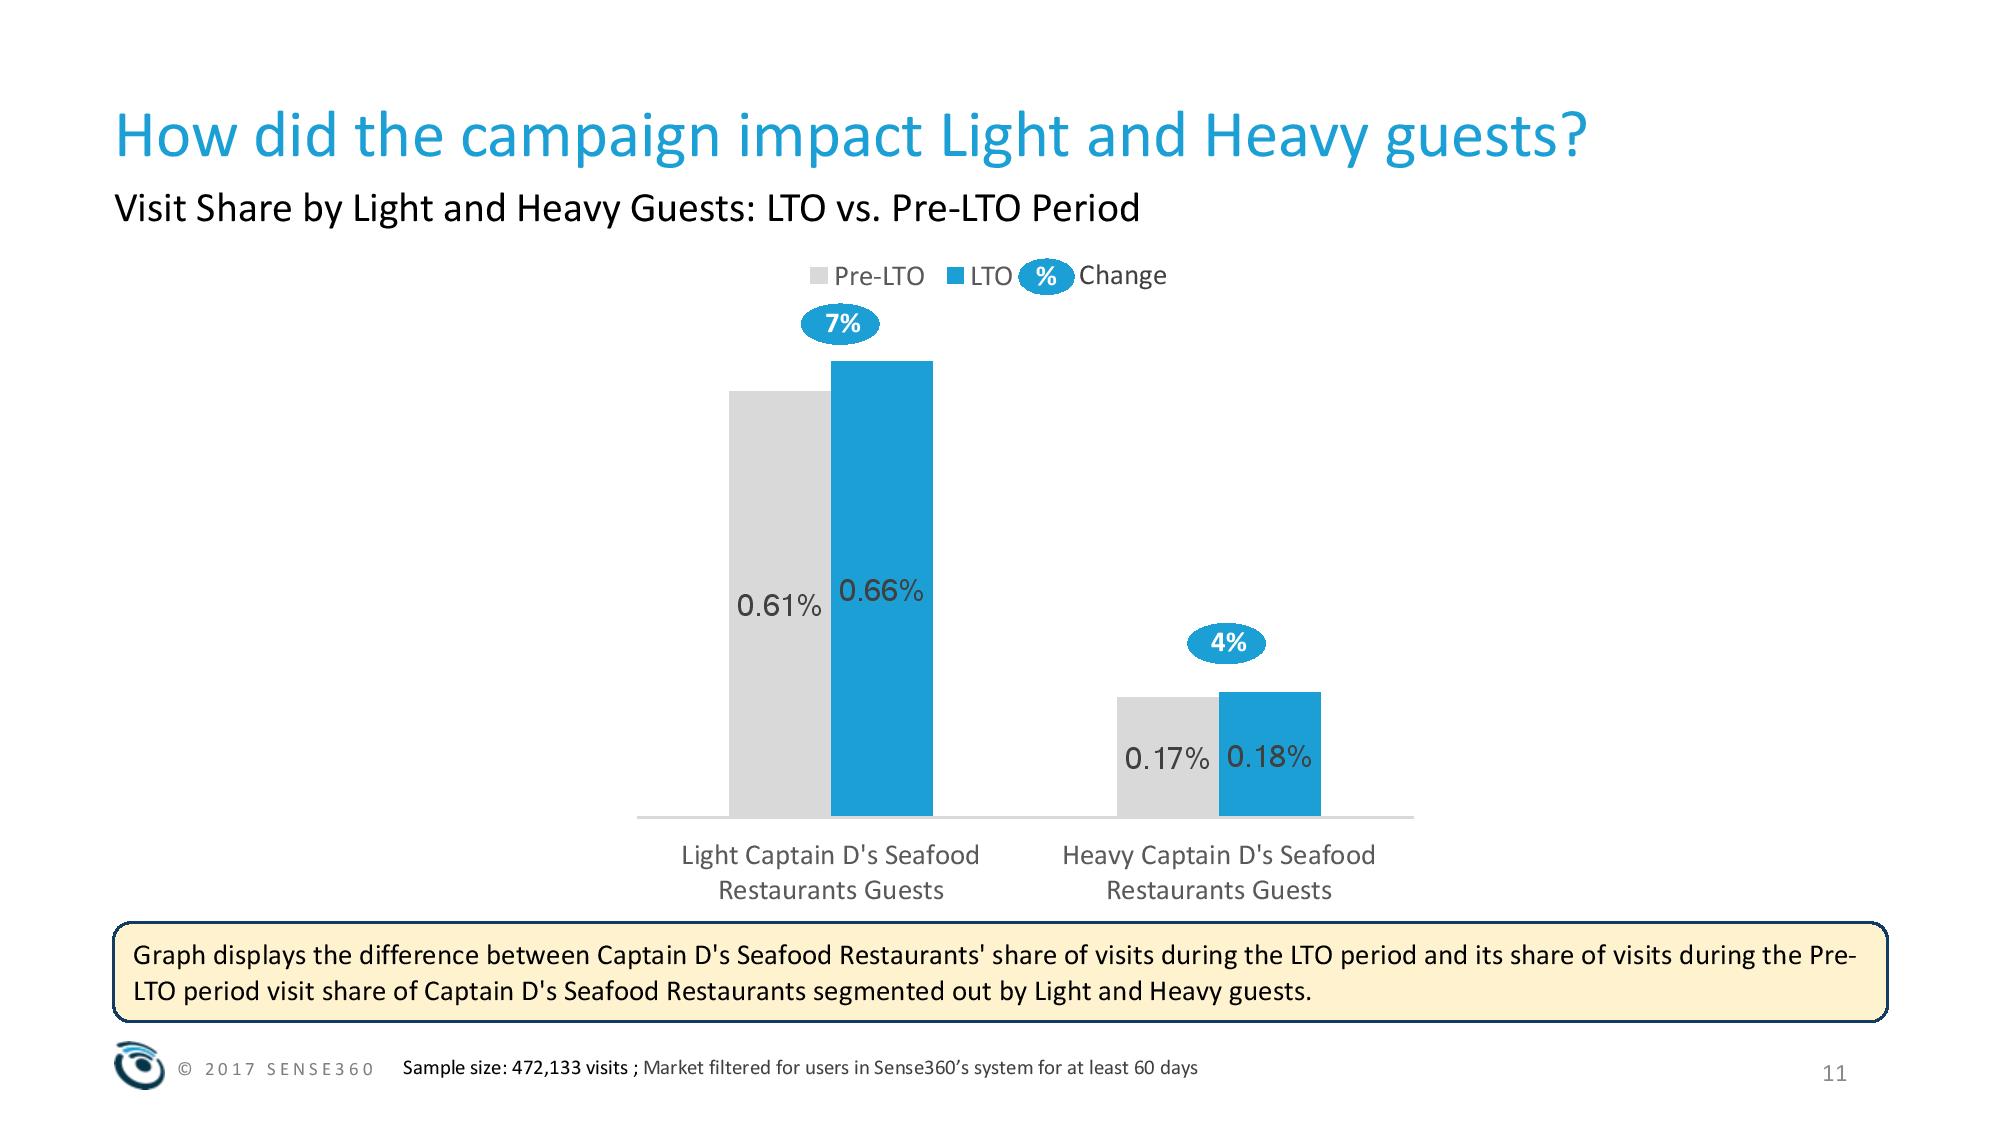
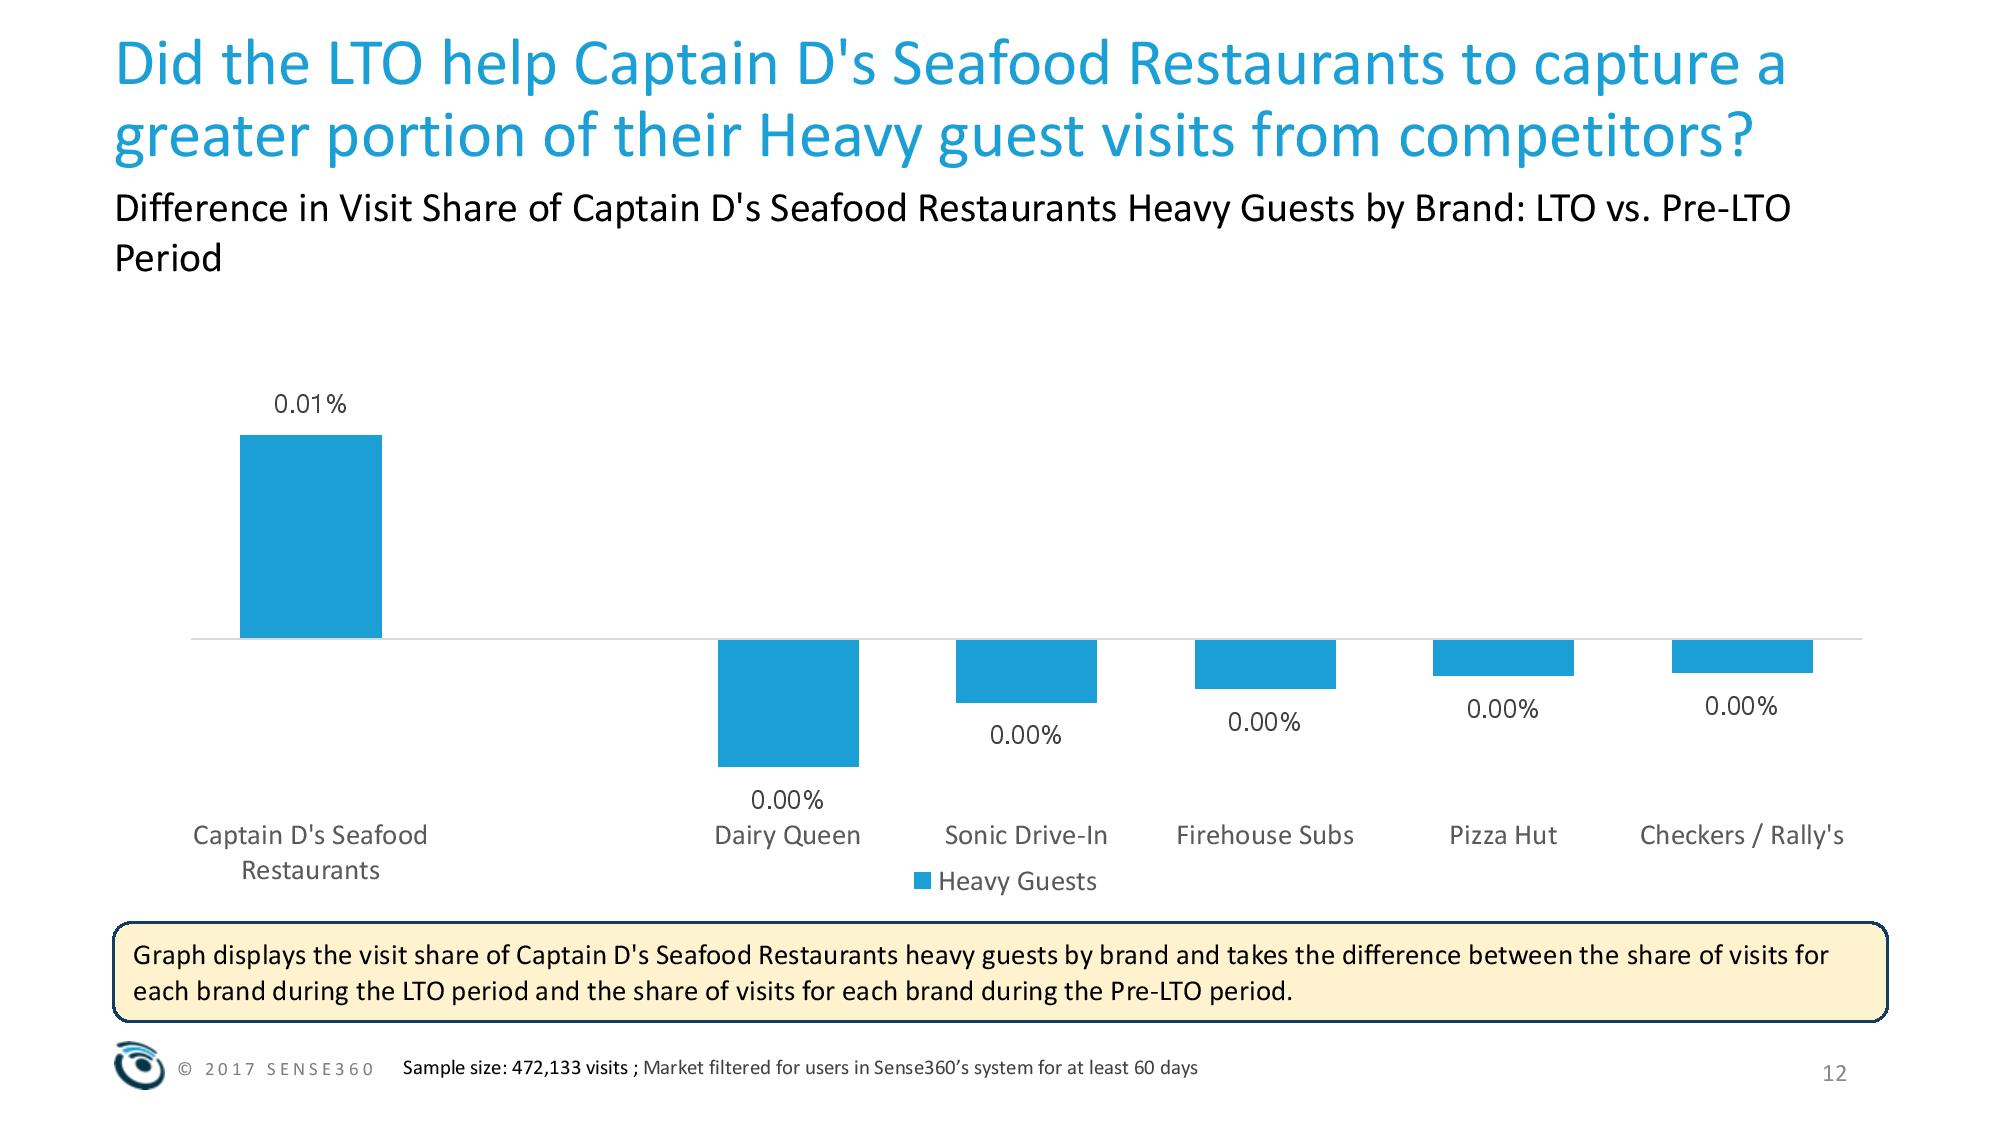
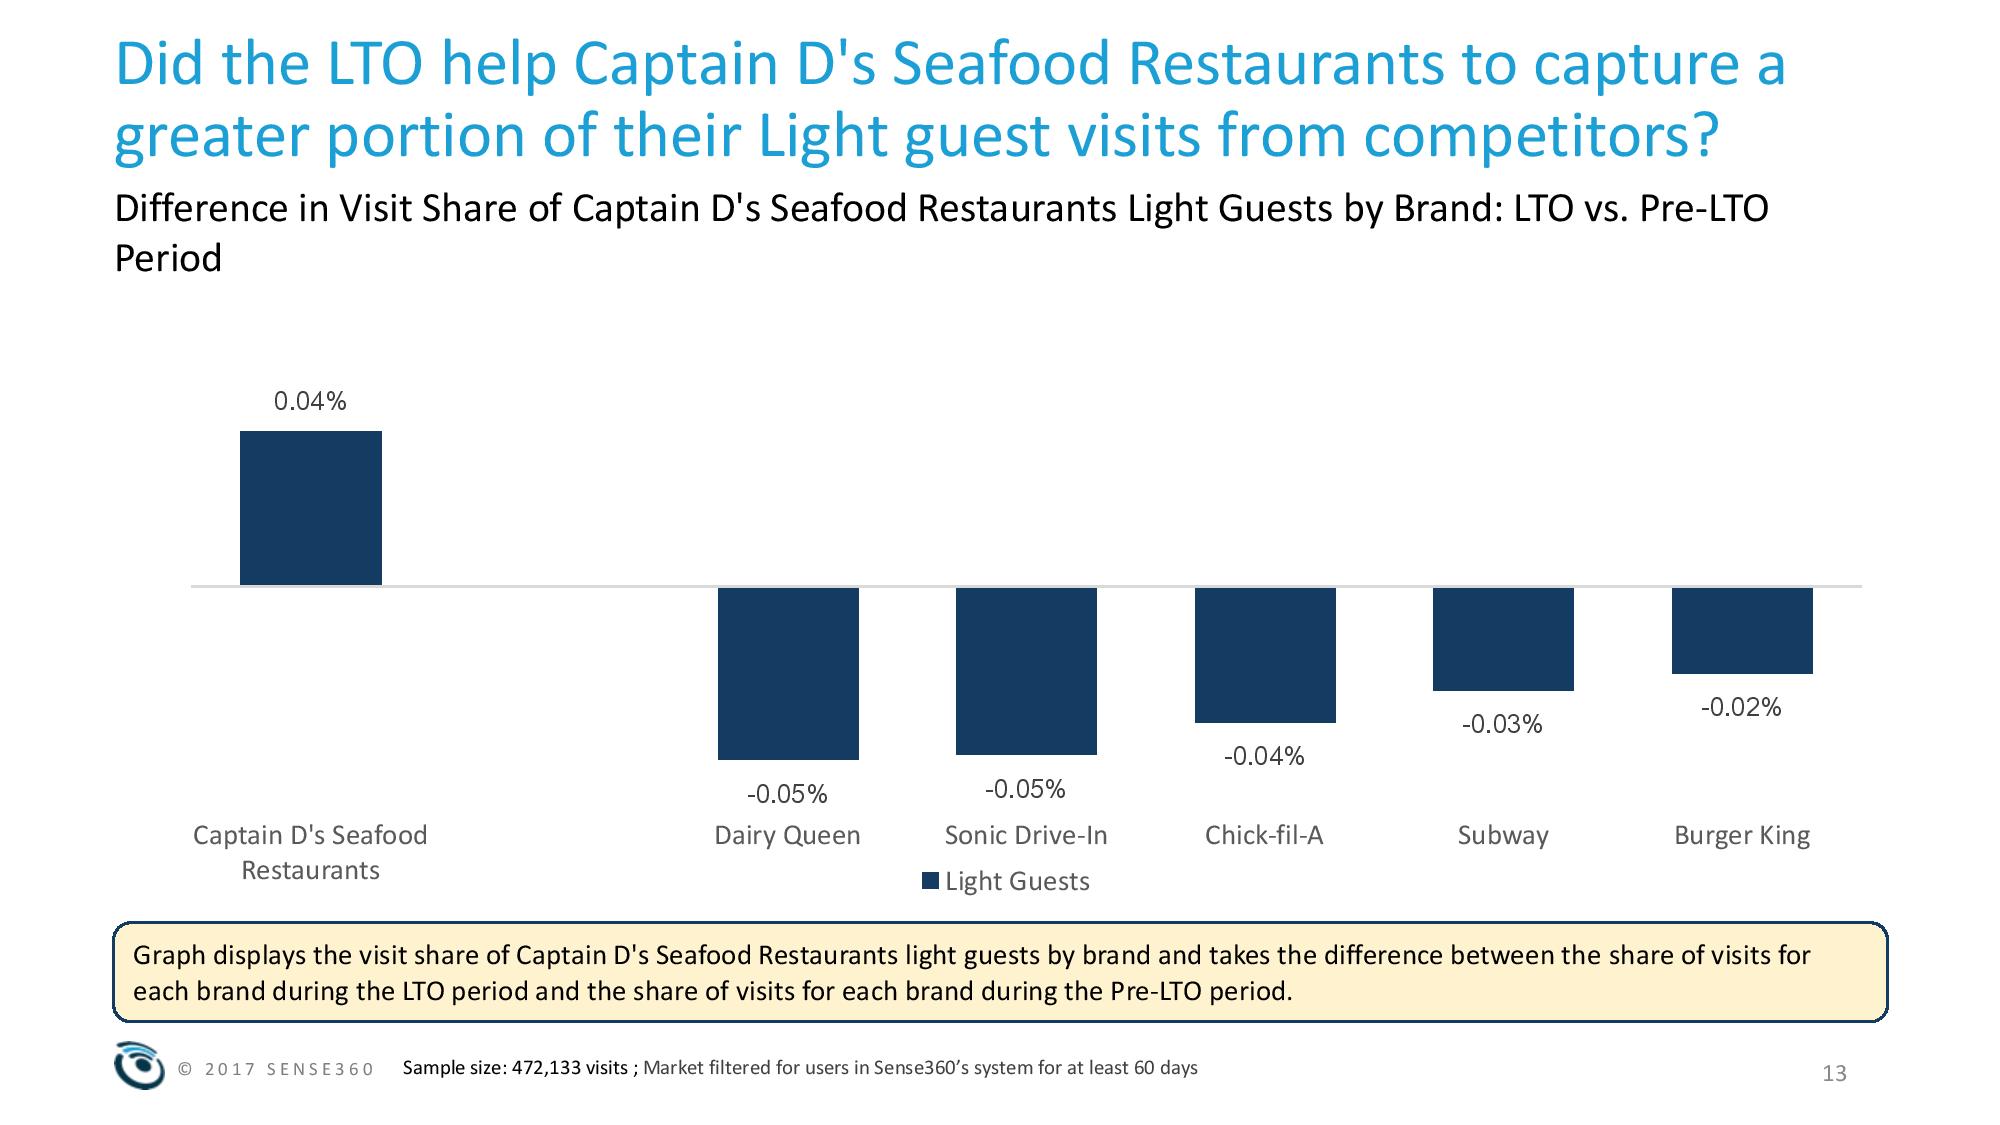
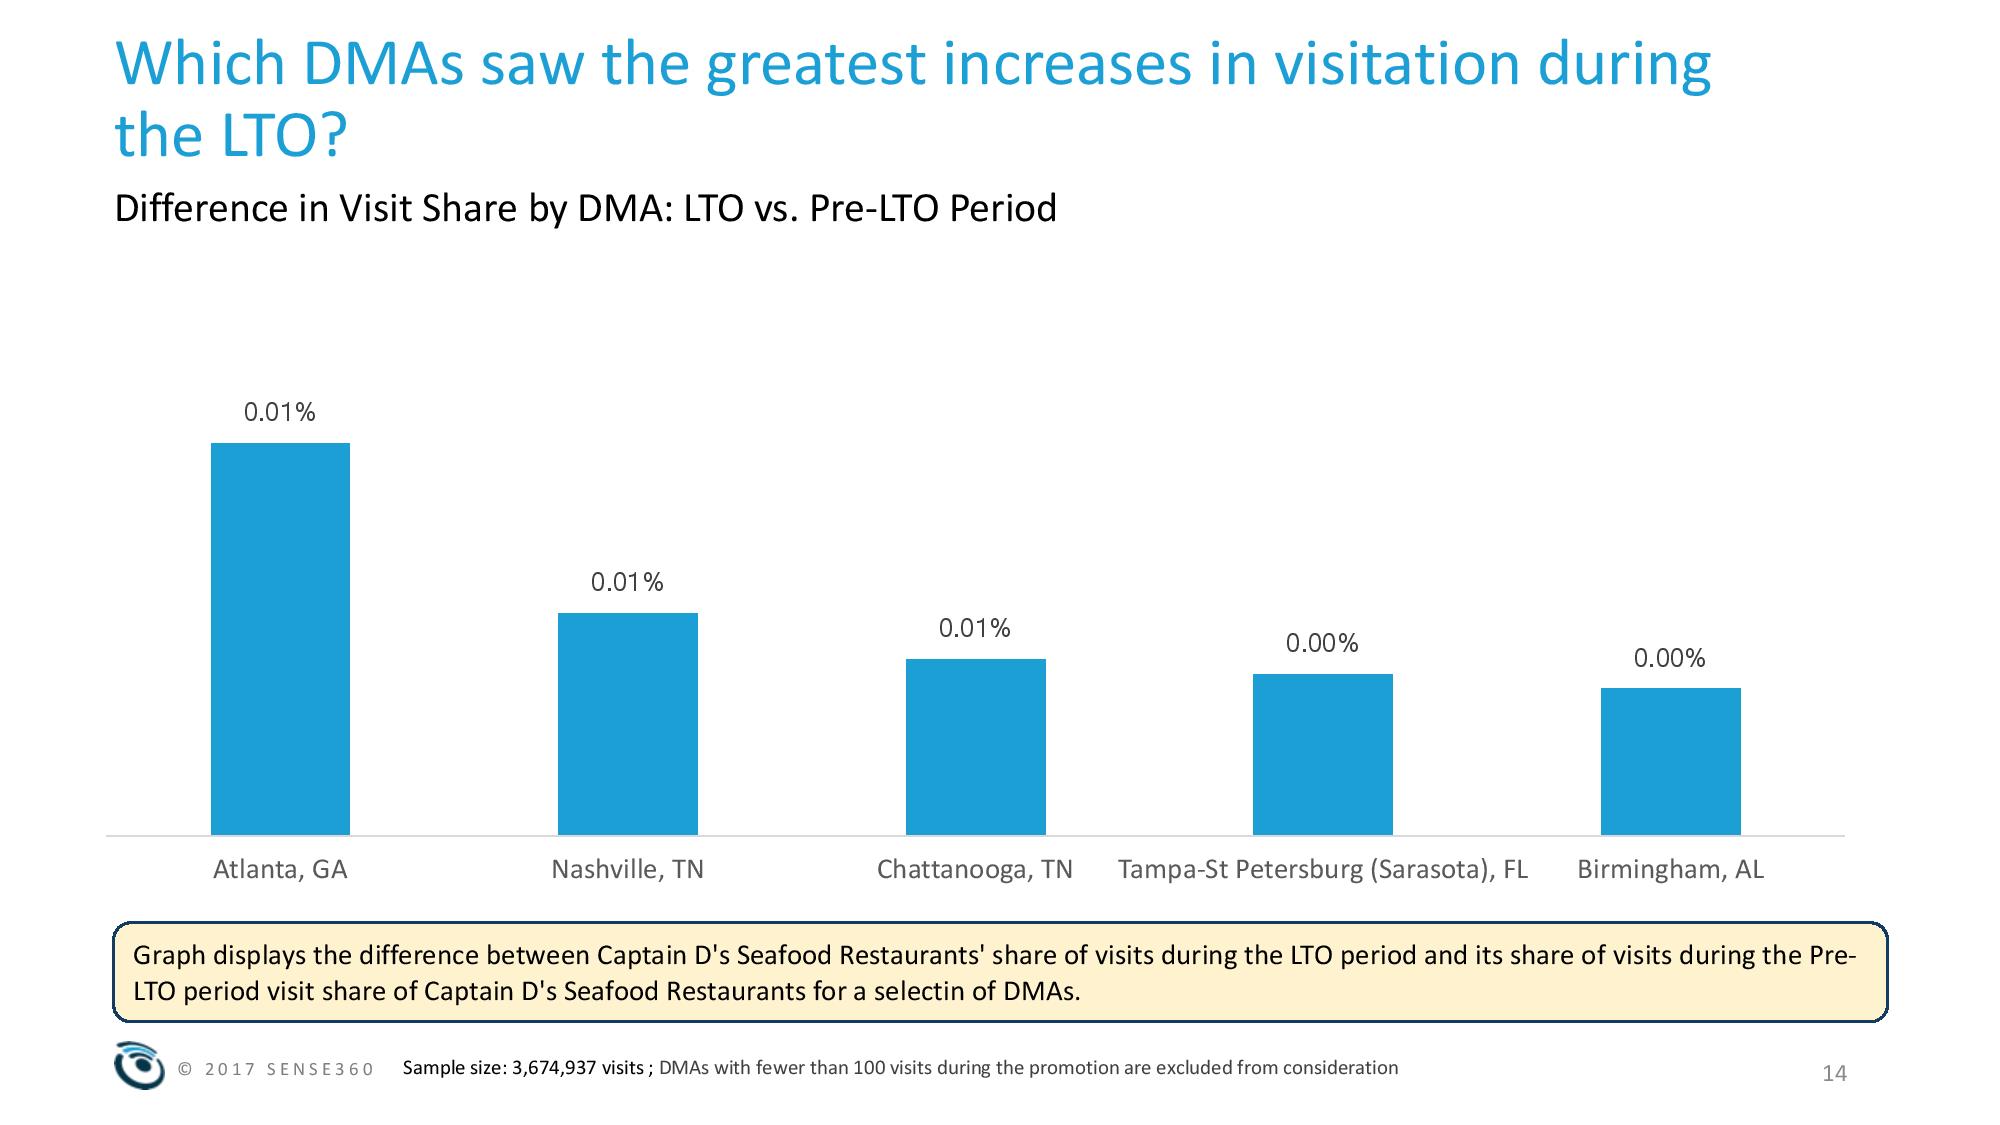
Lobster Love LTO
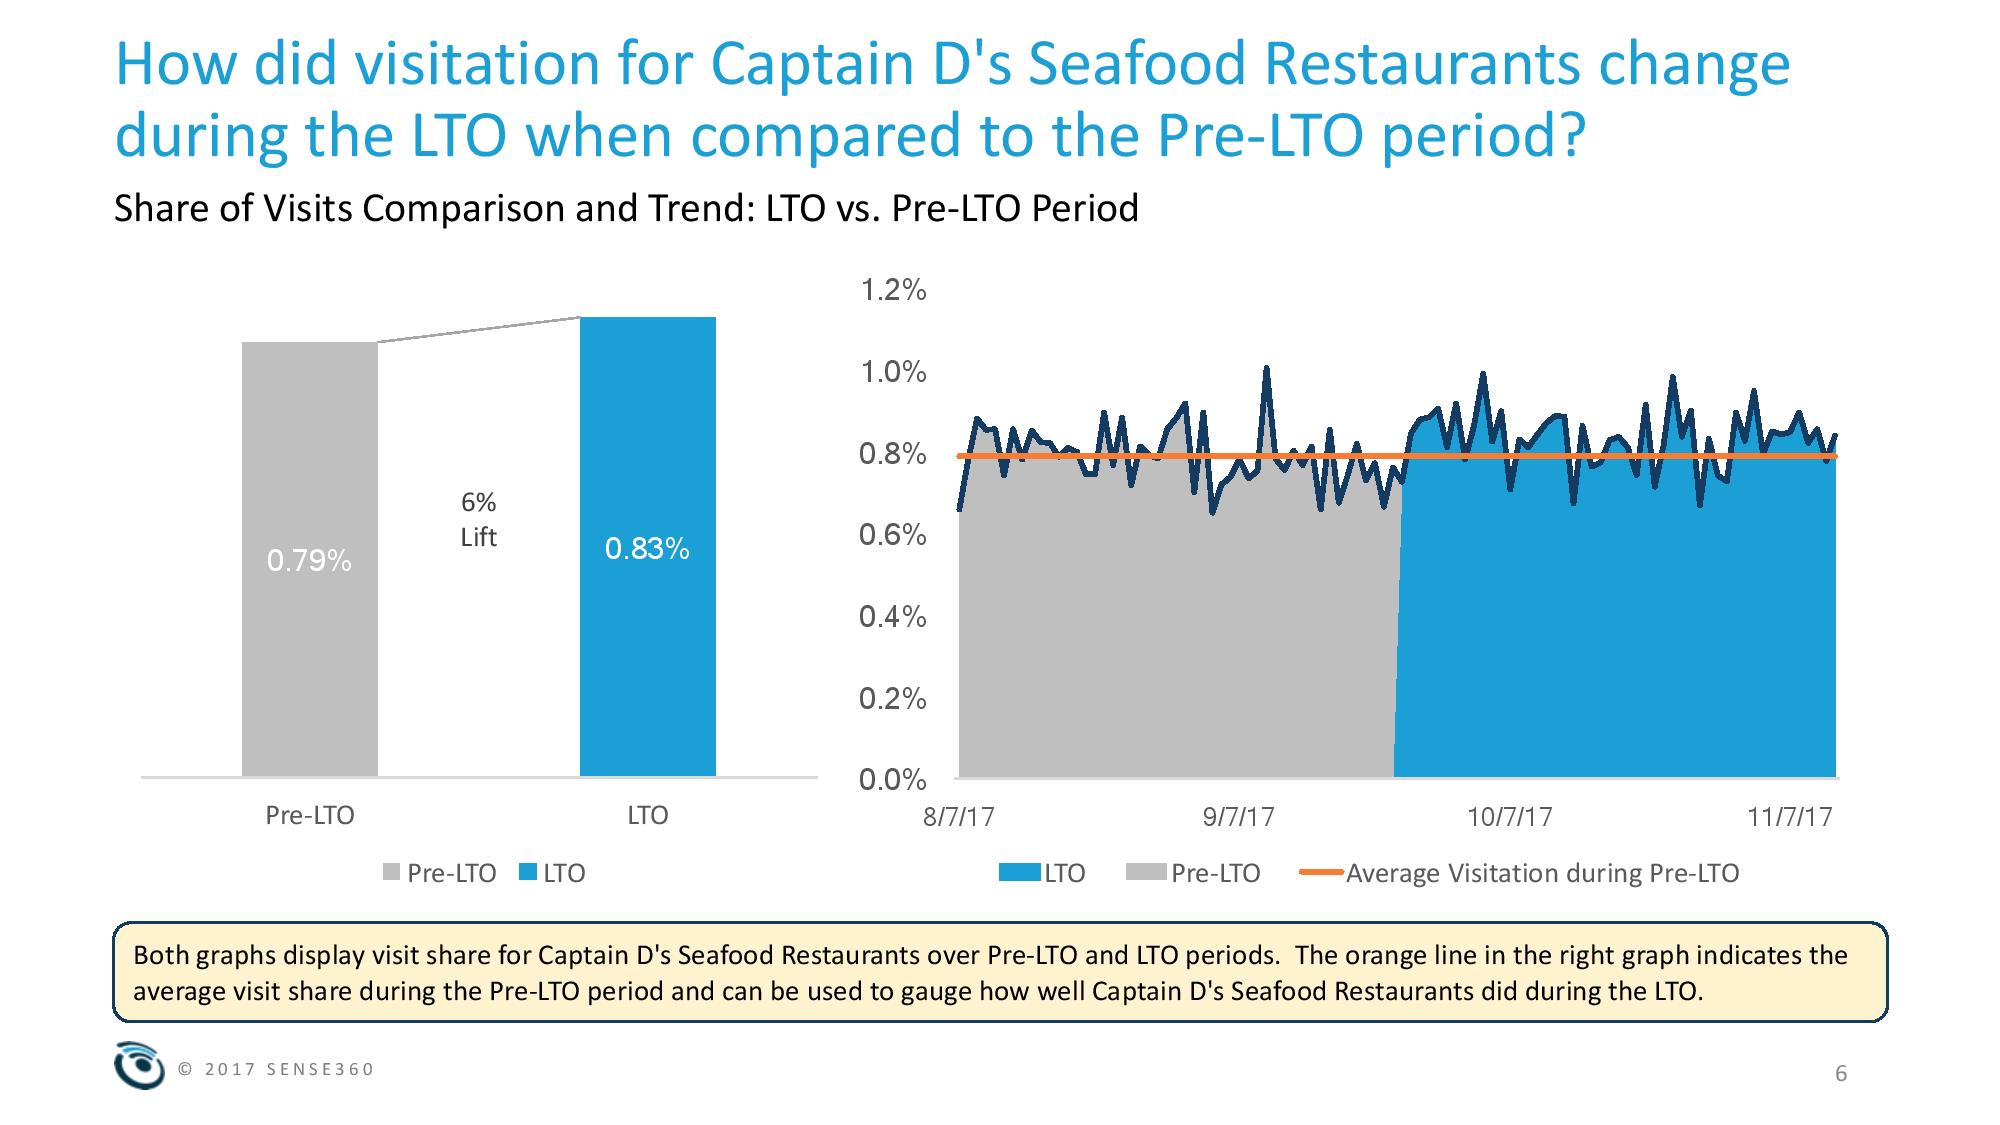
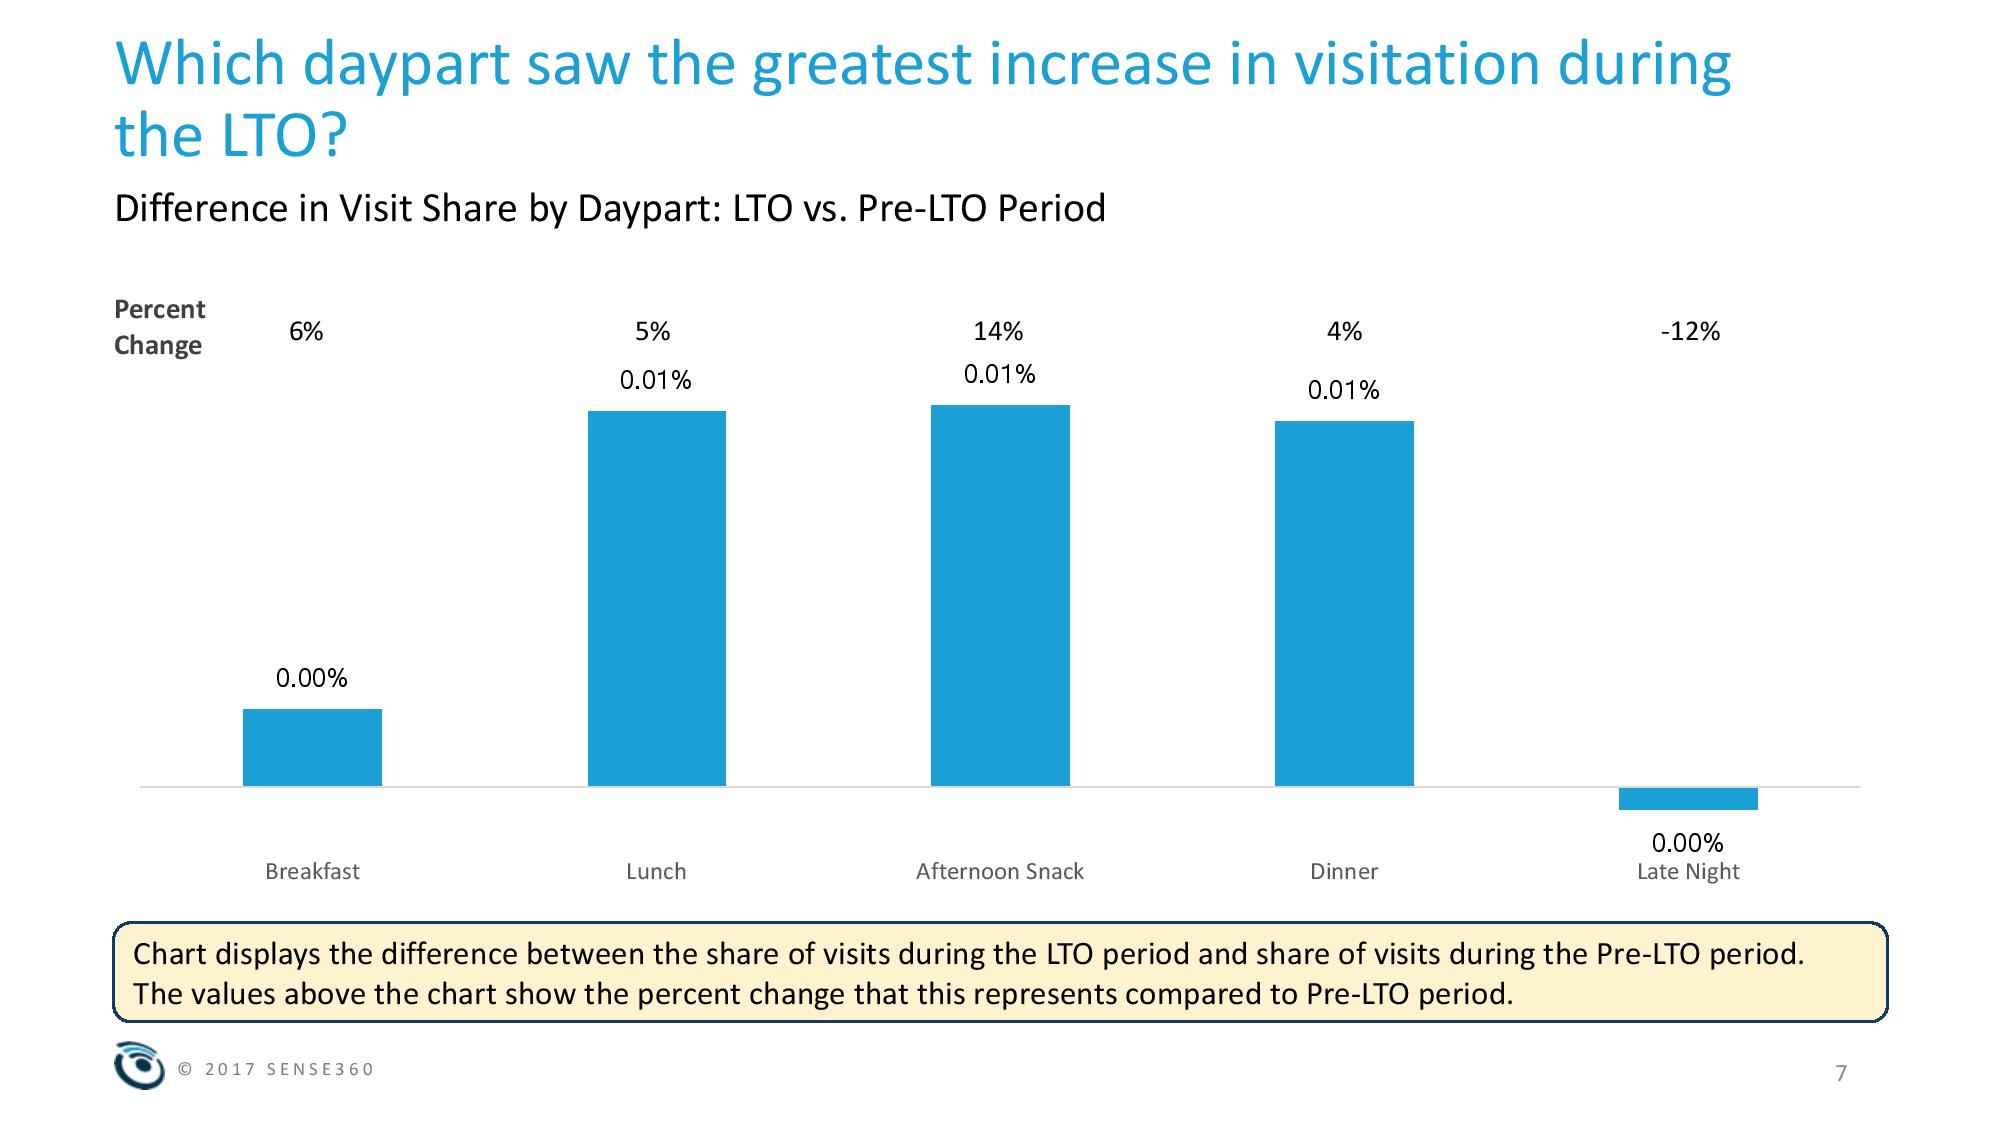
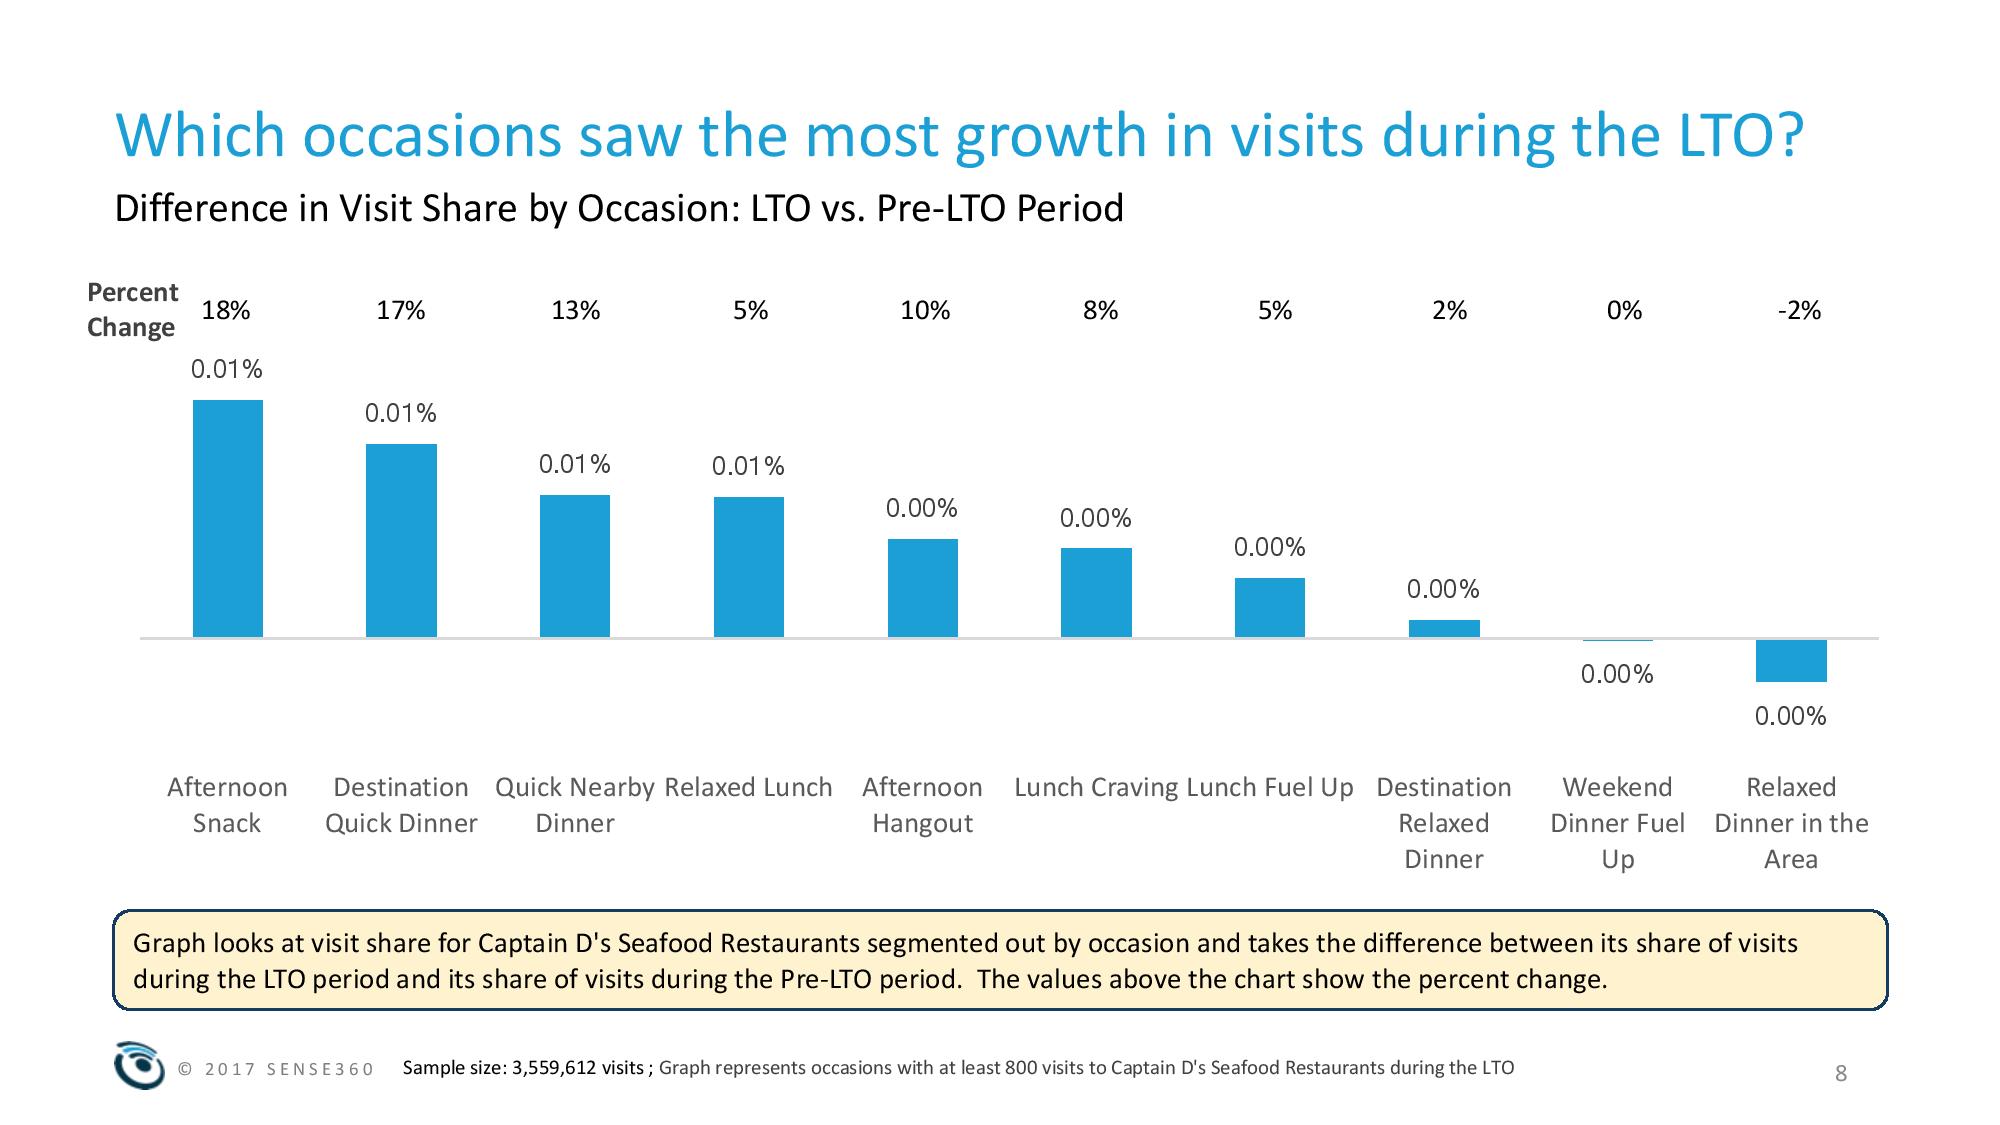
Sense360 examined Captain D’s Seafood Restaurant’s Lobster Feast promotion to gauge guest interest and visitation patterns.
Improved Restaurant Growth
Same-store sales growth for the fourth quarter was 0.4 percent, a very robust 2.6 percentage point improvement from third quarter results. This is the first quarter of growth in the last two years. The signs of relative improvement that the restaurant industry began showing since the beginning of the quarter continued through December. Restaurant same-store sales posted 0.3 percent growth for the month of December. This was the second-best month based on sales growth since March of 2016. The best month during that period was October of 2017, which is another sign that restaurants have been doing better in recent months. These insights come from TDn2K™ data through The Restaurant Industry Snapshot™, based on weekly sales from over 30,000 restaurant units, 170+ brands and represent over $68 billion dollars in annual revenue.
Traffic declined -1.8 percent in December, which also represented the second-best month in almost two years. Additionally, that was an improvement of almost 0.7 percentage points from November. Same-store traffic was -1.9 percent during the fourth quarter of 2017. While negative, it’s the best result posted by the industry in the last two years.
However, not all traffic improvement resulted to sales. Guest checks grew by 2.1 percent year over year, compared with 2.5 percent for the previous two months. This suggests some of that December traffic may have been brought in through promotions and discounting.
“Although it is great to see the industry move away from the recurring story of declining same-store sales, we also must keep things in perspective,” commented Victor Fernandez, executive director of insights and knowledge at TDn2K. “December of 2016 had very soft same-store sales and traffic results, so lapping over those results didn’t pose much of a challenge. Over a longer view, same-store sales declined by -2.0 percent during the fourth quarter of 2017 when compared with that same quarter in 2015. Furthermore, the trend of declining guest traffic continues to plague the industry and is one that seems unlikely to reverse any time soon.”
Annual Results Underwhelming Despite Fourth Quarter Recovery
The positive momentum experienced by the industry in the fourth quarter was not nearly enough to recover another disappointing year for restaurants. Same-store sales for all of 2017 remained at -1.1 percent, the same result posted in 2016. Traffic for the year fell by -3.2 percent, a 0.1 percentage point decline from the previous year.
Economic Growth and Consumer Spending Expected to Improve
According to Joel Naroff, president of Naroff Economic Advisors and TDn2K economist, “Despite what appears, at least on the surface, to have been a disappointing December job gain, the economy did end the year on a high note. The payroll data are volatile, so you need to look at the trend over time. Job gains averaged a very strong 204,000 per month during the final quarter of the year. Given the lack of workers, that pace is likely to be unsustainable. The strong demand for new employees boosted hourly wages, though adjusted for inflation, the increase was not great.”
“Still, with optimism sky high and incomes rising, consumer spending was strong during the holiday shopping season. As the tax cuts slowly bolster worker paychecks, the improvement in consumption should continue. With business investment also likely to improve, we could see growth of the economy in 2018 approach 3.0 percent. That creates expectations the recent rebound in restaurant spending will not only continue but possibly accelerate.”
Guest Check Growth Accelerating for Table Service Brands, Counter Service Driving Value
Despite the discounting strategy adopted by some brands, average guest check growth year over year accelerated considerably in the fourth quarter for the casual dining and fine dining segments and, to a lesser extent, for upscale casual brands as well.
Conversely, counter service brands appear to be continuing their value-based strategies to drive traffic. Average guest check growth decelerated year-over-year for fast casual and quick service during the fourth quarter compared with their third quarter growth.
Improvement Across All Restaurant Segments; Upscale Dining Still Winning
All industry segments saw an improvement in sales growth in the fourth quarter, and it was by far the best quarter of the year for most.
Upscale dining continued to win the same-store sales battle.
Upscale dining continued to win the same-store sales battle. The best performing segments based on sales in the fourth quarter were fine dining and upscale casual. This was the recurring trend throughout most of 2017.
Perhaps more encouraging for the industry was the improvement in sales growth for casual dining, fast casual and family dining, all of which achieved positive sales for the quarter. Fast casual and family dining had not seen a quarter of growth since the first quarter of 2016. Casual dining went through eight consecutive quarters of negative sales growth before finally being able to turn the trend around in the fourth quarter of 2017.
The Restaurant Workforce
In addition to the upswing in sales growth, restaurants have also seen some improvement in their hourly employee turnover results. For the third consecutive month, the industry saw small decreases in turnover rates in November. Although this is obviously welcome news for operators, turnover remains at historically high levels and is expected to remain a significant hurdle for restaurants in 2018.
Furthermore, turnover for all levels of restaurant management continued to rise in November. Restaurants have not been able to reverse the trend of rising management turnover rates which have afflicted the industry since the end of the recession. This is especially problematic since, according to TDn2K’s People Report™ research, management retention is one of the metrics that are most related to a restaurant’s sales and traffic performance and a big differentiator for top performing brands.
Management turnover remains at the highest rates reported for over a decade and are likely to remain at those troublesome levels throughout 2018 for most brands. But People Report studies have also shown that higher base pay, more generous bonus targets and manager training and development are all tools top performing brands have been able to leverage to improve management retention and achieve better results in the marketplace.
2018 Outlook
“It is a welcome change to report a positive quarter for our industry,” said Wallace Doolin, founder and chairman of TDn2K. “Our research leads us to conclude that not only the industry has changed, but the performance results continue to change.” The sales and traffic gap from top to bottom performers continues to grow. Success of the top performing brands is driven by superior results in retaining the best unit level talent to deliver the brand promise. “In 2018, we expect the macro economic climate to improve for the industry; however, it will not be a rising tide for all brands. Here is to a new year and a bigger share!”
Fourth Predictions for 2018
Fourth revealed its top industry predictions for 2018. With mounting pressure on hospitality leaders to decrease operating costs, improve customer service, and ultimately, maximize revenue, Simon Bocca, COO, Fourth, predicts that 2018 will be a year marked by immense operational changes within restaurants of all sizes driven by the deployment of modern technologies.
“The pace of technological change over the last several years has been remarkable, but we’ve observed that hotels and restaurants still struggle to create an integrated tech framework that automates what can be automated, and provides reliable, comprehensive insights into key performance indicators across every division of the business,” said Bocca. “With food, drink and labor costs increasing rapidly, and competition both for the guest dollar and the best talent tightening, the smartest leaders will be looking to properly leverage their technology to support their business goals. They will be looking for 360-degree insights by integrating data silos into one central reporting hub, enabling data to be seen in context and thus rendered significantly more meaningful.”
Machine learning automates and streamlines correct demand forecasting so the right inventory and labor are in the right place at the right time to meet demand. Legacy systems base demand forecast only on sales figures from comparable periods a week, month or year ago. However, new technology developments map past sales performance to local weather and local events, like sporting games or roadwork, to provide more accurate forecasts and help restaurant operators ensure they are adequately staffed and able to give guests the best experience.
Sustainable business practices will become a priority. Given a renewed focus on a healthy environment, 2018 will see customers put unprecedented levels of pressure on businesses to improve sustainability efforts. Consumers will want to better understand how their favorite restaurants and hotels are reducing food waste, food miles and supporting local growers and producers.
Restaurants and hotels will become more accommodating of customers with food sensitivities and allergies. Approximately 15 million Americans have food allergies, and even more have dietary restrictions, so restaurant operators will begin better accommodating their guests’ needs for accurate nutritional and allergen information, and dishes that cater to those with dietary restrictions. More restaurants will start outlining potential allergens on the menu, and operators at establishments of all sizes will need to share information accurately and reliably for greater customer loyalty and trust.
Security concerns will spur action. As data breaches increase in frequency, businesses will become more proactive about customer and personal data security. 2018 will be the year of adopting identity authentication technologies, which will be central to ensuring business data is better protected.
McDonald’s Back on Top
Entrepreneur magazine unveiled its 39th annual Franchise 500®, ranking McDonald’s as number one for the first time since 2000. The Golden Arches’ fortunes have turned thanks to CEO Steve Easterbrook’s vision for reimagining the brand as an “experience of the future,” by continuing to invest in technology like touch-screen ordering kiosks, responding to customers’ clamor for all-day-breakfast and more value items, and accelerating the conversion of thousands of company-owned units into franchises, they said.
The range of applicants this year demonstrates that more new companies are looking to franchising as a sustainable way to grow their brands.
Last year’s number one company, 7-Eleven, came in at number two this year, followed by Dunkin’ Donuts, The UPS Store, and Sonic Drive-In Restaurants to round out the top five.
This year’s ranking was one of the most competitive ever, with 1,023 companies vying for a spot in the top 500—the first time applications have surpassed the 1,000 mark in 25 years. The ranked companies added a net total of 24,899 franchises from mid-2016 to mid-2017, a 5.6 percent increase and more than 60 percent of that growth was outside the U.S.—evidence of the unlimited potential of franchising, both domestically and abroad.
The range of applicants this year also demonstrates that more and more new companies are looking to franchising as a sustainable way to grow their brands. Almost 22 percent of the companies that submitted started franchising just in the past five years. Twenty-one of those newcomers ranked in the top 500. The highest ranked, at number 18, is electronics repair brand uBreakiFix. The youngest is Lendio, which began offering small-business-lending franchises in 2016 and is ranked number 201.
“This year’s ranking features both up-and-coming trends and savvy stalwarts that have thrived for decades thanks to their ability to evolve with the times—and we are proud to highlight and celebrate them all,” says Jason Feifer, editor in chief of Entrepreneur. “Our results show that the industry is strong—and that the strongest franchisors are those who’ve learned to balance between innovating to attract new customers and remaining reliable enough to keep the old ones happy.”
To view the full ranking, click here.
What’s Hot in Beef
The annual What’s Hot culinary forecast released by the National Restaurant Association named “new cuts of meat” as the top trend for 2018. As the authority on all things beef, the Beef. It’s What’s For Dinner. Culinary Center chefs and meat scientists have put together a list of the top five innovative cuts you need to know.
1) Shoulder Tender
2) Sirloin Bavette
3) Coulotte
4) Petite Sirloin
5) Tri-Tip Roast
While many of these cuts are available to the home cook, some are just starting to gain popularity in restaurants.
“If you like Brisket, you might want to try a Tri-Tip Roast. Or, if you’re in the mood for Strip Steak, you will probably enjoy the Coulotte,” explains ChefLaura Hagen, senior director, culinary, National Cattlemen’s Beef Association, a contractor to the beef checkoff. “It’s exciting to see innovative cuts gain popularity across the country. Diners and home cooks shouldn’t let a name they don’t recognize keep them from trying something new.”
The Shoulder Tender is a lean cut that is shaped like the Tenderloin, but smaller. Like Tenderloin, it can be cut into medallions and is great for grilling, roasting, or broiling.
The Sirloin Bavette, also known as the Sirloin Flap, is a thin boneless cut that’s great for fajita meat. It should be marinated and then grilled or broiled.
The Coulotte, a juicy, savory roast, is known by many other names including Top Sirloin Cap. It is best roasted in the oven or smoked slowly on the grill. It can also be cut into Coulotte Steaks.
The Petite Sirloin, also known as the Ball Tip, is a small roast. It’s a great cut for someone looking to maximize value and can be roasted, broiled, or braised.
Finally, the Tri-Tip Roast is well known across much of the west, but is just gaining popularity on the East Coast. This lean cut is tender, full of flavor and can be grilled, roasted, braised, or broiled.
Attraction for Animal Fat
In its third iteration, a new consumer survey from Coast Packing Company and Ipsos Research indicates that Americans 35 and up are more receptive to including animal fats in their diet than they were a year, or two years, ago — and are acting accordingly.
While the embrace of animal fats by millennials – those ages 18 to 34 – emerged as the dominant story in the previous two studies, receptivity to animal fats isn’t limited to millennials. Both age segments of older respondents showed an increase in openness to animal fats, with 35-54 year-olds moving from 12 percent to 15 percent, and respondents ages 55+ more than doubling their receptivity to animal fats over the past year, from 3 percent to 7 percent. Among millennials, 16 percent say they’re open to animal fats. By gender, men are markedly more receptive than women — 15 percent to 10 percent.
A similar relative shift in consumption is occurring among the two older age segments: 35-54 year-olds moved up from 9 percent to 11 percent, and respondents age 55+, from 1 percent to 3 percent, marking an increase in animal fat consumption. Among millennials, consumption increased by 13 percent. Mirroring the data on attitudes, consumption by men increased 12 percent vs. 6 percent for women.
As in the original baseline study – conducted in November 2015 – this new survey of 1,000 adults examined how attitudes about animal fats in the American diet have changed in recent years, and how consumption patterns may be changing as well. Respondents were asked whether they were more or less open to animal fats, and whether those views extended to actual behavior. Coast Packing is the number one supplier of animal fat shortenings in the Western United States.
“Our latest results show that animal fats are gaining greater acceptance among older Americans,” said Eric R. Gustafson, CEO, Coast Packing. “We’re gratified that there’s more mainstream openness to, and stated consumption of, animal fats by those over 35 since the last time Coast and Ipsos posed these questions. Clearly, healthy animal fats like lard and beef tallow are back, affirming that past surveys were not an aberration.”
As 2018 trend forecasts hit the headlines, foodies appear to agree. “It seems Deep Fried is making a big come back for 2018,” says Fine Dining Lovers in its report, “12 Food Industry Trends for 2018” “Deep fried squash, deep fried and battered eggs, deep fried tempura pizza — we’ve eaten all this in 2017. The deep fried trend seems like it’s here to stay. There’s also a new appreciation for really good deep fried chicken, perhaps pushed by the likes of David Chang who has been smearing caviar on his fried chicken sandwiches for a while now.”
Seconding the notion is LoveFood.com, which includes lard among the “24 Foods You Need to Try in 2018”
“Bakers know the benefits of lard for producing a light, flaky crust. But this rendered pork fat has been shunned over the years from people worried about their health, yet it has less saturated fat than butter. And it’s making a comeback. Give it a go and make these fluffy golden doughnuts.”
“This somewhat older demographic recalls the old days with fondness,” said Ernest Miller, Coast’s Corporate Chef. “These consumers value authenticity and want food that is made with integrity and respect for culinary traditions, food that is true to its roots and culture. That’s why the natural makeup of both lard and tallow matter so much. Neither contains the artificial trans fats found in hydrogenated shortenings. These products are best when minimally processed, which is consistent with the whole movement in food and cooking right now. That makes healthy animal fats both timely and timeless – whatever your age.”
The Great Bone-In or Boneless Debate
It’s that time of year when a lot of people hunker down indoors to watch sports and eat chicken wings. Just as sports enthusiasts choose a team, wing enthusiasts choose their type of chicken wing, either bone-in or boneless*, says The NPD Group, a leading global information company. With 45 percent of the population ordering chicken wings at restaurants and foodservice outlets and servings on the rise, it behooves restaurant operators to know who is on team bone-in and who is on team boneless.
And the most popular type of chicken wing is…: bone-in. The demand for bone-in chicken wings is strong. Over sixty percent of wings served at restaurants are bone-in. Further, over the past year, servings of bone-in were up six percent while declining by a similar rate for boneless, according to a new NPD study entitled, The Chicken Wing Dilemma.
The NPD study, which is based on its Checkout consumer receipt harvesting service, examines the purchase patterns of wing buyers and how restaurant operators react to fluctuating wing prices. Wing prices increased during the summer while the demand remained high but prices declined over the past three months. Boneless wings are more heavily promoted over bone-in wings when prices are high.
“Foodservice operators and suppliers offering chicken wings need to understand purchase patterns of wing buyers in order to menu appropriately, price accordingly, and tailor marketing to grow in the headwinds of price increases,” said Bonnie Riggs, NPD’s restaurant industry analyst. “Most wing buyers aren’t fair weather fans; they are super fans who stick with one type of wing regardless of price.”
On-the-Go- Ordering
What products did Dunkin’ Donuts customers order most from On-the-Go Mobile Ordering?
- Iced Coffee
- Hot Coffee
- Breakfast Sandwiches
- Donuts
- Wake-up Wrap® Sandwiches
- Iced Espresso
- Hot Espresso
- Cold Brew
- Bagels
- Iced Tea
Green Coffee Trends
Mintel research reveals that Britain’s coffee shop drinkers are happy to do their bit for the environment, but not at any cost.
- 40 percent of out of home hot drinks consumers wouldn’t mind paying extra for drinks served in 100 percent recyclable cups.
- 73 percent of coffee shop drinkers say price increases would make them cut back on out of home drinking.
- Café latte (35 percent) and cappuccino (33 percent) are Brits favourite coffee shop brews.
While Brits love their coffee, they also love the environment. Mintel research finds as many as 40 percent of out of home hot drinks consumers* say they wouldn’t mind paying extra for drinks served in 100 percent recyclable cups (eg 100 percent paper, 100 percent compostable). This sentiment is particularly strong among 20-24-year-olds with half (51 percent) saying the same. Furthermore, 58 percent of consumers* think coffee shops should offer a discount to those using their own travel mugs.
Although the nation is keen to cut down on packaging waste, price is an issue for many, as three quarters (73 percent) of coffee shop drinkers** admit price increases would make them cut back on out of home drinking.
However, consumers are open to seeing environmentally-friendly changes introduced in other areas of the coffee shop. Four in five (82 percent) Brits believe coffee shop outlets should provide recycling bins, while three quarters (75 percent) agree restaurants should use recyclable packaging for takeaway/home delivery; a view which is particularly strong among the over 45s (78 percent).
Trish Caddy, Foodservice Analyst at Mintel, said: “The BBC’s Blue Planet II series really catapulted plastic pollution back into the public debate, and some businesses are already taking the lead in helping ‘nudge’ consumers to play their part in reducing waste.
“Our research shows that while consumers have great environmental intentions, they are often very time pressured. Also, the hassle factor of carrying around reusable coffee cups could limit the popularity of schemes that reward people for doing so.
“A more effective solution would be to make things easier for consumers by making cups more easily recyclable by, for example, using 100 percent biodegradable packaging rather than recycling the plastic.”
Coffee shop sales to reach £3.7 billion by 2022
In 2017, Brits were estimated to have spent £3.4 billion in coffee shops, growing just under 1 percent from the previous year. Over the next five years, sales are expected to increase a further 10 percent to reach £3.7 billion by 2022.
Overall, four in five (79 percent) Brits bought a hot drink out of home in 2017**, rising to 90 percent of younger Millennials aged 18-27. Meanwhile, coffee shops are drawing 87 percent of parents of children under the age of 16.
“Younger Millennials and parents make up the core consumers for coffee shops. Younger Millennials are drawn to new offerings, while parents care about ethical sourcing and premium quality experiences. However, our research shows that this group is spreading their budget across a larger number of establishments that now sell coffee, including non-specialists that have expanded into low-cost coffee alongside food offerings. This move threatens to take market share from coffee shops.” Comments Trish.
The battle of the bean: latte or cappuccino?
Finally, when it comes to the battle of the coffee shop bean, it’s a close call. When asked about drinks bought in coffee shops, Brits rank café latte (35 percent) and cappuccino (33 percent) as their favourite brews**. Meanwhile, hot chocolate (23 percent) is the nation’s third most popular coffee shop beverage.**
When it comes to coffee, gentlemen prefer cappuccinos (36 percent vs 31 percent of women), while Britain’s ladies love a latte (37 percent versus 33 percent of men). But it is the nation’s middle aged drinkers who are the biggest consumers of espresso-based drinks. Some 43 percent of women aged 35-54** order café lattes, while 42 percent of men aged 35-54** opt for cappuccinos. Meanwhile, hot chocolate drinking peaks among those aged 16-34 (37 percent).
While Brits are famed for their love of tea, just a fifth (21 percent) of coffee shop users have bought English breakfast tea at coffee shops, while espresso/macchiato and americanos are the choice of fewer than one in five (18 percent) coffee shop consumers.
“Italian-style espresso-based drinks are still amongst the most popular in the UK, especially among middle aged consumers, and are important to retaining interest from this group. Where popularity is waning is with younger generations who are drawn to chocolate-based drinks like mocha and hot chocolate. There are plenty of opportunities for coffee shops to tap into the latest trends, with freshly shaken ice drinks such as mocktails proving particularly popular with younger Brits – as a quarter of young Millennials express interest in these drink types. Brands could also appeal to older drinkers by making the most of their interest in cake and coffee/tea deals and food pairings.” said Caddy.
Popular Non-Dairy Alternatives
As the popularity of plant-based nutrition grows, it seems non-dairy milk* is increasingly finding its place in Americans’ refrigerators. New research from Mintel reveals that non-dairy milk sales have seen steady growth over the past five years, growing an impressive 61 percent since 2012, and are estimated to reach $2.11 billion in 2017.
While almond (64 percent market share), soy (13 percent market share) and coconut (12 percent market share) remain staples in the category, new non-dairy milk types are sparking excitement as consumers look to diversify their non-dairy milk repertoire. Indeed, new varieties have experienced fast growth in popularity as two thirds (63 percent) of those who have purchased pecan milk say they bought more pecan milk in 2017 than in 2016, while 58 percent of quinoa milk consumers say they bought more quinoa milk in 2017 than the year prior.
“While almond, coconut and soy milks remain the most popular types of non-dairy milk, other nut and plant bases are gaining traction, including pecan, quinoa, hazelnut and flax milks. Both established and new brands are taking advantage of the growing non-dairy milk segment, innovating with alternative non-dairy bases. Innovation will be a catalyst to drive the category forward in 2018 as both mainstream bases like almond and alternative plant bases offer added functional benefits and unique flavors. We predict that new plant bases such as cashew and rice will allow new entrants into the non-dairy milk category to eventually surpass the soy milk segment, one of the first non-dairy milk segments to really take off with consumers,” said Megan Hambleton, Beverage Analyst at Mintel.
As flavor innovation catches consumers’ eyes, Mintel research shows that flavored milk is the fastest growing segment of the dairy milk category over the last five years, with sales estimated to reach $1.74 billion in 2017, an 18 percent increase since 2012. And it seems there will be no slowing down in years to come as sales of flavored milk are forecast to continue to grow 21 percent by 2022. Behind this sales growth is an increase in interest from consumers for their favorite flavors as two in five (40 percent) dairy milk consumers** agree that they bought more flavored cow’s milk in 2017 than in 2016. What’s more, one in 10 (11 percent) dairy/non-dairy milk consumers*** agree they are buying more milk because of the innovative flavors.
Despite sales making a splash, flavored dairy milk has room to grow as just one quarter (23 percent) of Americans say they have purchased flavored cow’s milk such as chocolate****. While children under age 18 are more likely (78 percent) to drink flavored milk, it seems adults are pouring themselves a glass as well, with more than three quarters (76 percent) of adult flavored milk buyers saying they drink flavored milk.
Another segment gaining momentum is whole milk as sales have increased eight percent since 2012 and are estimated to reach $5.36 billion in 2017. As many consumers move toward a more natural and holistic approach to nutrition, skim/low-fat dairy milk sales have decreased 28 percent in the last five years and shelf stable dairy milk sales have decreased nine percent. Overall sales in the dairy milk category have fallen 15 percent since 2012, reaching an estimated $16.12 billion in 2017.
As the dairy milk category increasingly faces cross-category competition, flavor will play a growing role in determining where consumer dollars go. Appealing to kids and adults, flavored milk is one of the only milk types that lends itself to multiple occasions such as being consumed on its own as a thirst quencher, accompanying a meal or as a post-workout recovery drink. With the increase in flavor options, as well as innovations that promise better nutrition, flavored milk will be a segment that helps fill the gap left by skim and low-fat milk options,” continued Hambleton. “We’re also seeing whole-fat options thrive in the dairy milk category as consumer preferences shift in favor of full-fat, whole milk products that appeal due to taste, nutritional content and are viewed as beneficial for both children and adults.”
When it comes to purchasing milk, dairy and non-dairy consumers take different approaches. While nearly all non-dairy milk consumers also purchase dairy milk (90 percent), they tend to consider more factors when purchasing. Non-dairy milk purchasers are more likely to seek out milks that deliver on flavor (48 percent vs 40 percent of dairy consumers), vitamins and minerals (43 percent vs 36 percent of dairy consumers) and that are high in protein (42 percent vs 31 percent of dairy consumers). Non-dairy milk buyers are also more likely to look for ingredients that are natural (46 percent vs 36 percent of dairy consumers) and/or organic (33 percent vs 23 percent of dairy consumers).
It seems consumers do not put dairy and non-dairy milk on the same shelf when it comes to perceptions about health. In fact, the types of milk (including dairy and non-dairy) that Americans perceive to be the healthiest are whole cow’s milk (20 percent), skim/low-fat cow’s milk (18 percent) and almond milk (17 percent). Despite this, however, nearly one in five (19 percent) Americans say they are consuming less dairy for health reasons.
The healthy positioning and messaging leveraged by non-dairy brands has made an impression on consumers who purchase both dairy and non-dairy milk. Dairy milk often delivers on many of the attributes non-dairy milk consumers are looking for, but there is a clear lack of understanding. This indicates that dairy brands must better communicate the natural health benefits of dairy milk through campaigns or packaging claims. By focusing on some of the influential factors that non-dairy milk consumers want when looking for milk, such as flavor and health benefits, dairy milk brands may see more success retaining consumers within the category,” concluded Hambleton.
Top Cheese Trends
Americans’ love affair with specialty cheese isn’t showing any signs of slowing down. Volume sales of specialty cheese have grown five times as fast as the cheese category overall in the past year, according to IRI. Wisconsin is known for its award winning, handcrafted specialty cheeses. Statewide specialty cheese production increased by 7 percent in the past year, according to the USDA.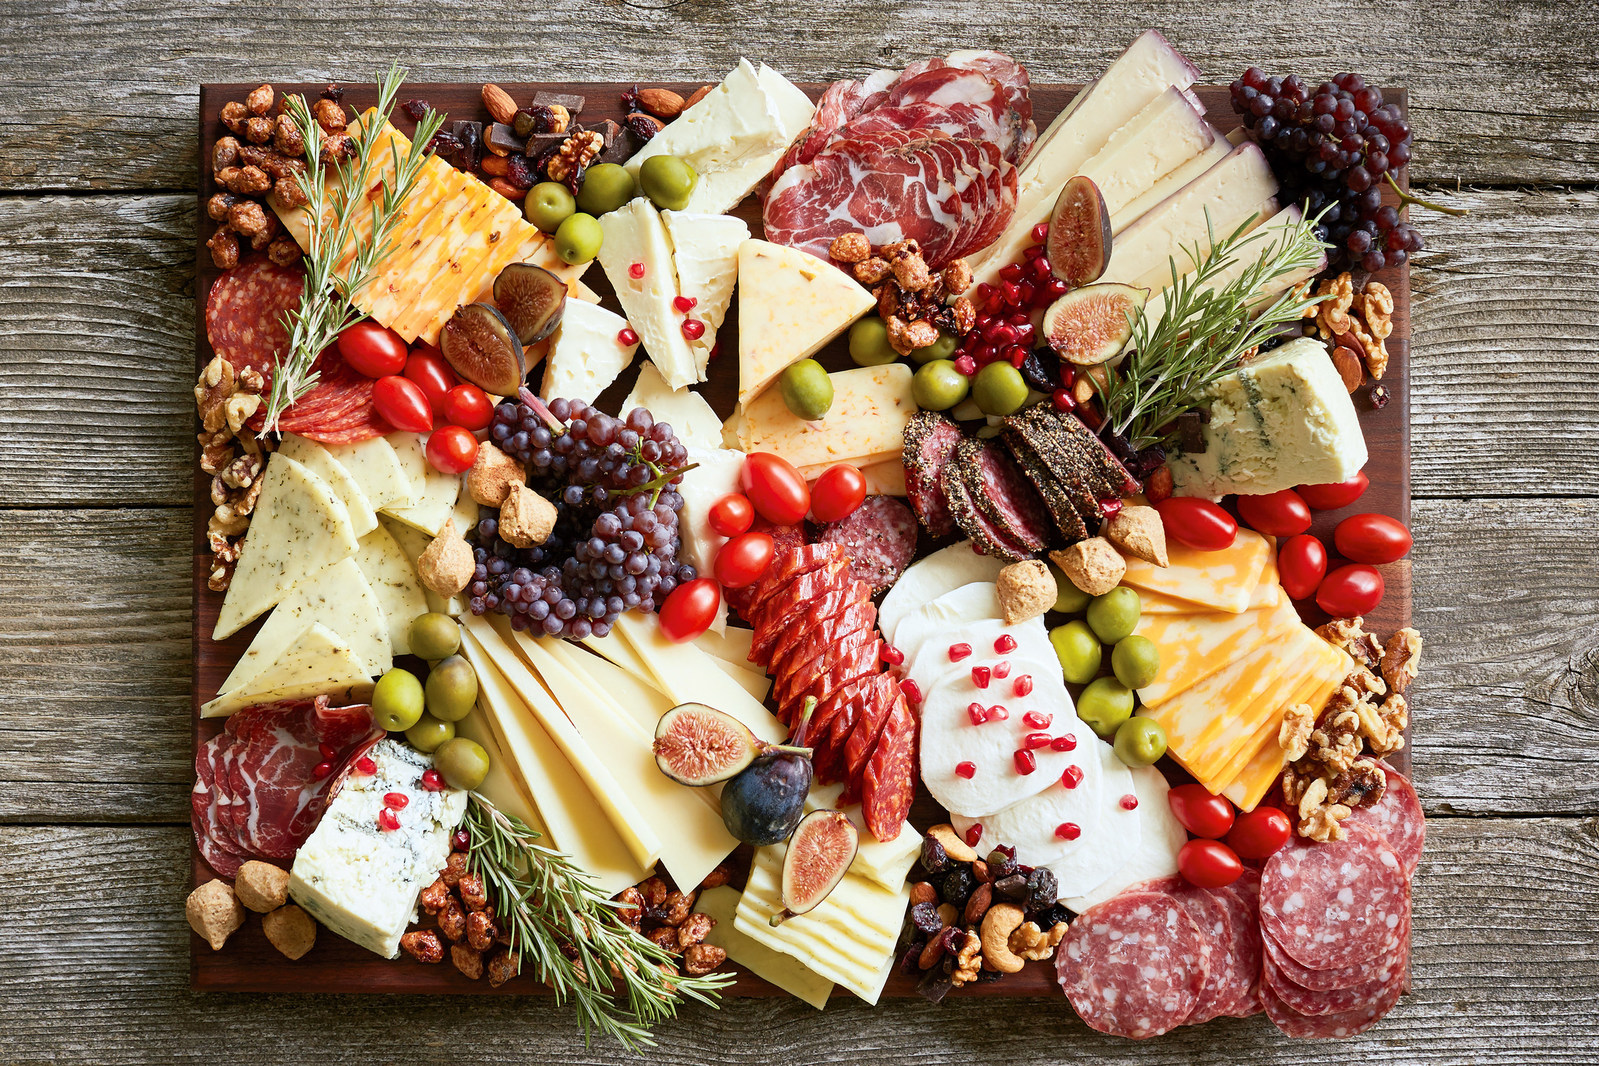
With this increase in mind, the Wisconsin Milk Marketing Board (WMMB) has predicted the top five ways consumers will look to enjoy Wisconsin specialty cheese in 2018:
On a Cheese Board
Sixty-nine percent of millennials report taking a photo or video of their food before eating according to a study by Maru/Matchbox. Creating Instagram-worthy foods like cheese boards made with Wisconsin specialty cheese is a growing trend among millennials. To date there are over 237,000 images of beautifully crafted cheese boards on Instagram, many of which feature award-winning Wisconsin specialty cheeses like Upland’s Pleasant Ridge Reserve, Hook’s 10-Year Aged Cheddar and Roelli™ Cheese Haus’ Dunbarton Blue® to name a few.
With Bold Flavor
Wisconsin cheesemakers are embracing bigger, bolder flavors by developing unique flavored cheeses and specialty products. Smoked cheeses like Red Apple Cheese’s Smoked Swiss, herb and vegetable flavored cheese like Henning’s Wisconsin Cheese’s Onion and Chive Cheddar, and cheeses with spicy flavorings like Nasonville Dairy’s Carolina Reaper Cheddar are all fast-growing segments of the cheese category as consumers increasingly reach for more flavorful cheeses. Retail volume sales of flavored cheese are also outpacing growth in the total cheese category with flavored cheese increasing by 1.5 percent compared to the total cheese category.
Blended with Other Varieties
Unique cheese varieties and blends of Wisconsin specialty cheeses are popping up on restaurant menus across the country. Wisconsin swiss, burrata and gouda are three of the fastest-growing cheeses currently being blended and used on pizza, while unique blends like Roth® Buttermilk Blue Cheese with Sartori Montamoré®, or Marieke® Smoked Gouda with Clock Shadow Creamery Ricotta are examples of standout combinations.
For a Gourmet Snack
Cheese is the fastest growing savory snack between meals, according to the NPD Group. This fact is driving Wisconsin cheesemakers to think beyond the mozzarella cheese stick and develop sophisticated snacks made withWisconsin specialty cheese. New products like Carr Valley Cheese’sCranberry Chipotle Cheddar Cheese Stix® and BelGioioso’s Provolone Cheese & Genoa Salami Snacking Rolls are two examples of Wisconsincheese companies embracing this trend.
In a Meal Kit
Meal kits are a quick and easy way for consumers to enjoy fresh, local ingredients like Wisconsin specialty cheese every night of the week. According to Neilsen, one in four adults has purchased a meal kit in the last year and 70 percent continue to use them after making their first purchase. Blue Apron, who offers a Wisconsin-Style Potato and Cheddar Soup made with Wisconsin sharp cheddar cheese, is one of the many meal kit companies incorporating specialty cheese into their recipes.
Consumer Eating Habits
Label Insight released the results from a national consumer survey of 1,023 Americans conducted by Wakefield Research on eating habits in 2018. The survey found that most (67 percent) Americans will be prioritizing healthy or socially-conscious food purchases in 2018. Their primary point of emphasis is cutting back on sugars, with nearly half of consumers (47 percent) planning to eat less sugar or buy more ‘no sugar added’ products this year.
The next most prominent purchase factors are: emphasizing natural ingredient purchases, such as those with ‘no artificial colors or flavors’ (37 percent) and shopping for more sustainable products and ingredients (22 percent).
Shaking the sugar habit
Baby Boomers and women are by far the most likely to simmer down the sweetness, with 53 percent of Boomers planning to cut down on sugary foods compared to only 40 percent of Millennials. More than half (52 percent) of women will be looking to reduce their sugar intake, while only 41 percent of men feel the same.
Shopping sustainably
When it comes to shopping with a social consciousness in 2018, men are particularly keen on knowing that the food they chose is sustainable, with 26 percent spotlighting sustainability in their food choices compared to only 19 percent of women. Millennials are also emphasizing sustainability more than older generations, 26 percent compared to 17 percent of Gen Xers.
Diet decisions
For many Americans, maintaining healthy or socially-conscious eating habits will mean choosing a gluten-free, vegan, ketogenic or Paleo diet to serve as a guide, but these methods are not equally appreciated among the generations. In fact, 1 in 5 (20 percent) Millennials report they are likely to follow one of these diets in 2018, while only slightly more than 1 in 10 (11 percent) of Baby Boomers expect to do likewise. While Baby Boomers lead the pack when it comes to cutting out sugar, they may be less eager to follow the stricter rules of these popular diets.
Improve label transparency
To help them better understand what’s in the products they use and consume, Americans want better-defined and more transparent food labels. Indeed, the primary change consumers want to see from food brands and retailers is product labels that provide information they can better understand in 2018 (25 percent). The next most pressing need is greater transparency into ingredients (14 percent) and easier-to-identify ‘clean’ or minimally processed products (14 percent).
“It is no surprise that the majority of consumers are asking brands and retailers to provide more insight and clarity about their products,” said Patrick Moorhead, chief marketing officer at Label Insight. “With so many Americans seeking healthy and socially-conscious food, knowing what is in it and how it is processed is a more important selling point now than ever. The fact is brands and retailers who want to retain or gain market share will need to comply with these consumer demands or risk being left behind.”
What Shoppers Expect
While everyone is eager to get a better line of sight into the food they eat, Millennials and Baby Boomers are in two different aisles when it comes to what they most want from brands and retailers in 2018. Baby Boomers (33 percent) are more than twice as likely as Millennials (15 percent) to prioritize wanting product labels that provided information they can better understand as the top priority, while Millennials (17 percent) are nearly twice as likely as Baby Boomers (9 percent) to point to more organic food and product options as the most important change brands and retailers could make.
This online survey of 1,023 nationally representative U.S. adults, ages 18+, was conducted by Wakefield Research in December 2017.
More shopping options and mobile payments at checkout rank among the top trends for grocery in 2018, according to John Karolefski, veteran supermarket analyst and purveyor of www.GroceryStories.com.
Karolefski also predicts the launch of supermarket-branded meal kits, more wine bars and cafés in stores, and easily-accessed product information for curious shoppers.
“Consumers can expect a focus on convenience as grocers make shopping easier and more enjoyable in 2018,” he said.
Karolefski’s top trends for 2018 are:
More Shopping Options: To serve their customers better, more grocers will offer several different ways to shop. These options should satisfy everyone buying groceries. For example, shoppers at Meijer stores in the Midwest can shop in the store, order online for in-store pickup, order online for curbside pickup, and order online for home delivery.
Mobile Payment at Checkout: The number of supermarkets that enable shoppers to pay for groceries with their smartphone will expand rapidly in 2018. Safeway, Aldi, and some smaller grocers already accept Apple Pay in their stores. Look for many other grocers to follow by offering this payment service, in addition to Android Pay and Samsung Pay. Millennials will drive use of mobile payment at checkout.
More Eating and Drinking in Stores: Look for more grocers to add sampling stations for wine and beer to their stores. Shoppers will appreciate a beverage break from roaming the aisles for groceries. Also, more retailers will add in-store dining for shoppers to have a light lunch. In the Cleveland market, for example, some Giant Eagle stores are equipped with a wine bar and café. Its Market District supermarket in Strongsville, Ohio has a full-size bar next to a large dining area.
More Meal Kits: Companies such as Blue Apron and Plated have popularized mail-order meal kits, which contain pre-measured ingredients, recipes, and cooking instructions. Grocers such as Kroger and Publix Super Markets sell their own meal kits in stores. Expect more food retailers to do the same in 2018 as the $5 billion meal kit business continues to grow.
More Access to Product Information: Shoppers want to know more about the ingredients in the food they buy than what is printed on the package. So, food makers over the last two years have made space on nearly 15,000 packages to place scannable QR codes, which take shoppers to a special website with detailed information. A major education campaign will take place in 2018 to make shoppers aware of the codes and prompt them to scan to learn more about the food they are buying.
Nutritional Trends
Pollock Communications and Today’s Dietitian’s “What’s Trending in Nutrition” national survey once again exposes what RDNs predict consumers are thinking and eating. In a surprising switch, fermented foods – like yogurt, kefir, kombucha, sauerkraut, tempeh, some pickles, kimchi and miso – ousted seeds as the No. 1 superfood for 2018, making it clear that consumers will be “going with their gut” in the coming year by seeking out foods that improve gut health and overall well-being.
“RDNs stay ahead of the trends because they are dedicated to listening and responding to what consumers are looking for when making food choices,” explains Mara Honicker, publisher of Today’s Dietitian. “Our readers stay current on what consumers are thinking as much as they do nutritional science.”
Top 10 Superfoods for 2018
What’s changed for next year is the rise of “fermented foods” to the top spot. Surprising, but true, RDNs predict fermented foods will be highly sought by consumers in 2018. While widely known as the process used for making wine or beer, fermentation is a natural, metabolic process that involves using sugar to create compounds like organic acids, alcohols and gases. Fermented foods may have powerful health benefits from boosting gut health to blunting inflammation. The rest of the rankings included:
|
1. Fermented foods, like yogurt |
6. Ancient grains |
The Future is Here
In 2012, “What’s Trending in Nutrition” predicted that consumers would move toward “natural, less processed foods” (according to 72 percent of respondents). This national sample of RDNs forecasted that consumers were trending toward “simple ingredients” and a greater focus on “plants.” Move forward to today, and their projections have come to fruition as top diets for 2018. Coined, “clean eating” and “plant-based diets,” consumers are demanding foods and products that fit this way of life.
Diets Over Time
After “clean eating” and “plant-based diets,” first-timer, the “ketogenic diet” has made its way to the top as No. 3. This high-fat, generous-protein, barely-any-carb diet designed to produce ketone bodies for energy debuted with a high ranking. Interestingly, in 2013, RDNs felt that the trend in the “low carb diet” had declined. Then a year later, there was a rise in Paleo, Wheat Belly and Gluten-Free. Now, RDNs rank “Wheat Belly” as one of the diets on its way out and ketogenic has overtaken Paleo. Given the popularity of the high-fat ketogenic diet, it makes sense that the “low fat” diet was also ranked as a has-been.
“The movement toward clean eating reflects a change in how consumers view food,” noted Jenna A. Bell, PhD, RD, SVP of Pollock Communications. “Consumers are searching for nutrition information and equating diet with overall well-being.” As an example, Bell points out that the quick rise of fermented foods in the top 10 superfood list shows that consumers have expanded their definition of wellness to include benefits like gut health. “It also suggests that consumers are digging deeper for information about the food they eat and in this instance, finding out why yogurt, kefir or kimchi is so good for them!”
Fake News?
Over the years, the “What’s Trending in Nutrition” survey has captured the RDN perspective on where, how and from whom, consumers are getting their nutrition advice – good and bad. Since 2013, RDNs have acknowledged the power of social media, blogs, websites and celebs on nutrition decisions and the dissemination of misinformation. In 2014, celebrity doctors made their mark in the minds of consumers and RDNs ranked them as a growing provider of nutrition info. In the upcoming year, RDNs take aim and name Facebook as the No. 1 source of nutrition misinformation for consumers, followed by websites and blogs/vlogs.
Through the Years, We All Will Be Together
RDNs continue to recognize that consumers rank taste, cost, convenience and healthfulness as most important in the supermarket. And, the RDN messages remain consistent: MyPlate is the gold standard for helping consumers eat right (79 percent use it to educate) and it’s best to make small changes, focus on the overall eating pattern (not a single food or nutrient) and make gradual shifts over time. The RDNs top recommendations for 2018 are to limit highly processed foods, increase fiber intake, keep a food journal and choose non-caloric beverages such as unsweetened tea or coffee.
“The annual forecast from the ‘What’s Trending in Nutrition’ national survey shows how consumers are driving change and leading the evolution of diet and nutrition trends,” explained Louise Pollock, President and founder of Pollock Communications. “As they do each year, the unique perspective of RDNs provides media, retailers and food manufacturers a view into the minds of consumers that can help inform their business.”
Sodium in Canada
Although they may not realize it, Canadians are eating more sodium (salt) than is considered healthy. This can lead to high blood pressure, which is a risk factor for heart disease, stroke and kidney disease.
In 2012, in an effort to reduce the amount of sodium in the food supply, Health Canada established voluntary sodium reduction targets for 94 processed food categories following extensive consultation with the food industry. The Department encouraged the food industry to achieve these targets by the end of 2016. Today, Health Canada released an evaluation of the food industry’s efforts to meet these sodium reduction targets.
Results show that sodium reductions in most categories of processed foods were modest. Specifically, industry met the targets in 14 percent of food categories. These results are an indication that additional measures are needed to reduce sodium in processed foods. Over the next few months, Health Canada will conduct an in-depth analysis of each category and will meet with industry stakeholders and scientific experts to better understand the challenges encountered in reducing sodium.
As part of the Healthy Eating Strategy, Health Canada is committed to reducing sodium in processed foods. We will be proposing regulations that aim to make it easier and faster for Canadians to make healthy choices when buying food, while developing modern tools for Canadians to build their knowledge about healthy eating.
“There is too much salt in the food we eat, in particular in processed foods,” said The Honourable Ginette Petitpas Taylor Minister of Health. “Reducing sodium in foods is an important step towards improving the health of Canadians.”
Quick Facts
25 percent of Canadians have high blood pressure.
80 percent of Canadians and 93 percent of kids aged 4 to 8 years consume too much sodium.
In Canada, 77 percent of Canadians’ sodium intake is from processed food.
Top contributors to sodium intake in Canada include breads, processed meats, soups, cheese, mixed dishes, and sauces.
Global POS Restaurant Management Systems Market
The global POS restaurant management systems market is likely to grow at a CAGR of over 12 percent during the forecast period 2017-2026, and surpass nearly US$ 30 Bn in revenues by the end of forecast period. According to the report added to the repository of Market Research Reports Search Engine (MRRSE) titled “POS Restaurant Management Systems Market – Global Industry Analysis, Size, Share, Growth, Trends, and Forecast 2017 – 2026” evolutions in end-user demand, combined with incorporation of latest technology are driving the growth of the POS restaurant management system market. Focus on offering ease of use and affordability are among the key trends for the POS restaurant management system vendors.
The report offers a detailed analysis on the POS restaurant management systems market, giving readers key insights on the factors that are impacting this market. The report has segmented the market on the basis of types, end user, application, and component. On the basis of type, the market has been segmented on the basis of mobile POS terminal and fixed POS terminal. By end user, the market has been segmented on the basis of full-service restaurant and quick-service restaurant. The key application segments of the POS restaurant management systems include delivery management, order management, billing, stock & inventory management. The key segments on the basis of components include hardware, software, and support.
By type, mobile POS terminals are likely to remain the most lucrative segment, in terms of value during the assessment period. Mobile POS terminals offer a level of flexibility and portability, which is a key reason for their increasing adoption among end users. Currently, full-service restaurants will continue to be the leading end-users of POS restaurant management systems market, where quick service restaurants are likely to witness a high CAGR during the forecast period.
In addition to these detailed segmentation, the report also analyzes the market in the key regions of North America, Latin America, Japan, Europe, Middle East & Africa (MEA), and Asia Pacific excluding Japan (APEJ). According to the report, Asia Pacific excluding Japan (APEJ) continues to be one of the most lucrative markets for POS restaurant management system globally. The market in APEJ is driven by increasing proliferation of restaurants in China and India, where a booming middle class is driving the sales in the eating and dining out segment.
Some of the leading companies operating in the this market include Revel Systems POS, AccuPOS, Ingenico Group, POSist Technologies Pvt. Ltd., EPOS now, Lavu, Verifone System, TouchBistro, PAX Technology, and Clover.
Automation Saves Time and Money
APG Cash Drawer, a fast-growing global manufacturer of cash management solutions, announced today a study conducted in partnership with IHL Group showing that retailers can recoup an average of 200 to 500 of labor hours per store monthly by replacing manual cash management with automation technology.
The study, “Cash Multipliers: How Reducing Cash Handling Can Enable Retail Sales and Profit Growth,” disproves the notion cash-based transactions are waning. In fact, cash accounted for 41.2 billion transactions in 2017 through 12.1 million cash points such as wallets, cash drawers, ECRs, POS stations and mobile POS lines. These transactions incur costs to retailers from 4 percent to 15 percent, depending on the retail segment, and up to 71 percent of those costs are related to front-of-the-store activities such replenishing change at tills and closing out drawers at the end of a shift. Depending on the vertical and cash handling procedure, with integrated cash management solutions, businesses can save 15-30 minutes per day, per POS on cash counts which can be redeployed to profit generating activities and an improved customer experience.
Retailers have an urgent need to cut their cash-handling costs not only because cash purchases account for almost one third (30 percent) of all transactions but also because they must find ways to compete with market leaders Walmart and Amazon.
The study found retailers don’t know their true costs of managing cash because the process involves multiple components and operating units, making it difficult to keep track of all associated tasks. Costs include tasks at the local store such as drawer starts, rebuilds and closings, transporting cash to banks, and bank fees. Adding to the challenge is that higher-paid senior employees and managers are the ones involved in cash management.
“We’ve known for a while that cash-handling costs are a major challenge for retailers of all shapes and sizes, and this study confirms the costs are indeed substantial. Thankfully, retailers have options for bringing those costs under control, and automated solutions are the answer,” said Mark Olson, President and CEO of APG Cash Drawer.
“Today’s retailers are very focused on improving the customer experience, but their efforts are hampered by time-consuming manual tasks such as topping up cash drawers, delivering change to checkouts and doing back office cash counts. Staff time that should be dedicated to the customer experience is, instead, spent on these tasks. That’s why it’s critical to bring down cash-handling costs,” said Greg Buzek, President at IHL Group.
Retail Transformation
Zebra Technologies Corporation revealed the results of its 2017 Retail Transformation Study, a body of research examining the current and future retail marketplace in North America, Europe, the Middle East and Africa (EMEA). The study, conducted with IHL Group, highlights the transformation of the retail sector as the model evolves to better serve consumers. IHL projects retail industry sales to rise three percent annually through 2021 led by a shift to greater ecommerce/omnichannel sales volume. Zebra’s customers are also investing more in technology and growing faster than the industry average.
![]()
IHL projects the North American and EMEA retail markets to each grow approximately three percent over the next five years to $5.5 trillion and €4.4 trillion in sales respectively. Ecommerce is projected to eclipse $1.5 trillion by 2021.
“In North America alone, retail sales are set to rise to more than $5.5 trillion by 2021, so it’s critical retailers are equipped to meet customer expectations,” said Greg Buzek, Founder and President, IHL. “Group Consumers used to ‘Have to Shop’ and now they must need to ‘Want to Shop’ at stores. Retailers that are focusing on the customer experience, investing in better training of associates and integrating IT systems across channels will be the ones that will continue to succeed.”
2017 saw more retail store openings than closures and store openings are expected to outpace closures through 2021. IHL research estimates that the enterprise retail market (more than 50 stores) had 4,080 net stores opening through October 2017. In fact, 42 percent of retailers had a net increase in stores while only 15 percent had a net decrease.
IHL projects technology spending among retailers to rise approximately three percent over the next three years as retailers continue to evolve their operations to support unified commerce and provide a modern, engaging customer experience for today’s savvy, empowered shoppers.
Mobility is a driver for most surveyed retailers who plan to invest in mobile barcode or thermal printers, handheld barcode scanners and mobile computers within the next three years.
Zebra’s customers are retail leaders and growing faster, prioritizing key technologies and spending more on information technology (IT) than the broader market to make the shopping experience more convenient and drive operational productivity.
Retail leaders are investing two-to-three times more than the average retailer in IT transformation and associate training and tools. They are also more focused on increasing inventory visibility and lowering supply chain costs.
In the Department Store/Specialty Store/Mass Merchant segment, retailers that are growing their business with Zebra are reporting 64 percent higher revenue growth, 135 percent higher store growth, 33 percent more store remodels and 53 percent more enterprise IT spend than the surveyed industry average.
In the Grocery, Convenience Store, Pharmacy and Supercenter retail segments, Zebra customers are increasing their IT spend at a rate 232 percent higher than the surveyed industry average while growing stores at a rate 60 percent higher and remodeling stores at a 22 percent higher rate.
Store and fulfillment operations are transforming dramatically to adapt to evolving retail models. Among surveyed North American retailers expecting growth of more than five percent, 60 percent cited faster sales growth as a key driver for changes in store operations while 52 percent cited the shift in sales to online purchases. Interestingly, 52 percent identified same-day delivery as a key warehouse operations driver as consumer demand is encouraging retailers to improve the in-store returns process and enhance their fulfillment and delivery strategies.
Jeff Schmitz, Senior Vice President and Chief Marketing Officer, Zebra Technologies said, “Zebra’s Retail Transformation study confirms that the key growth drivers in retail are multi-channel retailing, in-store connected technology and connected store associates. It is critical that retailers continue investing in the shopping experience and operational efficiencies. Understanding the retail transformation underway allows retailers to invest in the right technology now to meet the evolving demands and needs of their customers and ultimately earn more of their business.”
Online Fraud and the Holidays
Online fraud attempts and general retail transaction volumes increased substantially during the 2017 holiday season, according to new benchmark data from ACI Worldwide. Fraud attempts in the period from Thanksgiving Day to December 31 increased by 22 percent, while the number of overall transactions increased by 19 percent.
ACI’s benchmark survey data* is based on hundreds of millions of eCommerce retail transactions from global merchants using ACI ReD Shield—the eCommerce fraud prevention component of ACI’s UP portfolio of payment solutions—to detect and prevent CNP fraud during the 2016 and 2017 holiday shopping seasons (beginning Thanksgiving Day and ending on December 31). ACI ReD Shield processed 14 percent of all Thanksgiving Day online spend, 13 percent of all Black Friday online spend and 9 percent of all Cyber Monday online spend.
Principal findings and key fraud activity trends include:
Between Thanksgiving Day and December 31, 2017, the number of eCommerce transactions grew by 19 percent, compared to the same dates in 2016. Fraud attempts increased by 22 percent.
Fraud attempt rates were highest on Thanksgiving Day (1.94 percent, up from 1.26 percent in 2016), Christmas Eve (1.78 percent, up from 1.48 percent) and December 21 – the cutoff date for express shipments – (1.67 percent, up from 1.49 percent).
The trends driving these peak fraudulent days include shipment cut-off, consumer traffic and buy online pick-up in-store transactions.
The average ticket price of attempted fraud transactions over the entire holiday period in 2017 was $227, a one percent increase from 2016 ($239). Reduced shipment prices, low-priced electronics and promotions are driving this trend.
The overall volume of purchases recorded in January-October 2017 increased by 14 percent, compared to the same period in 2016.
“Over the 2017 holiday shopping season, merchants experienced significant growth in their digital channels, coupled with a substantial increase in fraud,” said Erika Dietrich, Director of Risk Management, ACI Worldwide. “The consistent, alarming uptick in fraudulent activity on key dates is a signal that merchants must be proactive in their efforts to identify weak points across the omni-channel payment process—and define the short- and long-term strategies necessary to improve security and enhance customer experience.”
During the 2017 holiday shopping season, the number of fraud attempts based on total population increased compared to the same time in 2016:
In 2017, 1 out of every 85 transactions was a fraudulent attempt
In 2016, 1 out of every 97 transactions was a fraudulent attempt
In 2015, 1 out of every 109 transactions was a fraudulent attempt