
According to a Recent Study/Survey … Mid-December 2016 Edition
24 Min Read By MRM Staff
As part of our mission to be the go-to resource for on-the-go restaurant industry professionals, Modern Restaurant Management (MRM) magazine offers highlights of recent research. This mid-December edition features news of the maturing market for mobility, millennial preferences, data delivers results and lots of 2017 forecasts.
CAKE on Tipping During the Holidays
To tip or not to tip? Those pondering the effects of their small contributions to restaurant wait staff should know that their tips add up. And as we enter the season of giving, the tipping habits of most Americans pay surprise you.
CAKE recently found that while the percentage of tips compared to total restaurant revenue on actual holidays can reach as high as 20 percent — which is three percent higher than normal days throughout the year – people actually tip seven percent less than normal during the holiday season in general. Whether it’s due to stress of the season remains to be proven, but tips throughout the month of December are down while tips on Thanksgiving, Christmas and New Year’s Day are up.
CAKE also crunched the numbers to find specific times that tip amounts were highest:
- No matter what the season, people get more generous as the day goes on: Customers tip, on average, a whopping 21 percent more during dinner than lunch or breakfast. This difference is even higher during holiday season, reaching up to 29 percent.
- Holiday tipping is on the rise: 2016 tipping has slightly increased (by 2 percent) over tipping during holidays in 2015. In fact, we examined 12 timeslots throughout the day and found that 60 percent of them showed an increase in tips over the same holiday timeslots in 2015.
- And so is holiday spending: CAKE’s data shows that people spend about 5 percent more per transactions during the holidays, compared to other months.
- And the later the service, the better the tip: during normal operations, after a low point at 4 – 5 p.m., tip percentages steadily increase every hour throughout the evening. By 10 p.m., tips have increased by 14 percent from the opening dinner hour.
- The correlation between check sizes and tips isn’t what you think: We also looked to see whether there is a correlation between ticket size and tip percentage. Could it be that the more people eat and drink, the more they tip? We did find a correlation between ticket size and tip percentage – but only during evening service hours of 6 – 10 p.m. Apparently, a larger breakfast or lunch ticket doesn’t translate into bigger tips.
- As a side note, take that Friday shift: Fridays are generally the best days for wait staff to earn the most, with tips amounting to about 16 percent of the total revenue.
Mobile Maturity
DMI released its first annual ranking of mobility leaders in the Quick Service Restaurant (QSR) industry. The quality and sophistication level of current mobile offerings in more than 75 QSRs in the United States were assessed and ranked using DMI’s proprietary benchmarking tool, the Mobile Maturity Model, that evaluates each QSR brand’s mobile capabilities in relation to customers’ desired mobile experience. The Mobile Maturity Model: Quick Service Restaurants report and list of top 10 mobility leaders is available at http://pages.dminc.com/qsr-maturity-model.html.
Fast casual comes out on top: Of the QSRs evaluated, fast casual owns the mobile space followed by coffee shops, pizza and finally, traditional fast food restaurants. Of the 20 top-scoring QSRs in the benchmarking study, 70 percent are fast-casual restaurants.
Driving brand loyalty: DMI’s research shows clearly that mobile has achieved critical mass in QSRs, especially among consumers DMI identified as “Mobile Reliants.” This group, that actively engages with mobile to improve their overall dining experience, rather than just one part such as viewing a menu or using a reward card, represents nearly one-third of all QSR diners. QSRs that are investing in this channel are winning more customers by helping to drive increased brand loyalty and dining frequency.
Designing with the customer in mind: DMI’s research and industry insights give QSRs the ability to approach mobile from the customers’ point of view. Thus, creating well-designed mobile experiences that go beyond apps to include an omni-channel approach (e.g., mobile web, distributed ordering, third-party delivery systems, etc.) is vital in today’s marketplace.
Work in progress: DMI’s benchmarking study revealed that although some QSRs are providing better mobile experiences than others, none are fully satisfying their customers’ desires. Continued innovation and attention to improving customer experiences will help secure a brand’s position in a customer’s life.
“Today’s consumers are already experiencing how mobile is revolutionizing retail and other service industries, so quick serves can no longer afford to take a ‘wait and see’ approach. QSRs that are striving to meet the demand for faster, cheaper and more convenient mobile experiences are raising the bar, but more needs to be done,” said Jay Sunny Bajaj, DMI founder and CEO. “That’s why DMI remains focused on helping QSR brands approach mobility from their customers’ perspective to create the best possible mobile experiences to match their needs.”
Restaurant Traffic Slowdown
A confluence of squeezed consumer wallets, the rising cost of dining out, and changing needs and wants has brought the U.S. restaurant industry traffic growth to a halt in the first two quarters of 2016 and into the negative in the third quarter, reports The NPD Group, the leading global information company. Total foodservice visits declined by one percent in the third quarter compared to same quarter last year, and quick service restaurant traffic, which represents 80 percent of total industry visits, dropped for the first time in five years, according to NPD’s ongoing foodservice market research.
“The term growing your business in a ‘one percent world’ has become a popular mantra for the restaurant industry after six consecutive years of annual traffic gains of just one percent,” said Bonnie Riggs, restaurant industry analyst at NPD. “However, over the past six months restaurant industry traffic growth has come to a standstill and quick service restaurants, which have been the traffic growth drivers, are now experiencing a slowdown in visits.”
Riggs, who recently authored a report entitled, Losing Our Appetites for Restaurants, points out that there are multiple reasons why consumers have pulled back on visiting restaurants and chief among them is cost. She states in her report that rising healthcare costs and/or student debt have reduced the amount of disposable income consumers have in their wallets. According to a survey of the longitudinal panelists participating in NPD’s receipt mining service, Checkout Trackingsm, 75 percent of the respondents who have decreased their visits to restaurants say they watch how they spend their money on most or all purchases, and a high percentage of these respondents think that restaurant prices are too high. The fact is the cost of the average restaurant meal has risen 21 percent over the last decade and with lower grocery prices the price gap between eating at home and dining out is widening. Eighty-two percent of all meals are now consumed in-home.
“The marketplace is changing and despite improving economic indicators, the consumer landscape is fundamentally reshaped,” added Riggs. “What hasn’t changed and won’t change is the consumer’s need for foodservice; it saves them time and provides them with an experience. Restaurant operators will need to look for ways to differentiate themselves from the competition. They will need to find the means to stay relevant in consumers’ minds – innovative products, unique promotions, competitive pricing, stating the benefits of eating at restaurants compared to home – while delivering an enjoyable experience.”
Taste is Tops
Millennials are America’s consummate taste-makers, according to a a new nationwide consumer survey from Coast Packing Company and Ipsos Research confirming that taste is indeed tops for those ages 18 to 34.
Conducted in November, the study of 900+ millennials examined factors that appeal most to that demographic when dining out and when eating at home: taste, price, healthfulness and availability/convenience. Coast Packing is the number one supplier of animal fat shortenings in the Western United States.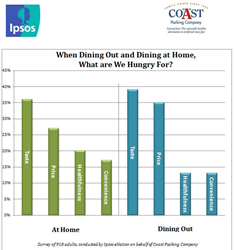
Overall, taste is king both at home and in restaurants, cited as “most important” by 36 percent and 39 percent of respondents, respectively. Price ranks second for those dining out (35 percent) but is a bit less of a factor at home (27 percent). “Healthfulness” is a more significant consideration at home than when heading to a local eatery (20 percent to 13 percent), while convenience/availability is more of an issue at home than when dining out (17 percent to 13 percent)
“Whether you’re at a restaurant or in your own kitchen, the desire for the delicious remains paramount,” said Eric R. Gustafson, CEO of Coast Packing. “Although the ‘healthfulness’ option takes a back seat to taste and price in our survey, millennials are on the record demonstrating their openness to healthy animal fats, which, of course, has everything to do with taste.”
While the message for consumers may be that millennials follow their taste buds, the takeaway for the restaurant industry is that taste just barely edged out price as most decisive. Millennials are more cost-conscious than they are health-focused when they eat out, but health concerns rise in importance when prepping food in their own kitchen.
In a recent Coast/Ipsos survey, 24 percent of millennials said they are receptive to animal fats, a substantial increase over the 15 percent who held that position a year ago. In terms of what members of the youngest demographic are actually eating, it’s a similar story: 20 percent of millennials report having increased their intake of animal fats – a hefty jump over 2015, when that figure stood at 13 percent.
According to U.S. Census Bureau data, millennials are now the nation’s largest generation and include some 75.4 million people. Forty-one percent eat out at least twice a week, compared to 37 percent of Baby Boomers and a like number of Gen Xers, per a study from foodservice research firm Technomic. Millennials spend 15 percent more of their discretionary income on experiences than other demographic groups.
Drilling Down: A Restaurant Row?
When dining out, taste matters more to women than to men (40 to 37 percent). Taste is also relatively more important to those in the Midwest than to those in other regions (43 percent, by a 4-5 point margin), those without kids at home and those with a college degree.
Price likewise matters more to women than men (39 percent to 32). Perhaps not surprisingly, those with incomes of less than $50K put the emphasis on price (40 to 32 percent, for those above that threshold). And those in the Northeast were most price-sensitive (39 percent). Forty-three percent of non-whites say price is a consideration, vs. 34 percent of whites.
Healthfulness is more of a concern for men than for women (16 to 10 percent), and slightly more of a concern for those with incomes above $50K (14 to 11 percent). When dining out, convenience is a bigger deal for men than for women (15 to 10 percent). On a regional basis, health is a substantially bigger issue in the West than anywhere else. Countering expectations, convenience when dining out is slightly less of a concern for those with kids at home than those without.
At Home on the Range
When working in the kitchen, men and women are about equal in their preference for taste above all; those in the Midwest and South place relatively more emphasis on taste (39 and 38 percent, respectively – and least in the West, at 31 percent). Taste in home cooking is relatively less important to those without a college degree (34 to 38 percent), and more important to those unemployed (39 percent) than to those employed full or part-timers.
For those dining in, price is slightly more important to women and to families with children (by identical 29 percent to 26 percent margins) and most important to those in the South and West. Price matters substantially more to those without a college degree (31 to 23 percent). Those in the West are relatively more concerned about healthfulness around the dinner table (at 24 percent, by a 5 to 6 percent margin over other regions). Health likewise ranked higher for those with a college degree (23 percent to 17 percent for those without); those unemployed were relatively less concerned (15 percent) about healthfulness.
Data is Insightful
A new research report released by the Winterberry Group proves that guest data is playing a critical role in the way the restaurant industry is responding to challenges like increased competition, declining guest loyalty, and measuring marketing effectiveness. More than 200 restaurant and hospitality brands participated in the research initiative co-sponsored by Fishbowl and The Coca-Cola Company.
“Actionable data insights continue to emerge as the real trade secret to success in almost every service-oriented market, and the restaurant industry is no exception,” said Dev Ganesan, Chief Executive Officer of Fishbowl. Fishbowl, the leading customer engagement platform provider, provides deep guest insights that enable restaurants to execute data-driven decisions and personalized marketing. “Being able to make informed, data-driven decisions and engage guests with a high degree of certainty and minimal amount of risk is an absolute must for our clients. This report underscores that requirement by demonstrating the results a data-driven approach delivers to brands that have made it an integral part of their businesses.”
Among the key findings in the report is that an overwhelming 87.3 percent of marketers surveyed agreed with the notion that restaurant businesses stand to gain competitive advantages by initiating and maintaining strategies to support the collection and analysis of guest data.
The report also revealed that progressive marketers are collecting a broader array of data points that go beyond simple demographics and email addresses. Preferences, attitudes, lifestyles, buying patterns, and other guest behavior insights are informing the development of innovative engagement strategies and programs. Data on responsiveness to offers, redemption information, and mobile engagement are also increasingly relied upon to provide actual, real-time intelligence on the success of campaigns – and can offer even more value when aggregated by geographic market, date range, and individual store performance.
As one survey participant said, “Going into 2017, we are focused on being able to use customers’ preferences in order to deliver relevant content. We are aiming to understand our customers better to be able to deliver them something that will drive them to our website, and drive them to make a reservation. It can’t just be offers all the time anymore.”
Other marketing trends such as shifts in media budgets and allocations, mobile and app development, social media participation, and performance metrics are unveiled in the report, with notable changes to digital media approach being reported by more than half of respondents.
Jonathan Margulies, Managing Director of Winterberry Group, noted, “Data insights enable companies to be more nimble and adept in responding to challenges and changing trends and empower them to rise above competition. Understanding and embracing the shifts currently underway in the restaurant industry from the marketers’ perspective can have monumental impacts on the future of any brand.”
Food’s Positive Effect at Work
Food can have a positive impact on many aspects of business, according to a recent survey of 1,025 office workers in the United States conducted by ezCater. According to the research, a majority of workers agree that food makes it easier to close deals, keep customers and prospects happy, improve meeting attendance, save time, and attract talent. Additionally, nearly one-third of all office workers reported that their employer orders food for employees at least monthly, but nearly half said that vendors or partners never bring food to their office.
Key findings uncovered in the research include:
- Workers overwhelmingly recognize that food contributes to positive experiences with customers and prospects.
- 90 percent agree that food keeps customers and prospects happy; 80 percent agree that food makes it easier to secure a meeting; and nearly two-thirds (61 percent) agree that bringing food to a meeting makes it easier to close a deal.
- 90 percent agree that food keeps customers and prospects happy; 80 percent agree that food makes it easier to secure a meeting; and nearly two-thirds (61 percent) agree that bringing food to a meeting makes it easier to close a deal.
- Workers see a clear impact that food has on office productivity.
- 76 percent of office workers said meetings are better attended when food is provided, and 66 percent said it saves time in their workday.
- 76 percent of office workers said meetings are better attended when food is provided, and 66 percent said it saves time in their workday.
- Food can be a deciding factor in attracting talent.
- 67 percent of workers said they would choose a job at a company that provides free meals for employees over a job at a similar company that does not.
- 67 percent of workers said they would choose a job at a company that provides free meals for employees over a job at a similar company that does not.
In fact, workers at companies that provide food to their employees more often see the benefits of food in the workplace more clearly. For example, when asked to identify the benefits of employer-provided food, 66 percent of all those surveyed said it saves them time, but that belief grew to 79 percent among those who are provided food at least once per week. Likewise, workers who said it keeps their energy up grew from 38 percent of all respondents to 42 percent for those who receive food at least once per week, and from 25 percent to 33 percent for those who said food helps diffuse stress.
Despite the positive impact that workers say food has on sales, productivity, and culture, nearly half (42 percent) of office workers said that other companies – such as vendors or partners – never bring food to their office. In addition, a quarter (25 percent) said their employer never orders food, or only does so once per year.
“Food has always been an important part of business, but it has evolved beyond taking a decision maker out for a meal,” said Stefania Mallett, Co-founder and CEO of ezCater. “This research shows the positive impact catered food can provide to businesses, for closing sales, attracting top talent, and more. ezCater makes it easy for any business to order catering, and get all those benefits of catered food.”
Top Food Trends
Each year, the National Restaurant Association surveys nearly 1,300 professional chefs – members of the American Culinary Federation (ACF) – to explore food and beverage trends at restaurants in the coming year. The annual “What’s Hot” list gives a peak into which food, beverages and culinary themes will be the new items on restaurant menus that everyone is talking about in 2017.
According to the survey, menu trends that will be heating up in 2017 include poke, house-made charcuterie, street food, food halls and ramen. Trends that are cooling down include quinoa, black rice, and vegetarian and vegan cuisines.
Top Food Trends
- New cuts of meat (e.g. shoulder tender, oyster steak, Vegas Strip Steak, Merlot cut)
- Street food-inspired dishes (e.g. tempura, kabobs, dumplings, pupusas)
- Healthful kids’ meals
- House-made charcuterie
- Sustainable seafood
- Ethnic-inspired breakfast items (e.g., chorizo scrambled eggs, coconut milk pancakes)
- House-made condiments
- Authentic ethnic cuisine
- Heirloom fruit and vegetables
- African flavors
- Ethnic spices (e.g. harissa, curry, peri peri, ras el hanout, shichimi)
- House-made sausage
- House-made pickles
- Ancient grains (e.g. kamut, spelt, amaranth, lupin)
- House-made/artisan ice cream
- Whole grain items in kids’ meals
- Protein-rich grains/seeds (e.g., hemp, chia, quinoa, flax)
- Artisan cheeses
- Savory desserts
- Gourmet items in kids’ meals
Top Concept Trends
- Hyper-local sourcing (e.g. restaurant gardens, onsite beer brewing, house-made items)
- Chef-driven fast-casual concepts
- Natural ingredients/clean menus
- Environmental sustainability
- Locally sourced produce
- Locally sourced meat and seafood
- Food waste reduction
- Meal kits (e.g. pre-measured/prepped raw ingredients for home preparation)
- Simplicity/back to basics
- Nutrition
“Menu trends today are beginning to shift from ingredient-based items to concept-based ideas, mirroring how consumers tend to adapt their activities to their overall lifestyle philosophies, such as environmental sustainability and nutrition,” said Hudson Riehle, Senior Vice President of Research for the National Restaurant Association. “Also among the top trends for 2017, we’re seeing several examples of house-made food items and various global flavors, indicating that chefs and restaurateurs are further experimenting with from-scratch preparation and a broad base of flavors.”
“Chefs are on an endless quest to redefine how consumers eat,” commented ACF National President Thomas Macrina, CEC, CCA, AAC. “By masterfully transforming the ordinary into the extraordinary, culinary professionals are at the forefront of changing the culinary landscape.”
The National Restaurant Association surveyed 1,298 American Culinary Federation members in October 2016, asking them to rate 169 items as a “hot trend,” “yesterday’s news,” or “perennial favorite” on menus in 2017.
Consumer Choice Awards
As part of our comprehensive Consumer Brand Metrics program, Technomic asks consumers to rate more than 120 leading U.S. restaurant chains on 60+ different attributes. The attributes capture the consumer experience from every angle, from the quality of the food to the overall brand reputation. The ongoing study records almost 100,000 consumer visits annually.
Based on analysis of consumer ratings in four key areas, Technomic has determined the winners of the 2017 Chain Restaurant Consumers’ Choice Awards:
|
Pillar of Excellence |
Quick Service |
Fast Casual |
Full Service |
|
Food Taste and Flavor |
In-N-Out Burger |
Schlotzsky’s |
Texas Roadhouse |
|
Intent to Return |
Papa Murphy’s Pizza |
Raising Cane’s Chicken |
Cheddar’s Scratch Kitchen |
|
Use of Technology Improves the Experience |
Papa John’s |
Pollo Campero |
The Capital Grille |
|
Overall Takeout Capabilities |
Hungry Howie’s |
Jimmy John’s Gourmet Sandwiches |
Brio Tuscan Grille |
Alcohol Outlook for 2017
The outlook for drink sales in restaurants and bars calls for more intense competition among on-premise venues and alcohol brands in 2017. According to the new On-Premise Intelligence Report jointly developed by Technomic and Beverage Marketing Corporation, consumer occasions involving a call for alcohol are not growing, resulting in flat total adult beverage volume growth. However, dollar sales continue to increase as consumers gravitate toward more premium spirits, wine and beer products.
“Consumers are favoring more expensive selections such as craft and imported beer and higher-end whiskeys when ordering drinks, and do indicate they’re spending more now on drinks in restaurants and bars,” says Donna Hood Crecca, Associate Principal at Technomic, Inc. “Drink price increases also play a role – nearly half of on-premise operators report raising adult beverage menu prices in 2016, and many expect to do so in 2017.”
The report reveals that spirits is the only adult beverage category achieving volume gains in restaurants and bars. “Spirits continues on its growth trajectory,” observes Eric Schmidt, Director, Alcohol Research at Beverage Marketing Corporation. “Whiskey is a growth driver in on-premise, primarily due to momentum in American and Irish whiskeys. Vodka remains the largest-volume category and is now returning to growth, but aged spirits are really trending in restaurants, bars and other on-premise locations. We’re also tracking notable growth in aged tequilas and Cognac.”
In fact, Schmidt says, the five fastest-growing alcohol brands in restaurants and bars are all spirits labels, and three are whiskeys:
|
Fastest-growing On-Premise Adult Beverage Brands |
||
|
Brand |
Category |
Volume Change 2016* |
|
Tito’s Handmade |
Vodka |
35.5 percent |
|
Don Julio |
Tequila |
17.2 percent |
|
The Balvenie |
Scotch whisky |
16.7 percent |
|
Tullamore Dew |
Irish whiskey |
14.3 percent |
|
Jameson |
Irish whiskey |
12.2 percent |
|
*Projection |
||
Beer remains the most-consumed type of alcohol in restaurants and bars, however, and wine ranks second. Both are growing in dollar sales, according to the report.
Food Sustainability Leaders
France, followed by Japan and Canada are the top three countries in a new index measuring food and nutrition sustainability across 25 countries, representing two thirds of the world’s population and 87 percent of global GDP. These three nations achieved the best scores for the production, distribution and consumption of food. Their agriculture is the most sustainable, food waste is lowest (including thanks to innovative policies to combat food) and where diets are the most balanced, without excesses or deficiencies, mindful of people’s health and the planet’s wellbeing. France takes first place above in part due to its innovative policies to fight food waste and the balanced diets of its population. Japan and Canada come second and third by virtue of their policies regarding sustainable agriculture and the widespread adoption of healthy balanced diets.
In the global ranking of the most virtuous countries, the USA is in 11th place. It owes its position to the efforts made on a national and local level to tackle American’s unhealthy eating habits and its good performance in terms of nutritional sustainability. Nevertheless, the country has extremely high levels of food waste, both throughout the production chain and during domestic consumption. Countries that score lowest are India, Saudi Arabia and Egypt, and India and Egypt face a double challenge of obesity and malnutrition. Their use of resources (especially water) is also considered unsustainable, and they are losing food at the pre-consumer level. India is in last place in part because of its unsustainable management of water resources and the inadequacies in Indian people’s diets: it has the highest percentage of malnutrition among children aged under 5 years. Saudi Arabia and Egypt are 24th and 23rd in the ranking respectively, largely due to their excessive food waste and high levels of obesity.
The Food Sustainability Index (FSI) was, commissioned by the Barilla Center for Food and Nutrition (BCFN) Foundation and carried out by The Economist Intelligence Unit (EIU) – the research arm of The Economist Group. It is the only index of its kind and revolutionises the way we look at food. For the first time, it provides an analysis of the world’s food choices not simply based on “taste”, but also on the overall sustainability of the food system. This in-depth analysis culminated in a ranking of countries around the world which the food system is most sustainable based on 58 criteria across three pillars: sustainable agriculture, nutritional challenges and food waste. The objectives of the FSI are to highlight the performance of various countries, establish comparable measurement criteria, provide examples of best practice and measure progress over time.
“The slogan chosen for this BCFN Forum is ‘Eat Better. Eat Less. Food for All’ because it epitomises our view extremely concisely: if we eat better, not only will our health benefit as a result, but so will the wellbeing of the planet,” explains Guido Barilla, BCFN President. “The Food Sustainability Index will help us to understand where people eat the best around the world, not in terms of how good something tastes, but in terms of the sustainability of the food system, helping researchers and decision makers to understand where to focus research and policy choices. In my view, Italian food is the best in the world in terms of taste, but in terms of the food system, even though we are quite high up, we still need to do better,” concludes Barilla.
As for food waste, San Francisco was identified as America’s best performing city because, in recent years, it has stood out for having launched an excellent system for sorting waste and recycling, food education and the distribution of food banks. However, despite this city’s success, it should also be highlighted that the USA throws away around 46 million tonnes of food every year, with an average of around 40 percent being domestic waste, placing the country amongst the stragglers when it comes to food waste.
Food Safety on Television
Home cooking can kill, often because not enough is known about foodborne illnesses that may result from consumer practices. Television cooking shows –long an important resources for home cooks—rarely if ever model recommended food safety steps and consequently may lead to consumers making more dangerous food safety mistakes.
With that in mind, researchers at the University of Massachusetts Amherst devised a study to assess food safety on television food shows and determine whether they present positive or negative models for viewers.
Adherence to food safety practices by consumers has declined in recent years. For example, fewer consumers reported washing hands before handling food, cooking to required temperatures, or separating meat and poultry from ready-to-eat foods in 2011 than in 2008 or 2010. Only 33 percent of consumers said they trusted the government for food safety information, whereas more than half trusted media.
An overwhelming majority (73 percent) obtained food safety information from media, and 22 percent of those used cooking shows as their primary source of information. Likewise, in a poll of television viewers, 50 percent of respondents watched some television cooking shows, and 57 percent reported purchasing items based on those shows.
To study food safety on television cooking shows, researchers developed a 19-question survey. The survey was adapted from the Massachusetts Food Establishment Inspection Report and measured hygienic food practices, use of utensils and gloves, protection from contamination, and time and temperature control. In addition, whether food safety practices were mentioned was recorded.
A panel of state regulators and food safety practitioners participated in the assessment, viewing 10 popular cooking shows, with two to six episodes per show watched for a total of 39 episodes.
“The majority of practices rated were out of compliance or conformance with recommendations in at least 70 percent of episodes and food safety practices were mentioned in only three episodes,” said lead author Nancy L. Cohen, PhD. “Only four practices were observed to be in compliance or conformance with recommendations in more than 50 percent of the episodes. For most behaviors observed, the percentage of shows in conformance with recommended practices was much lower than that seen in restaurant employees and consumers in general.”
Although the assessment showed many issues regarding food safety on television cooking shows, room for improvement was easily identified by the researchers. For instance, steps toward improvement could include requiring food safety training for chefs and contestants, modifying the structural environment to support safe food handling, incorporating food safety as a judging criterion in competitions, and incorporating food safety in scripts.
“There are many opportunities on cooking shows to educate the public regarding safe food handling practices and help reduce the incidence of foodborne illness,” Cohen said. “Similarly, nutrition and food safety educators could work with the media to produce shows that demonstrate positive food safety behaviors and educate consumers about food safety practices as they adopt recipes.”
Forty-eight million cases of foodborne illness are reported annually in the United States, including 3,000 deaths, according to the Centers for Disease Control and Prevention.
The Flavor Forecast
The McCormick® Flavor Forecast® 2017 – the go-to guide for trends and ingredients set to excite taste buds around the world – was released by McCormick & Company, Incorporated, a global leader in flavor.
For nearly two decades, this much-anticipated annual report from McCormick has predicted emerging flavors – like chipotle chilies, coconut water and peri-peri sauce – that are now found everywhere from restaurants to retail shelves and kitchen cabinets.
“This year, the Flavor Forecast identifies cutting-edge flavors that help chefs, tastemakers and home cooks refresh their menus,” said McCormick Executive Chef Kevan Vetter. “Discover a new all-purpose seasoning – Baharat. It’s a fragrant, Eastern Mediterranean blend of spices such as cumin, cardamom, black pepper, nutmeg and more. Sprinkle over warm, seasonal soups, stir into tomato-based sauces, or add to your favorite chicken dish.”
Here are the five flavor trends the chefs, culinary professionals, trend trackers and flavor experts at McCormick have identified for 2017:
Rise & Shine to Global Tastes – Breakfast options with big, global flavors are being sought after by a generation of flavor adventurists not content with the same boring bowl. Try warm, sweet congee or a Middle Eastern-inspired breakfast hash topped with a spicy skhug sauce.
Taste It: Breakfast Hash with Skhug Sauce – Tender chickpeas, ground lamb or beef and roasted vegetables seasoned with a blend of coriander, cumin and fennel.
Say It: Skhug [shug], this complex Middle Eastern hot sauce is made with Thai bird eye chilies, cumin, cardamom, coriander, garlic, parsley, cilantro, olive oil and lemon juice.
Plancha: Flat-Out Grilling – Hailing from Spain, France’s Basque region as well as Mexico, the plancha (a thick, flat slab of cast iron) is growing in popularity around the world for creating a sizzling, smoky sear and flavor crust. Grillers can easily use the plancha with meats, seafood and vegetables, paired with bold sauces, rubs and glazes.
Taste It: Espelette Pepper-Rubbed Steak a la Plancha – a zesty, Mediterranean-herb rub enhances juicy steak grilled on a sizzling hot plancha.
Say It: Espelette [es-PE-let] pepper, originating from the Basque region of France, delivers a distinctively smoky, sweet and mildly hot flavor.
Egg Yolks: The Sunny Side of Flavor – Egg yolks leave breakfast behind! Whether poached, fried or cured, chefs are pairing these indulgent golden gems with a range of spices, herbs and sauces on lunch and dinner menus.
Taste It: Mediterranean Vegetable Shakshuka – Sunny-side-up egg yolks simmered in a tomato and vegetable sauce make a rustic supper.
Say It: Shakshuka [shahk-SHOO-kah], flavored with a savory spice blend of smoked paprika, cumin, pepper, cayenne, turmeric and caraway.
Modern Med – Discover the new cuisine for the 21st century – melding Eastern Mediterranean ingredients with Western European classics.
Taste It: Persian Minestrone – Persian Ash-e reshteh meets Italian minestrone.
Say It: Ash-e Reshteh [OSH-e-resh-tay], a thick, hearty soup made with beans, herbs, turmeric and flat noodles.
Sweet on Pepper – Enter the new sweet heat. With an up-front bite and lingering sensation, peppercorns are finally capturing the spotlight. Their cedar and citrus notes pair perfectly with up-and-coming naturally sweet ingredients like dates and dragon fruit.
Taste It: Dragon Fruit & Strawberry “Poke” with Pepper Syrup – Fresh strawberry and diced dragon fruit salad atop a dollop of peppered whipped cream and crispy wontons.
Say It: Poke [po-kay], create this unique take on Hawaiian poke salad with a drizzle of balsamic-pepper syrup.
Canadian Food Prices Going Higher
Canadians will pay more to put food on their tables in 2017, according to “Canada’s Food Price Report 2017.” The report forecasts a rise in food prices between 3 percent and 5 percent higher than last year’s increase and considerably higher than the general inflation rate. For the average Canadian family, food expenses in 2017 could increase by as much as $420. The 7th edition was released today and is published for the first time by Dalhousie University.
“Food prices are top of mind for everyone. Every single day we have to feed ourselves and we’re victims of fluctuating food prices,” said Sylvain Charlebois, lead author of the report and Dean of the Faculty of Management at Dalhousie University. “Canadians are very engaged consumers when it comes to food. We hope the “Canada Food Price Report, continues to provide them with the information they want, not just about food prices, but about issues around food safety, quality of food, trends and the region in which they live.”
Charlebois points to a number of factors contributing to the price increase. “The biggest factor will be the falling Canadian dollar. Given how many food products we import from abroad our food economy is vulnerable to currency fluctuations. We’re also expecting the upcoming Trump administration to have an impact on Canada’s food prices.”
Charlebois says the new administration could create a period of U.S. protectionism aimed at improving domestic issues at the expense of the international community, impacting agri-food and seafood exports. The administration’s support of infrastructure and the development of the States next farm bill, may result in subsidies to farmers and increased expenses, which could trigger a super cycle in grain prices and further push food prices higher.
Vegetables, fruits and nuts, are all expected to experience a sharp price rise in 2017, due to the need for imports. Vegetables are expected to increase by 4 percent to 6 percent and fruit and nuts by three percent to five percent. Pork, fish and seafood are all expected to see increases in 2017.
Restaurant Industry Snapshot
At -1.3 percent, disappointing restaurant sales growth in November was the ninth consecutive month of negative same-store sales; and the worst sales growth since July. Despite the economy growing at the fastest pace in two years during the second quarter, this growth did not translate into incremental sales for the industry. Same-store sales for third and fourth quarters, at the end of November, are both -1.1 percent. This insight comes from data reported by TDn2K™ through The Restaurant Industry Snapshot™, based on weekly sales from nearly 26,000 restaurant units and 130+ brands, representing $65 billion dollars in annual revenue.
Traffic continues to be the main factor as sales trend downward. As of November, same-store traffic growth for 2016 has declined -3.0 percent. In contrast, traffic in 2015 was down -0.8 percent. The -3.3 percent drop in November was only a marginal improvement from the -3.4 percent decline reported for October.
Even though traffic performance was very close to prior month, sales growth deteriorated due to a drop in average guest checks. Same-store average guest check growth was 2.1 percent during November. It had been over 2.5 percent for all months since June.
“The economy expanded solidly over the summer and it looks like it picked up some steam in the fall. Given the lack of qualified workers, job gains were as good as could be expected and the unemployment rate dropped to its lowest level since August 2007,” commented Joel Naroff, President of Naroff Economic Advisors and TDn2K economist. “Consumer income growth improved as a result. Household spending on retail products, including restaurants, is not keeping pace. Families are buying vehicles and homes and debt payments are limiting spending on other products. Trump’s tax and spending proposals should add to growth, but not until the second half of next year. The outlook is for income gains to improve and spending to rise, but the changing spending patterns should continue until the rising interest rates slow big-ticket consumer purchases. That may not happen until well into 2017.”
“As weak as November’s results were, the month was affected favorably by the shift in Halloween,” expressed Victor Fernandez, Executive Director of Insights and Knowledge for TDn2K. “According to our reporting calendar, this holiday fell on a Monday during the first week of November in 2016, while it was on a Saturday in 2015. When calculating the sales growth, sales lost on a Saturday night would greatly outweigh those of a Monday night. The impact of this shift would be amplified in those segments that rely heavily on the dinner daypart, such as upscale casual and fine dining”
Segment Performance
Reporting comparable store sales performance close to 2.0 percent, quick service was again the best performing segment. QSR has been the top performer during every month since February. The only other two segments with positive sales in November were family dining and fine dining.
“Even if some segments are doing better than others, sales growth is slowing down across the board,” said Fernandez. “At the end of November, same-store sales quarter-to-date are lower than fourth quarter 2015 in all segments, with the exception of family dining. Even that segment is 2.3 percentage points lower than it was two years ago.”
Check Average
One of the main challenges restaurants have faced this year has been menu prices increasing at a much faster rate than the prices for food at grocery stores. This has created additional competitive pressures for restaurants, as preparing food at home became much more attractive from a cost perspective.
According to a recent survey conducted by Black Box Intelligence, menu prices increased by an average 1.9 percent for counter service brands and 1.8 percent for table service brands during 2016. The expected increase for 2017 is lower, with price increases estimated to be around 1.7 percent for both.
In contrast, government numbers show food at home prices dropping by an average 1.2 percent year-over-year during the first ten months of 2016.
Furthermore, the study revealed that for 57 percent of the companies included in the sample, total average guest check increases outpaced their increases in menu prices by an average 1.4 percent. This indicates that most of the brands represented are experiencing incremental spending from consumers beyond what can be directly attributed to changes in their prices.
The Restaurant Industry Workforce
According to Fernandez, “Throughout 2016, we have seen restaurant job growth slow down along with restaurant sales. After creating jobs at an average rate of 3.7 percent during the first seven months of the year, restaurant job growth slowed down, finally reaching 0.0 percent during October. We might start seeing the industry’s workforce shrinking year-over-year in the near future as brands seek to boost productivity by labor force reduction in response to decreasing sales and rising labor costs.”
Meanwhile, according to People Report, turnover rates for both restaurant managers and hourly employees continued to increase.
The Western* and Mountain Plains regions experienced the biggest increase in hourly turnover for counter service companies during the third quarter. For table service companies, New England suffered the biggest increase in hourly turnover, increasing by 16 percent compared to the previous quarter.
Competition Increase Expected
U.S. retailers and restaurants will continue to face a competitive environment in 2017 as they navigate changing customer preferences, according to Fitch Ratings’ Outlook report. The industry’s rating and sector outlooks are both stable, unchanged from 2016.
Restaurant companies will also see market share shifts in 2017. Fitch expects food away from home sales to increase four percent in 2017, slightly lower than the five percent projected for 2016. Breakfast, value and convenience will draw customers over the next year.
“Even as the job market improves, consumers are looking for relatively low price points and the convenience to order online when they eat away from home,” says Carla Norfleet Taylor, Director, U.S. Corporates. “With persistent food price deflation, deal promotions will likely be a tactic restaurants use to get people in the door.”
Fitch believes Starbucks and Darden Restaurants will benefit from these trends given the former’s strong position in the coffee market and improvement at Olive Garden, which continues to gain traction with ToGo orders and its value perception, for the latter. Olive Garden is expected to continue to gain share in the casual dining sector which continues to lose share in the industry.
By contrast, Fitch believes McDonald’s Corp. will continue to lose market share in the U.S. due to heightened competition due to the rise of specialty burger competitors and increasing breakfast competition, while Brinker International grapples with high exposure to oil producing state where economies have been challenged.