
According to a Recent Study/Survey … Mid-April 2018 Edition
29 Min Read By MRM Staff
This edition of Modern Restaurant Management (MRM) magazine’s “According to …” research roundup features exclusive research on a Moe’s Southwest Grill LTO from the experts at Sense360, Tillster‘s Delivery Index, top chains, taxes effect on eating habits, part-time lovers and the fastest growing breweries.
Moe’s New Queso
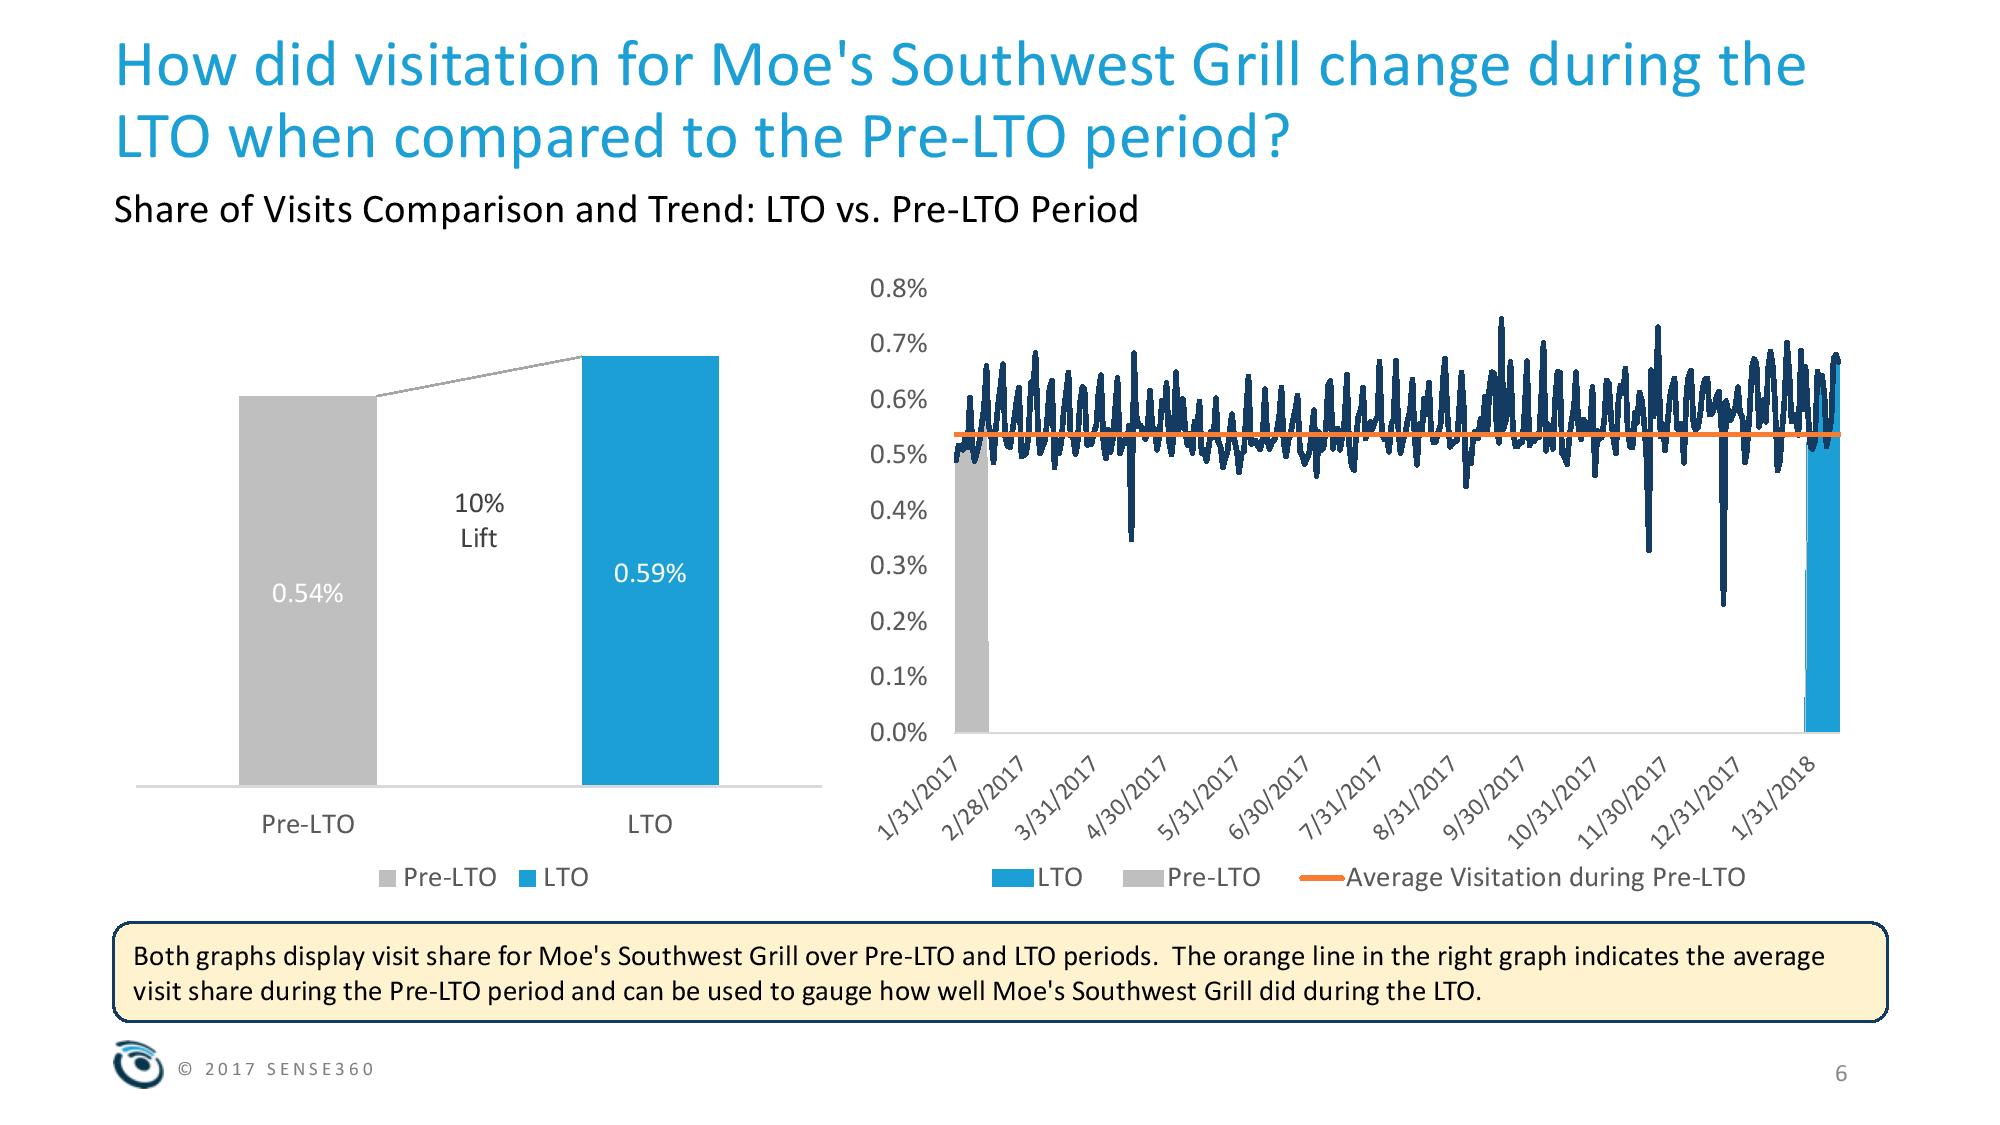
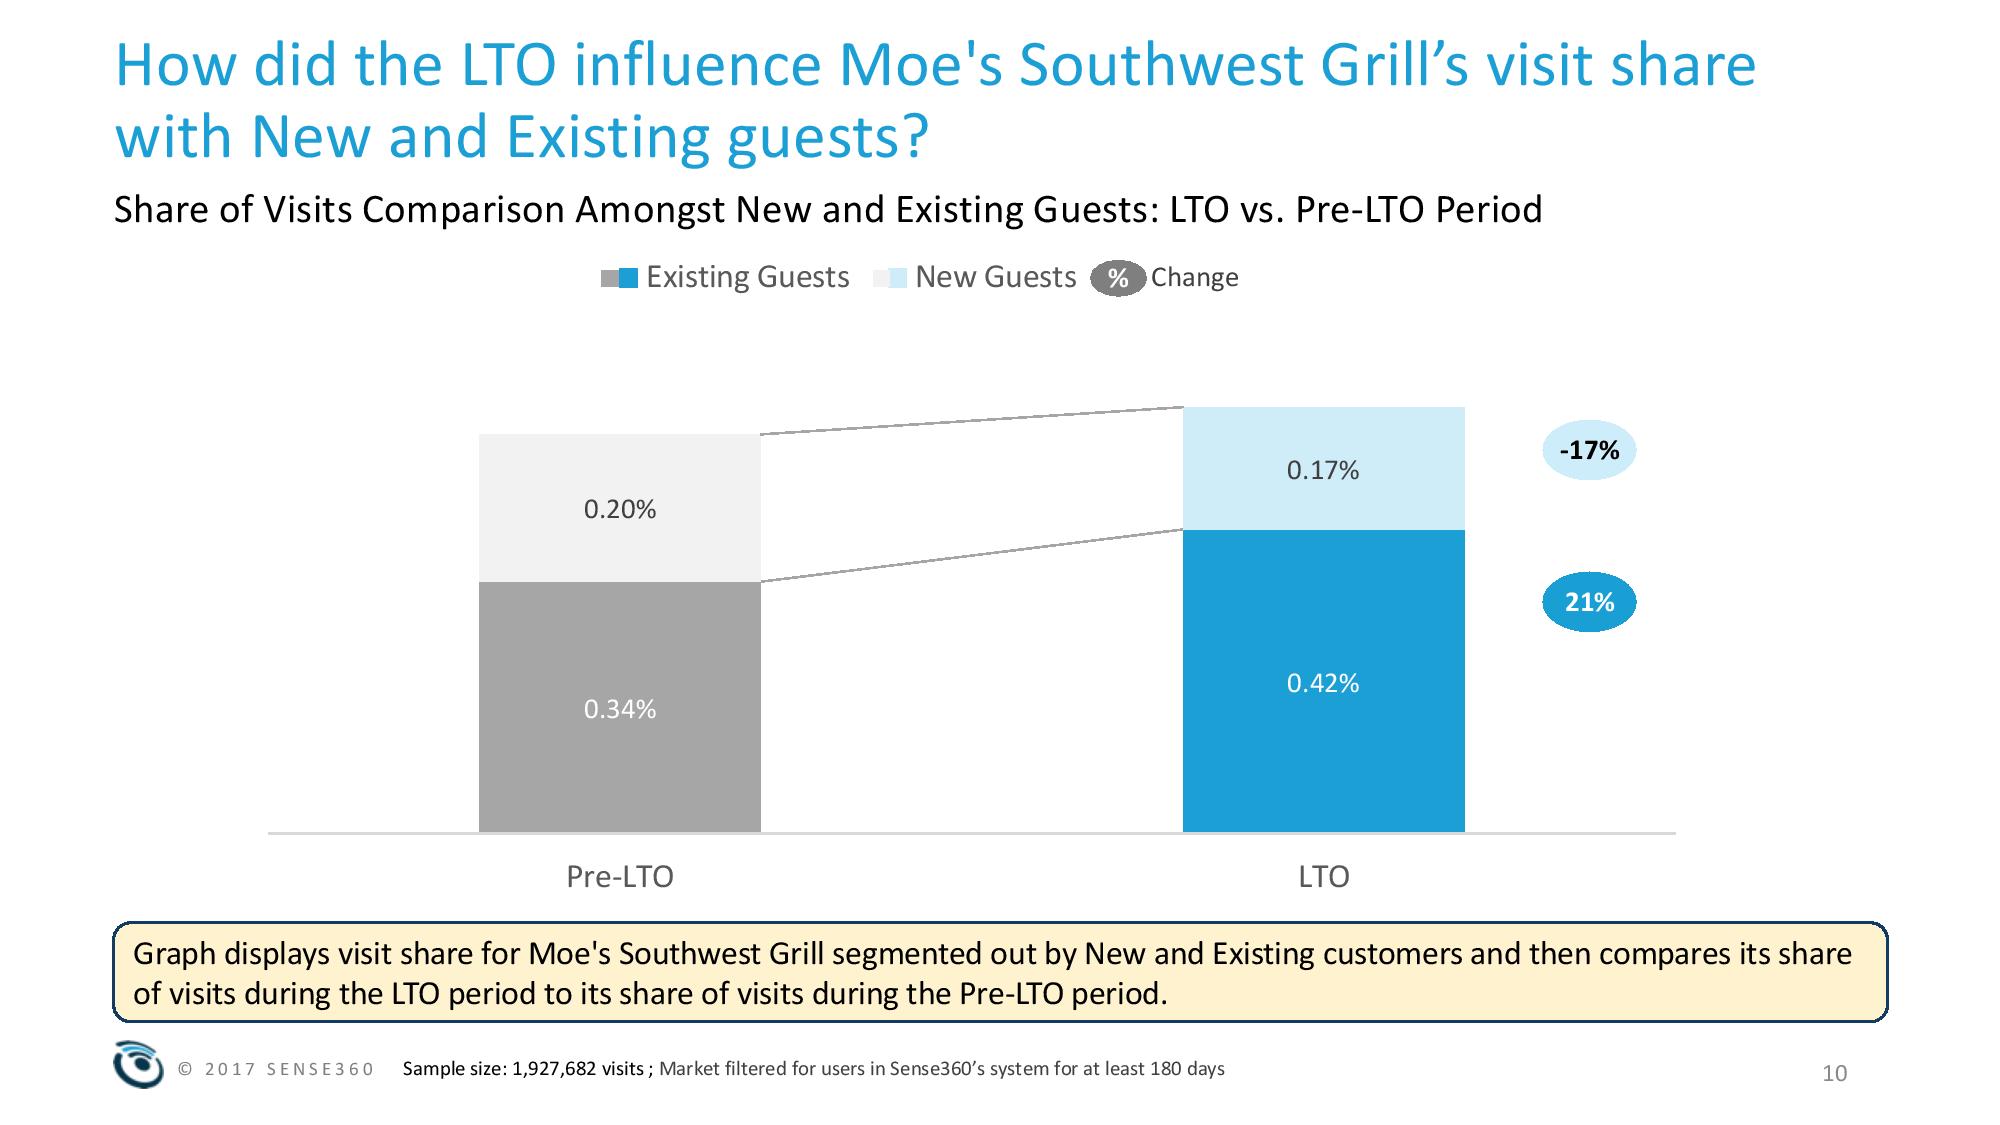
A new report from Sense360 investigates the effects of a limited time offering from Moe’s Southwest Grill on visitation by observing visit patterns both before and during the campaign and highlighting the differences between the two periods. This report specifically looks at the Moe’s Three New Queso Flavors.
Moe’s Southwest Grill expands its queso menu with three new flavors available at all locations nationwide. Sense360 looked at visit trends for two weeks in February 2018 compared to the same two weeks last year. They were able to:
- Understand the difference in Moe’s Southwest Grill’s market share between LTO and Pre-LTO periods
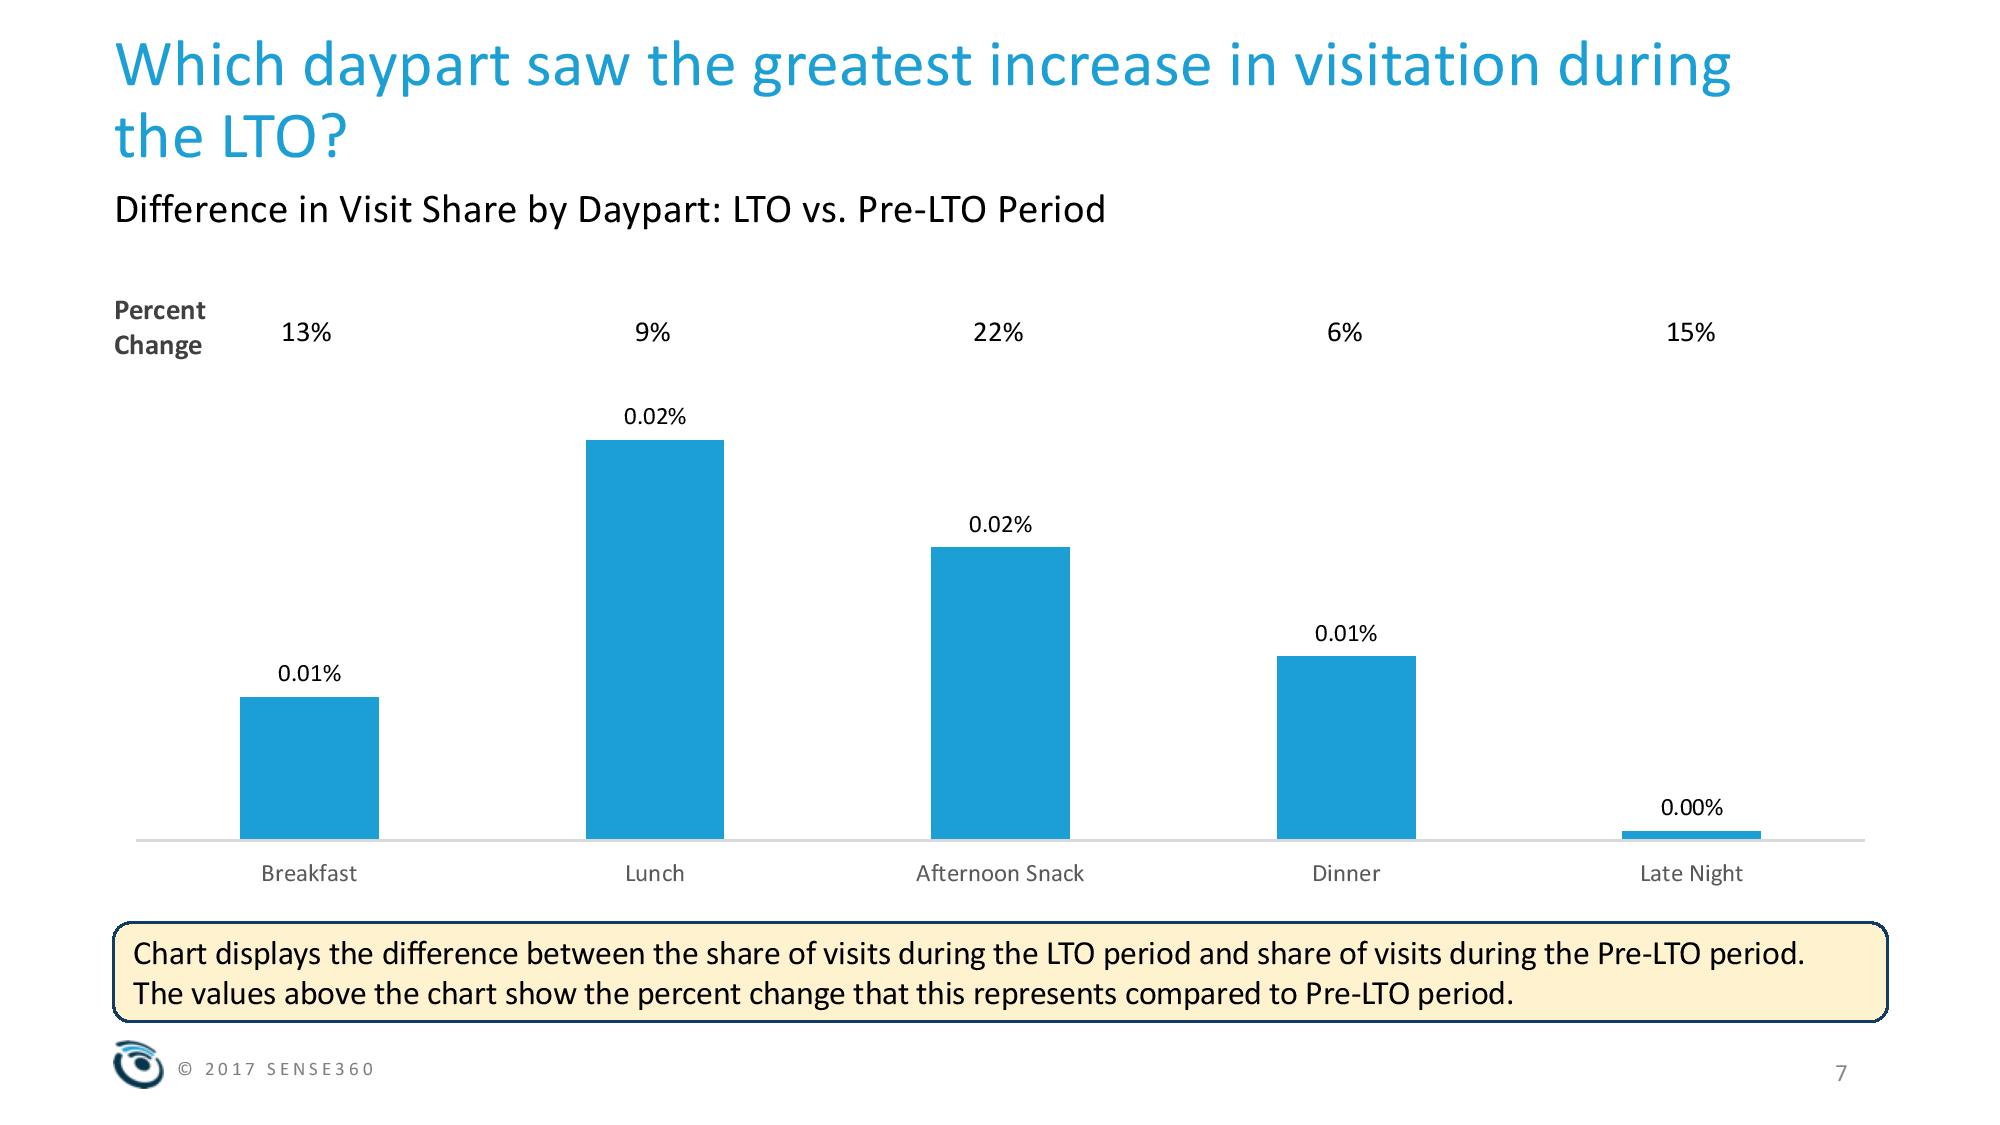
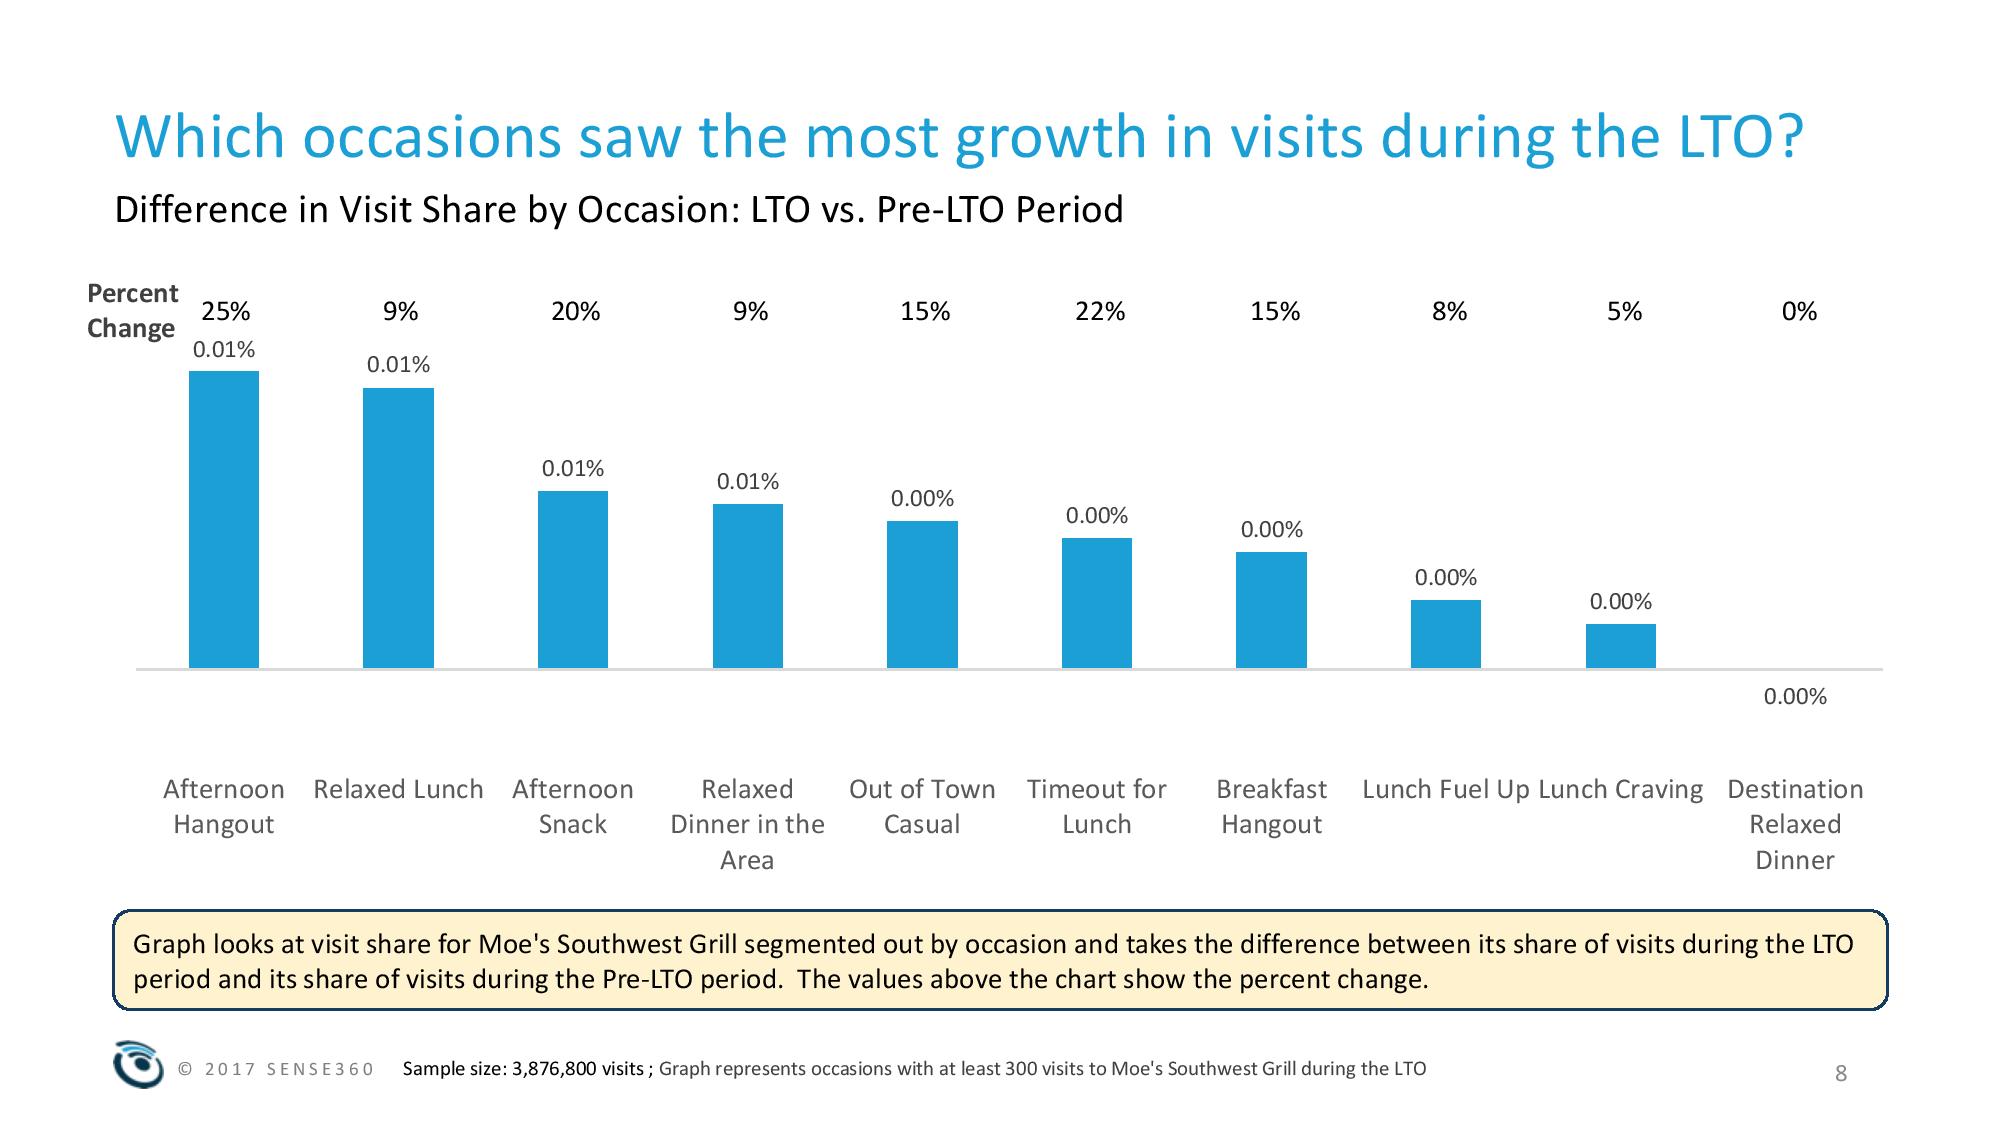
- Identify which occasions and dayparts saw the greatest lift during the LTO
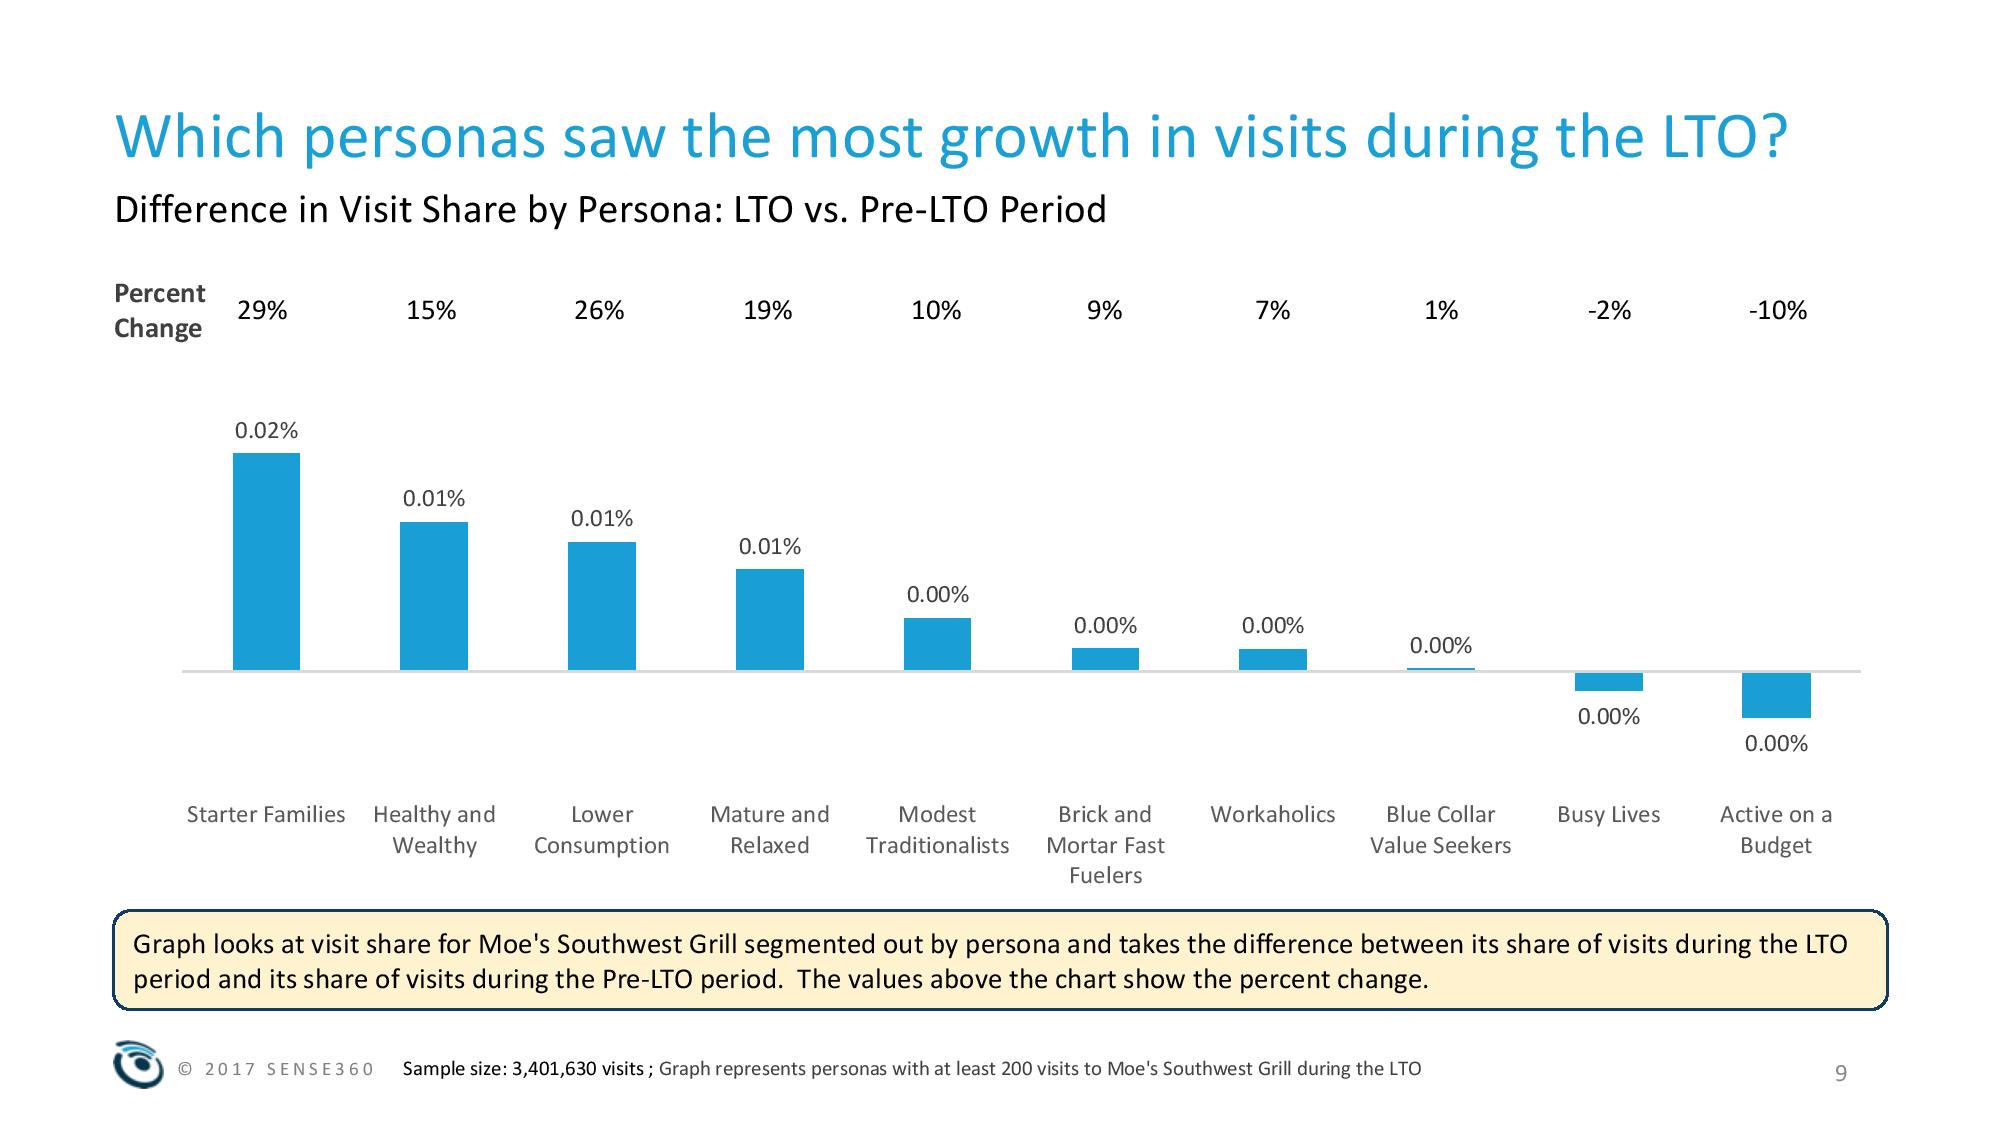
- Learn which guests the campaign resonated with most which guests nd
- See if there was any variation between DMAs during the LTO

Tillster’s Delivery Index
Tillster released an index revealing a number of important findings on customer delivery preferences and habits including but not limited to:
- Customers would order more from their favorite restaurant if delivery was ordered. And, delivery is important to all age groups – not just younger ones.
- More than 70 percent of QSR & Fast Casual customers would choose a restaurant more if delivery were ordered.
- Delivery is most important to the 18-34 age group–more than 80 percent of this group’s customers would order more from a restaurant if delivery were ordered.
- More than 55 percent of customers prefer to order directly from a restaurant website or mobile app.
Tillster’s Delivery Index reveals how Quick Service and Fast Casual restaurants can use delivery to drive orders and build customer loyalty. Tillster partnered with SSI to survey 2,000 Quick Service and Fast Casual customers on their delivery habits and preferences, to help restaurants craft their delivery strategy. A key finding from the study shows a majority of customers prefer ordering directly from a restaurant website or mobile app as their first choice, while fewer customers prefer ordering from third-party aggregators.
“There are many benefits to offering delivery directly through a restaurant website or app” says Perse Faily, CEO of Tillster. “One of the most important, is the ability to control the customer experience, resulting in an increased average check. Restaurants also own customer data, which is an important element in enabling remarketing and retention. In fact, we have seen that when brands focus on retaining customers, these customers can represent the majority of orders, with little incremental cost. And just as significant, this is the preferred means for guests to order from their favorite restaurants.”
Delivery Drives Orders Across All Ages
Customers report they would order from their favorite restaurants one extra time per month if delivery was offered, resulting in increased repeat orders from their loyal customer base.
“It’s a myth that millennials are the only ones demanding new technologies, such as ordering online for delivery” Faily says. “Delivery is a powerful driver across all age groups.”
Customers Want to Order Directly from Restaurants and Pay Clearly Defined Fees
More than 55 percent of customers prefer ordering directly from a restaurant website or mobile app – likely because they crave direct interaction with their favorite brands. And when it comes to delivery fees, they also want to know what they’re paying for, with most preferring a designated delivery fee over higher delivery menu prices.
Download the full Delivery Index here for more details.
Future of Customer Service
Price and quality remain top of mind for customers as they make purchasing choices. But when customers think about their interactions, positive experiences influences purchasing decisions in almost every industry, but are particularly influential in healthcare (78 percent), banking (75 percent), restaurants(74 percent) and hotels (74 percent).
Another interesting finding is that 59 percent of those polled said they would walk away from a brand after several bad customer service experiences and 17 percent saying it only has to be one.
There is not a lot of room to make a mistake.
According to the new survey by PwC, “Future of Costumer Service,” 65 percent of U.S. consumers consider a positive customer experience to be more influential than great advertising, yet 54 percent of U.S. consumers say customer experience at most companies needs improvement.
And they are willing to pay 16 percent more for a better experience.
But what makes a customer’s experience positive?
Nearly 80 percent of American consumers point to speed, convenience, knowledgeable help and friendly service as the most important elements of a positive customer experience. But 64 percent feel companies have lost touch with the human element of the customer experience, with 71 percent of Americans saying they would rather interact with a human than a chatbot or some other automated process and 82 percent want more human interaction in the future.
When customers feel appreciated, companies benefit—including the chance to win more of their customers’ spending dollars. And with 36 percent of consumers saying they plan to spend more in 2018, there is a lot of money to be had. To learn more, click here.
Best Customer Experience
Subway and Popeye’s Louisiana Kitchen deliver the best customer experience in the fast food industry, according to the 2018 Temkin Experience Ratings, an annual customer experience benchmark of companies based on a survey of 10,000 U.S. consumers.
Subway took the top spot out of the 24 fast food chains included in this year’s Ratings, earning a score of 83 percent and placing second overall out of 318 companies across 20 industries. Popeye’s came in a close second with a rating of 81 percent and an overall rank of 12th. Two other fast food chains received “excellent” ratings: Panera Bread and Little Caesar’s, both of which received a score of 80 percent and placed 17thoverall.
Overall, the fast food industry averaged a 76 percent rating in the 2018 Temkin Experience Ratings and came in 2nd place out of 20 industries. The average rating of the industry declined by 0.4 percentage-points between 2017 and 2018, dropping from 76.5 percent to 76.1 percent.
The ratings of all fast food chains in the 2018 Temkin Experience Ratings are as follows:
- Subway: 83 percent
- Popeye’s Louisiana Kitchen: 81 percent
- Panera Bread: 80 percent
- Little Caesar’s: 80 percent
- Baskin Robbins: 79 percent
- Pizza Hut: 79 percent
- Sonic Drive-In: 79 percent
- Starbucks: 79 percent
- Dairy Queen: 79 percent
- Chick-fil-A: 78 percent
- KFC: 78 percent
- Taco Bell: 77 percent
- Dunkin’ Donuts: 76 percent
- Arby’s: 75 percent
- Jack in the Box: 75 percent
- Wendy’s: 75 percent
- Chipotle Mexican Grill: 75 percent
- Hardee’s: 75 percent
- Domino’s: 74 percent
- Papa John’s: 74 percent
- Panda Express: 73 percent
- Burger King: 72 percent
- IHOP: 72 percent
- McDonald’s: 70 percent
“The fast food restaurant does a good job with customer experience. It’s impressive that the four top chains earned excellent scores,” stated Bruce Temkin, managing partner of Temkin Group.
Taco Bell’s customer experience score improved the most over the previous year, gaining seven percentage-points. Hardee’s score, on the other hand, declined the most, dropping by eight points.
Now in its eighth year of publication, the 2018 Temkin Experience Ratings evaluates 318 companies across 20 industries: airlines, auto dealers, banks, computer & tablet makers, credit card issuers, fast food chains, health plans, hotels & rooms, insurance carriers, investment firms, parcel delivery services, rental cars & transport, retailers, software firms, streaming media, supermarket chains, TV & appliance makers, TV/Internet service providers, utilities, and wireless carriers.
The free report, “2018 Temkin Experience Ratings,” is available for download at the Customer Experience Matters® blog (ExperienceMatters.blog) and at the Temkin Group website at www.TemkinGroup.com.
March Restaurant Rebound
Restaurant sales rebounded in March, fueling optimism for improved results for the industry. In March, same-store sales growth was 0.8 percent, the second-best month for restaurant industry sales growth over the last two years. The industry has now experienced positive same-store sales in four of the last six months. These insights come from TDn2K™ Black Box Intelligence™ data through The Restaurant Industry Snapshot™, based on weekly sales from over 30,000 restaurant units, 170+ brands and represent over $69 billion dollars in annual revenue.
March’s numbers offset the disappointing results from January and February. Comp sales for the quarter registered a slight 0.1 percent increase over prior year. The gain was small and a small decline from the 0.4 percent gain in the fourth quarter of 2017. Nonetheless, this represents the first time since 2015 that the industry posted back to back quarters of positive comp sales.
“Since the end of last year, we have been cautiously optimistic about what we believe is a strengthening in restaurant performance and increased consumer spending fueled by solid economic conditions,” stated Victor Fernandez, executive director of insights and knowledge for TDn2K. “Even if the first two months of the year were soft, we believed there were external factors that overshadowed some underlying momentum. March’s results reinforce our view that we are in a period of gradual recovery for the industry. However, the upward trend in results will be modest at best until the industry solves its declining guest count problem.”
Same-store traffic declined -2.1 percent in March, a 0.9 percentage point improvement from February. Same-store traffic for the quarter was -2.7 percent. Even though these results highlight the industry’s traffic challenges, the fact that the last two quarters have been the strongest based on same-store traffic growth in the last two years shows a restaurant industry that is slowly improving.
Consumer Spending Increasing, Lifted by Rising Personal Income
“The consumer may be coming alive again after being somewhat dormant during the early winter,” commented Joel Naroff, president of Naroff Economic Advisors and TDn2K economist. “Vehicle sales rebounded in March and credit card debt is rising. It is likely that the retail sales figures for March will look very solid. In part, the rise is being funded by the slow but steady impact of the tax cuts. But more fundamentally, wage gains are accelerating as well. Personal income is increasing, providing the capacity to spend more.”
“We should see consistently improving demand across the spectrum of retail products, including food away from home. However, a surge in spending is still not expected. Inflation is increasing, eating into spending power and the rising debt is beginning to burden households. The expectation is that restaurant sales will accelerate as we move through the year and well into 2019, but don’t expect a surge in demand.”
Spending Per Guest Increased in the First Quarter
Through restaurants increasing menu prices, relying less on price promotions, guests deciding to spend a little more when visiting a restaurant, or a combination of these factors, the rate at which the average check increased year-over-year accelerated during the first quarter of 2018. Guests spent on average 2.8 percent more year-over-year during the quarter.
Guest check growth has been accelerating in recent quarters. The average for the first two quarters of 2017 was 2.1 percent, while for the second half of the year the average was 2.3 percent growth in checks. This also supports the idea of consumers being willing to spend more in restaurants, given the current economic conditions. Furthermore, TDn2K research has shown that top performing brands have been able to get even higher growth in their average spending per guest.
Upscale Dining Continues to Dominate Sales Growth; Fast Casual and Casual Dining on the Rise
As was the case during 2017, the first quarter of 2018 saw those segments with the highest average checks lead the industry in same-store sales growth. Fine dining and upscale casual have consistently shown strong sales growth and have indicated that consumers are willing to spend for their restaurant experiences. In fact, a recent TDn2K study showed that top performers over the past two years have differentiated their brands in three key areas: alcoholic beverages, ambiance and service. It is precisely in these three guest satisfaction attributes that fine dining and upscale casual brands are poised to succeed when executing correctly.
“However, perhaps the most encouraging news in the first quarter may be that two of the segments that struggled heavily during 2017 are showing some signs of recovery in 2018,” expressed Fernandez. “Casual dining and fast casual, each experiencing sales declines of -1.0 percent or more last year, recorded positive sales in the first quarter of 2018. Moreover, they have now achieved two consecutive quarters of growth.”
Pressure Increases for BOH Staffing
As sales start to pick up for restaurants and traffic is also showing some signs of improvement, the question in many restaurant operators’ minds points towards their capacity to keep up with that increased consumer demand from a staffing perspective. According to a recent study by TDn2K’s People Report™, almost three out of every four restaurant companies reported being understaffed for their customer-facing, front-of-house positions. For back-of-house positions, the situation is even worse. Virtually all restaurant companies said they are constantly understaffed when it comes to those critical kitchen positions.
This is not surprising, given the pervasive trend of rising turnover rates for both restaurant hourly employees as well as those in management positions. People Report’s latest results show non-management, hourly turnover rates again increasing during February. For restaurant managers, rolling 12-month turnover rates remained flat during the month. This offers some sense of relief, no doubt, but is not expected to signify a reversal in the trend. Turnover for restaurant managers is at the highest it has been in recent memory and given the very tight labor market and the intense competition for talent within the industry, management retention is expected to continue to be a significant headache for restaurant companies.
From a labor cost perspective, wages and salaries are showing signs of accelerating their growth, as restaurants opt for offering additional financial incentives as a means to attracting talent in this increasingly tough recruiting environment.
“Those brands that are more successful in their recruitment and retention strategies, the data shows, tend to also be those that do better in their top-line financial results,” explained Fernandez. “More than ever, people need to be at the center of any successful restaurant strategy.”
Top 500 Chains
Results for the 2018 Top 500 Chain Restaurant Report are in, revealing that Top 500 brands posted a cumulative 2017 sales growth of 3.1 percent, down from 3.8 percent growth the prior year. The full report is now available, providing foodservice professionals with sales and unit performance and year-over-year growth for the leading restaurant chains.
The 2018 report can be purchased here.
“We expect to see a lot of the same challenges that operators were facing in 2017 carry over into 2018,” said Joe Pawlak, Technomic managing principal. “Operators will be tasked with finding new ways to steal share from the competition and the rise of technology in foodservice will likely play a part.”
As an extension of the report, Technomic tracks sales, unit counts and locations, key contacts and more for an additional 1,000 emerging chains in the U.S. Details about all 1,500 chains are available on Ignite, Technomic’s cloud-based single source for all things foodservice.
Key findings include:
- While Technomic’s Top 500 is essentially evenly split between limited- and full-service operators, 65 percent of chains ranked 501-1,500 are classified as limited service
- Chains ranked 501-1,500 accounted for approximately $21 billion in sales and 21,800 locations in 2017
- Chains poised to break into the Top 500 based on sales and unit growth include California Fish Grill (ranked 504), Keke’s Breakfast Cafe (ranked 508) and Jimmy’s Egg (ranked 530)
While the Top 500 chains outpaced emerging chains in 2017 in both overall sales growth and unit growth, the limited-service chains ranked 501-1,500 outperformed the Top 500 LSR chains, seeing sales grow by 4.5 percent versus the 3.9 percent observed by chains in the Top 500.
Taxes and Eating Habits
A survey conducted by Bite Squad, found that one third of U.S. consumers claim the thought of preparing income taxes impacts their eating habits. The Bite Squad survey asked U.S. consumers how they feel about food in relation to preparing their income taxes, and found that a large number of respondents change their eating habits to save money or cope with stress as the deadline to file taxes approaches.
Highlights from the survey include:
- Saving money is a top priority among U.S. consumers as tax day approaches, with 12 percent planning to cook more and seven percent planning to eat less in an effort to be more fiscally prudent.
- U.S. online consumers change their eating habits to cope with the stress of taxes, with 13 percent planning to eat healthier to reduce stress and five percent planning to eat more to cope with stress.
- Saving time is a consideration among U.S. consumers as they prepare their income taxes, with five percent planning on using restaurant delivery services or getting take-out in order to save time.
- Women are more likely to eat healthier to deal with the stress (14 percent vs. 12 percent), while men are more likely to let restaurant delivery services like Bite Squad ease the burden of tax day (six percent vs. three percent).
- Younger Americans (18-24) are much more likely to change their eating habits due to taxes than older Americans (65+) (45 percent vs. 26 percent).
“So many of our food behaviors and cravings stem from the environment around us,” said Craig Key, Chief Marketing Officer at Bite Squad. “This is a busy time of year for us, our customers are embracing the convenience of food delivery for a little relief during what can be a stressful time.”
Workers Want Flex
According to a FlexJobs’ survey of more than 5,000 workers, more people reported being interested in a part-time schedule (46 percent) than being interested in freelance work (39 percent). Currently, more than one in six people employed in the U.S. currently work part-time, which is defined as working less than 35 hours a week. To help job seekers interested in finding professional part-time jobs, today FlexJobs released a list of the top 50 companies hiring for professional part-time jobs. This list is based on an analysis of over 49,000 companies and looks specifically at their part-time job posting histories in FlexJobs’ database during the first quarter of 2018 (January 1 through March 31).
American Red Cross, Hilton, K12, and UnitedHealth Group are among the notable companies with the most part-time job listings between the time period. Education, customer service, healthcare, media, and finance are well-represented industries featured on this list of companies with strong part-time hiring activity so far in 2018. Some examples of the part-time jobs these companies are currently hiring for include nurse, photographer, project manager, speech therapist, journalist, information security engineer, and tutor.
“For a variety of reasons, such as family, health issues, or caregiving responsibilities, part-time jobs can be a very attractive option for the pool of educated and highly skilled job seekers who want to continue their career but either don’t want to or aren’t able to commit to a full-time job,” said Sara Sutton Fell, Founder and CEO of FlexJobs. “Part-time jobs can also serve as an excellent avenue for career changers interested in gaining experience in a new industry, or for semi-retirees who want to stay active in the workforce. Despite the misconception that part-time positions are usually lower paying, professional-level part-time jobs do exist for people at all career levels,” Sutton Fell concluded.
The job opportunities at these companies include both employee and freelance options, with hours varying from just a handful of hours each week, to 35 hours a week. Many of these companies were also top employers for remote-friendly jobs, having been included in FlexJobs’ 2018 Top 100 Companies for Remote Jobs list.
According to Hilton, who earned the top spot on the Top 50 Companies for Part-Time Jobs list, “At Hilton, our part-time career options are an extension of our commitment to create a work environment where every Team Member can thrive,” said Amber Weaver, director of corporate recruitment, Hilton. “Providing flexibility in work schedules is just one of the ways that Hilton strives to strike a balance between career and personal lives. From first-time job seekers and military family members to the stay-at-home parent, we are constantly working to provide Team Members with meaningful options.”
For the complete list of the top 50 companies to watch for professional part-time jobs in 2018, click here
Foodservice Gains
Despite the overall weakness in the U.S. restaurant industry, foodservice delivery posted sizable gains in both visits and sales over the last five years, reports The NPD Group, a leading global information company. The 20 percent increase in delivery sales and 10 percent gain in delivery foodservice visits were supported in large part by the growth of digital ordering, which now represent over half of all delivery visits.
“Delivery has become a need to have and no longer a nice to have in the restaurant industry,” says Warren Solochek, senior vice president, industry relations. “Restaurants need delivery in today’s environment in order to gain and maintain share. It has become a consumer expectation.”
Consumers are so accustomed to ordering delivery that they are ordering it at breakfast and lunch in addition to dinner, which historically has been the most popular daypart to order it, according to NPD’s new study, Future of Foodservice Snapshot: Restaurant Delivery. Growth of delivery at dinner has remained flat over the last five year and has grown at breakfast and lunch.
Although digital ordering is a major contributor to the growth of foodservice delivery, using the phone to order still represents 49 percent of delivery visits. Third party delivery services, like UberEats, Grubhub and DoorDash, account for much of the digital delivery growth; however, the share of digital delivery by third party services is more than double among full service restaurants than quick service outlets.
“Convenience is among the chief reasons why consumers visit restaurants and delivery brings a heightened level of it,” says Solochek. “We forecast that delivery will grow over the next five years and the growth with source to non-traditional delivery outlets and dayparts.”
Minimum Wage Survey
The Leadership Conference Education Fund and the Georgetown Center on Poverty and Inequality today released “Bare Minimum: Why We Need to Raise Wages for America’s Lowest-Paid Families,” a report on working people and their struggle to make a living when paid tips, or the federal minimum wage, or less. The report makes a case for raising wages that is grounded in history, economics, and movements across the country, but particularly in the lived experience of our nation’s lowest-paid working people.
“A living wage is not a privilege, it is a civil and human right for all,” said Vanita Gupta, president and CEO of The Education Fund. “The majority of people who would benefit from the policy changes we recommend are women, especially women of color, who are overrepresented in the low-wage workforce. Changes are a bare minimum and needed to redress longstanding inequities. The first-hand stories in this report capture the day-to-day struggles of minimum wage life while underscoring the importance of providing better opportunities for low-income communities. Raising wages is a moral question: do we value the people who are the engine of our economy or not? The answer must be yes.”
“Today, the minimum wage is a poverty wage,” said Peter Edelman, faculty director of the Georgetown Center on Poverty. “Families cannot survive on $14,500 a year—the salary of someone working full time at the federal minimum wage. Significantly raising the minimum wage would help families make ends meet, while also reducing inequality and shrinking the gender and racial wage gaps. On the 50th anniversary of Dr. Martin Luther King Jr.’s death, raising wages for working people would be one step toward realizing his vision of economic and racial justice.”
The report includes the stories of working people from across the country trying to make ends meet on incomes just above the federal minimum wage. The report also recommends four key ways to raise the federal minimum wage and include more working people under its protections:
- Raising the federal minimum wage to $15 per hour;
- Indexing the minimum wage once it reaches $15 per hour so that it will continue to keep pace with cost and standard of living;
- Eliminating the tipped minimum wage; and
- Eliminating the subminimum wage that applies to certain working people with disabilities.
The full report is available here.
Convenience Store Growth
U.S. convenience stores experienced a 15th straight year of record in-store sales and a fourth straight year of $10 billion-plus in pretax profits, according to newly released State of the Industry data from the National Association of Convenience Stores (NACS).
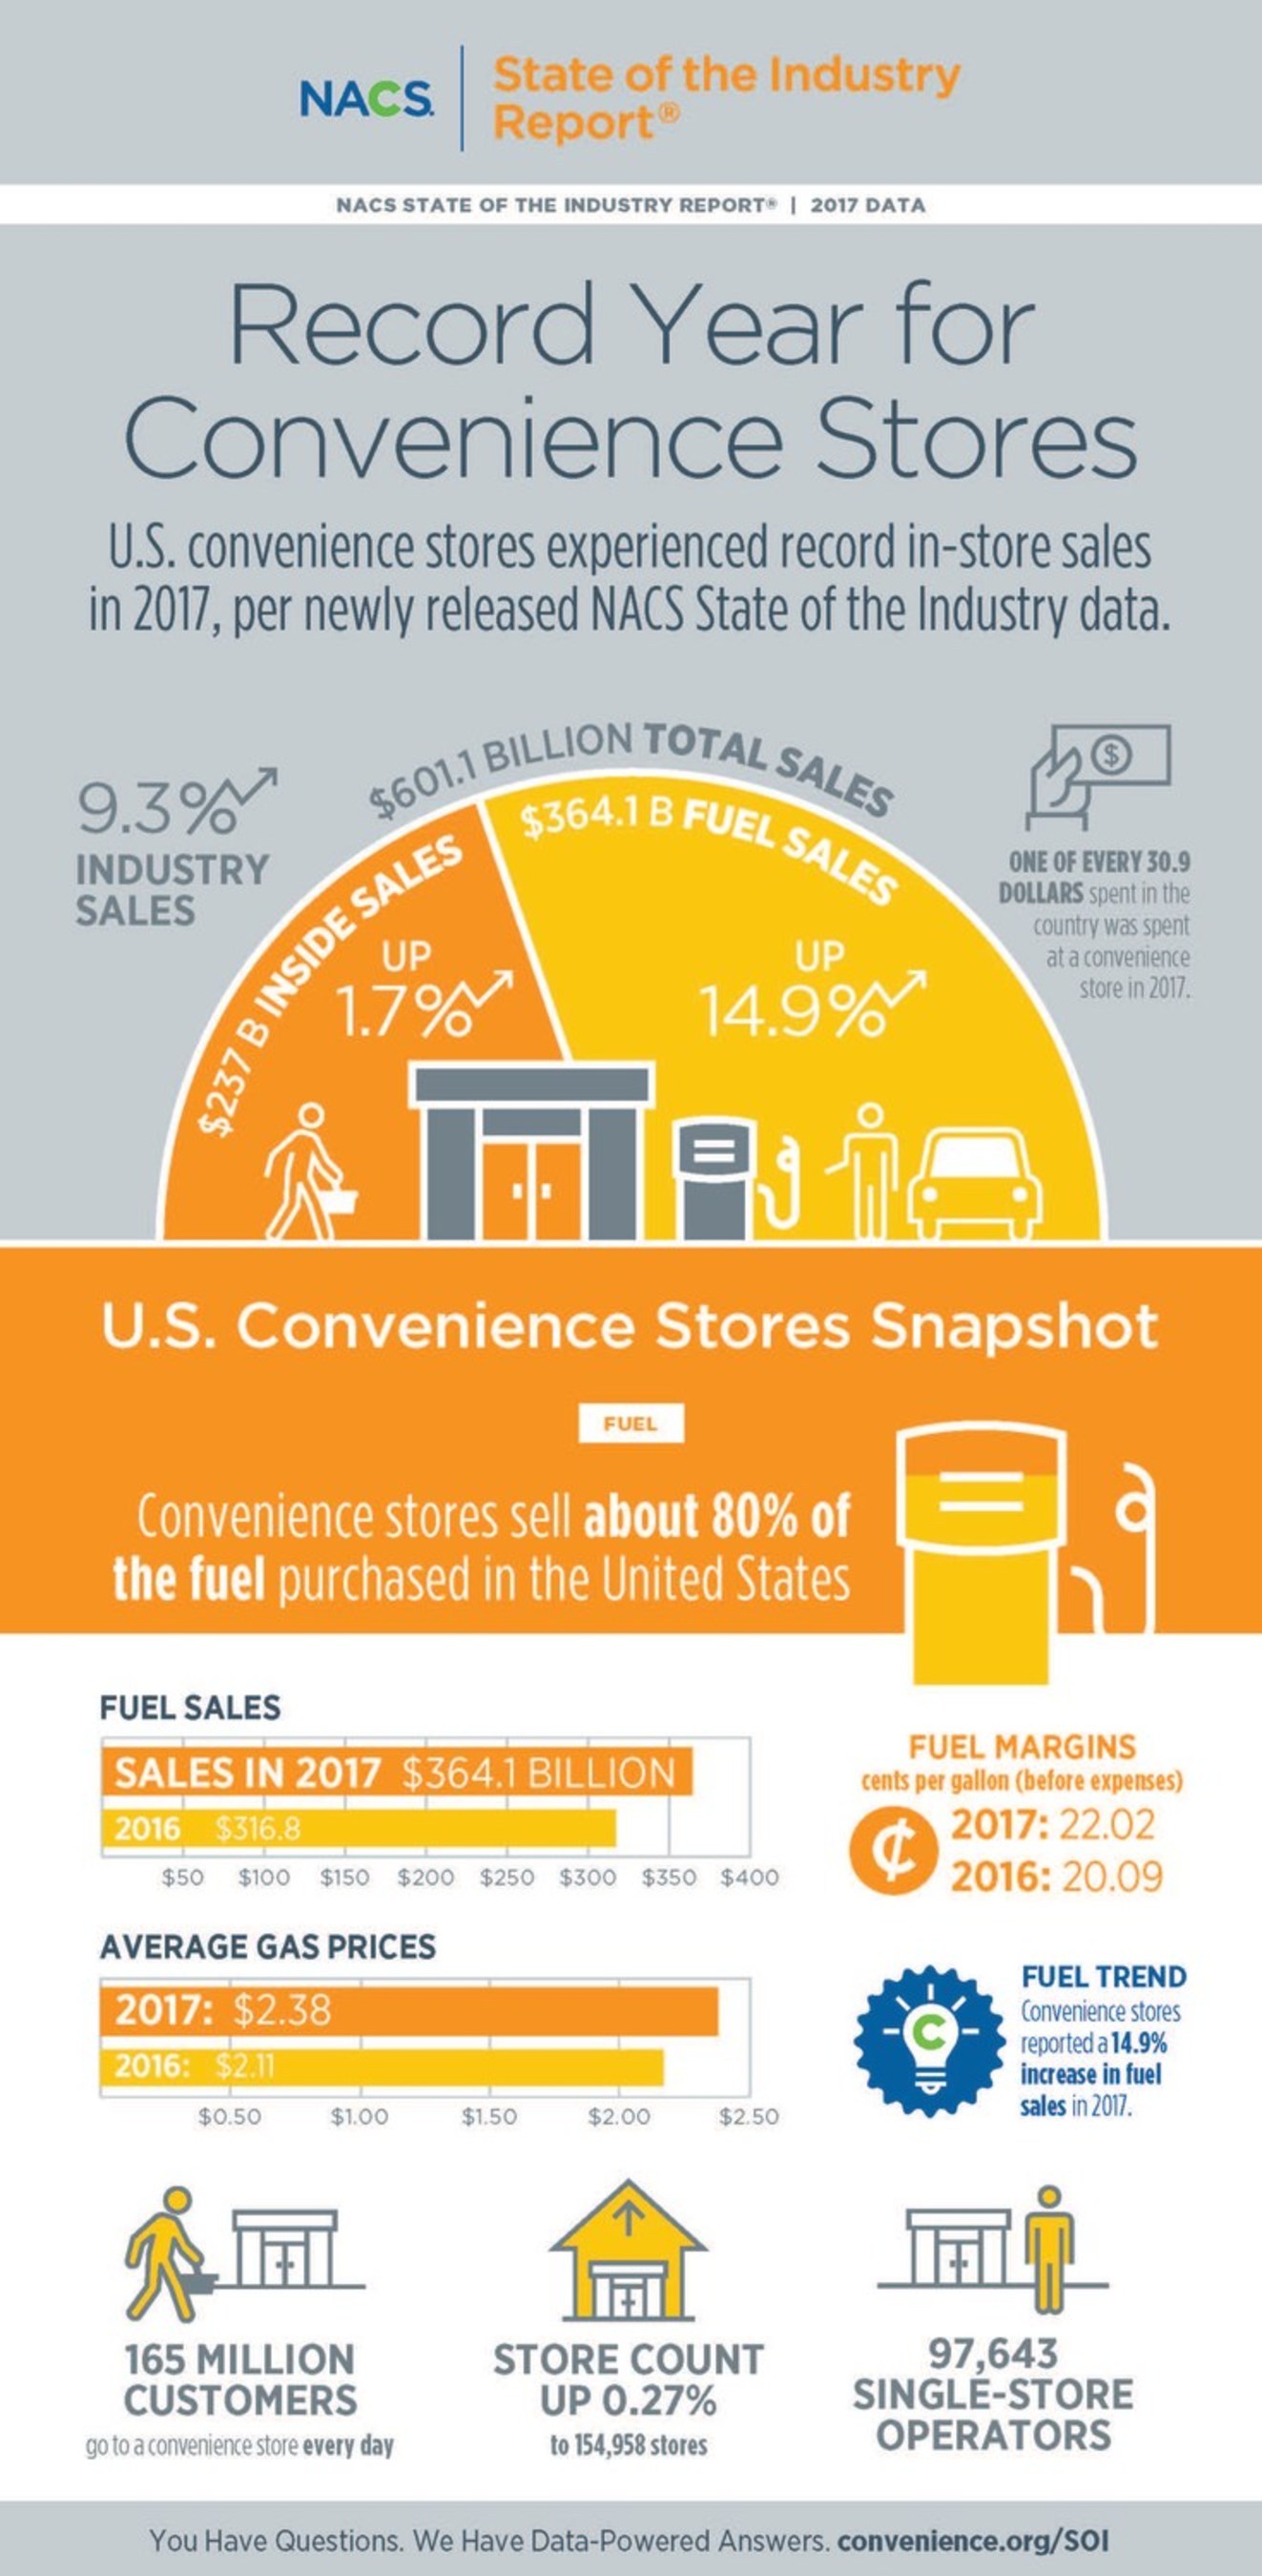
U.S. convenience stores sales overall surged 9.3 percent to $601.1 billion in 2017, led by a 14.9 percent increase in fuel sales. Convenience stores sales overall were 3.2 percent of the overall U.S. gross domestic product of $18.57 trillion (2016 data). Put another way, one of every 30.9 dollars spent in the country was spent at a convenience store in 2017.
The sales increase at convenience stores last year was largely because of higher gas prices in (up 12.8 percent to $2.38 in 2017) and a 1.9 percent increase in gallons sold.
Convenience stores sell an estimated 80 percent of the fuel purchased in the United States and while fuel sales account for 61 percent of sales dollars, fuels margins are still relatively slim and fuels only account for 38 percent of total profit dollars at convenience stores. Overall, convenience store profits were $10.4 billion, a 1.6 percent increase over 2016.
Meanwhile, in-store sales increased 1.7 percent to a record $237.0 billion.
Foodservice, a broad category that mostly includes prepared food (69 percent of both category sales and profits) but also commissary foods and hot, cold and frozen dispensed beverages, continues to be a key focus for growth in the convenience store channel.
Foodservice sales overall in 2017 were $53.3 billion, accounting for 22.5 percent of in-store sales in 2017 and 33.9 percent of gross profit dollars. The category also was the biggest differentiator in terms of profits: top-quartile performers had prepared food sales that were 3.6 times greater than bottom-quartile stores; coffee sales at top performers were 5.2 times greater that than those of the bottom quartile.
Convenience stores sell 23.8 percent of packaged beverages in the United States per Nielsen and saw a slight 0.4 percent sales increase in 2017. Within the category, enhanced water saw the strongest sales increase (9.1 percent); ready-to-drink iced teas (3.5 percent), alternative beverages (3.5 percent) and bottled water (0.6 percent) also posted sales increases.
Snacking categories all had sales growth, as salty snacks (up 5.6 percent), candy (up 2.6 percent) and alternative snacks (up 2.0 percent) all had strong growth as some consumers, especially millennials, moved toward snacking and away from traditional meals.
Fastest-Growing Breweries
The Brewers Association (BA) released its inaugural list of the 50 fastest growing small and independent1 craft brewing companies of 2017. Median growth from 2016 to 2017 for these breweries was 216 percent; the median size of breweries on the list went from 284 barrels in 2016 to 963 barrels in 2017. These companies represent 5.5 percent of craft’s growth by volume for 2017 and include eight brewpubs, 40 microbreweries and two regional craft breweries.
“With five-percent growth overall for small and independent brewers in 2017 and microbreweries and brewpubs delivering the majority of that, we wanted to spotlight some of the breweries driving that growth,” said Bart Watson, chief economist, Brewers Association. “As the growth base for craft becomes more diffuse, these fast growing brewing companies illustrate that a diverse set of success stories still exist.”
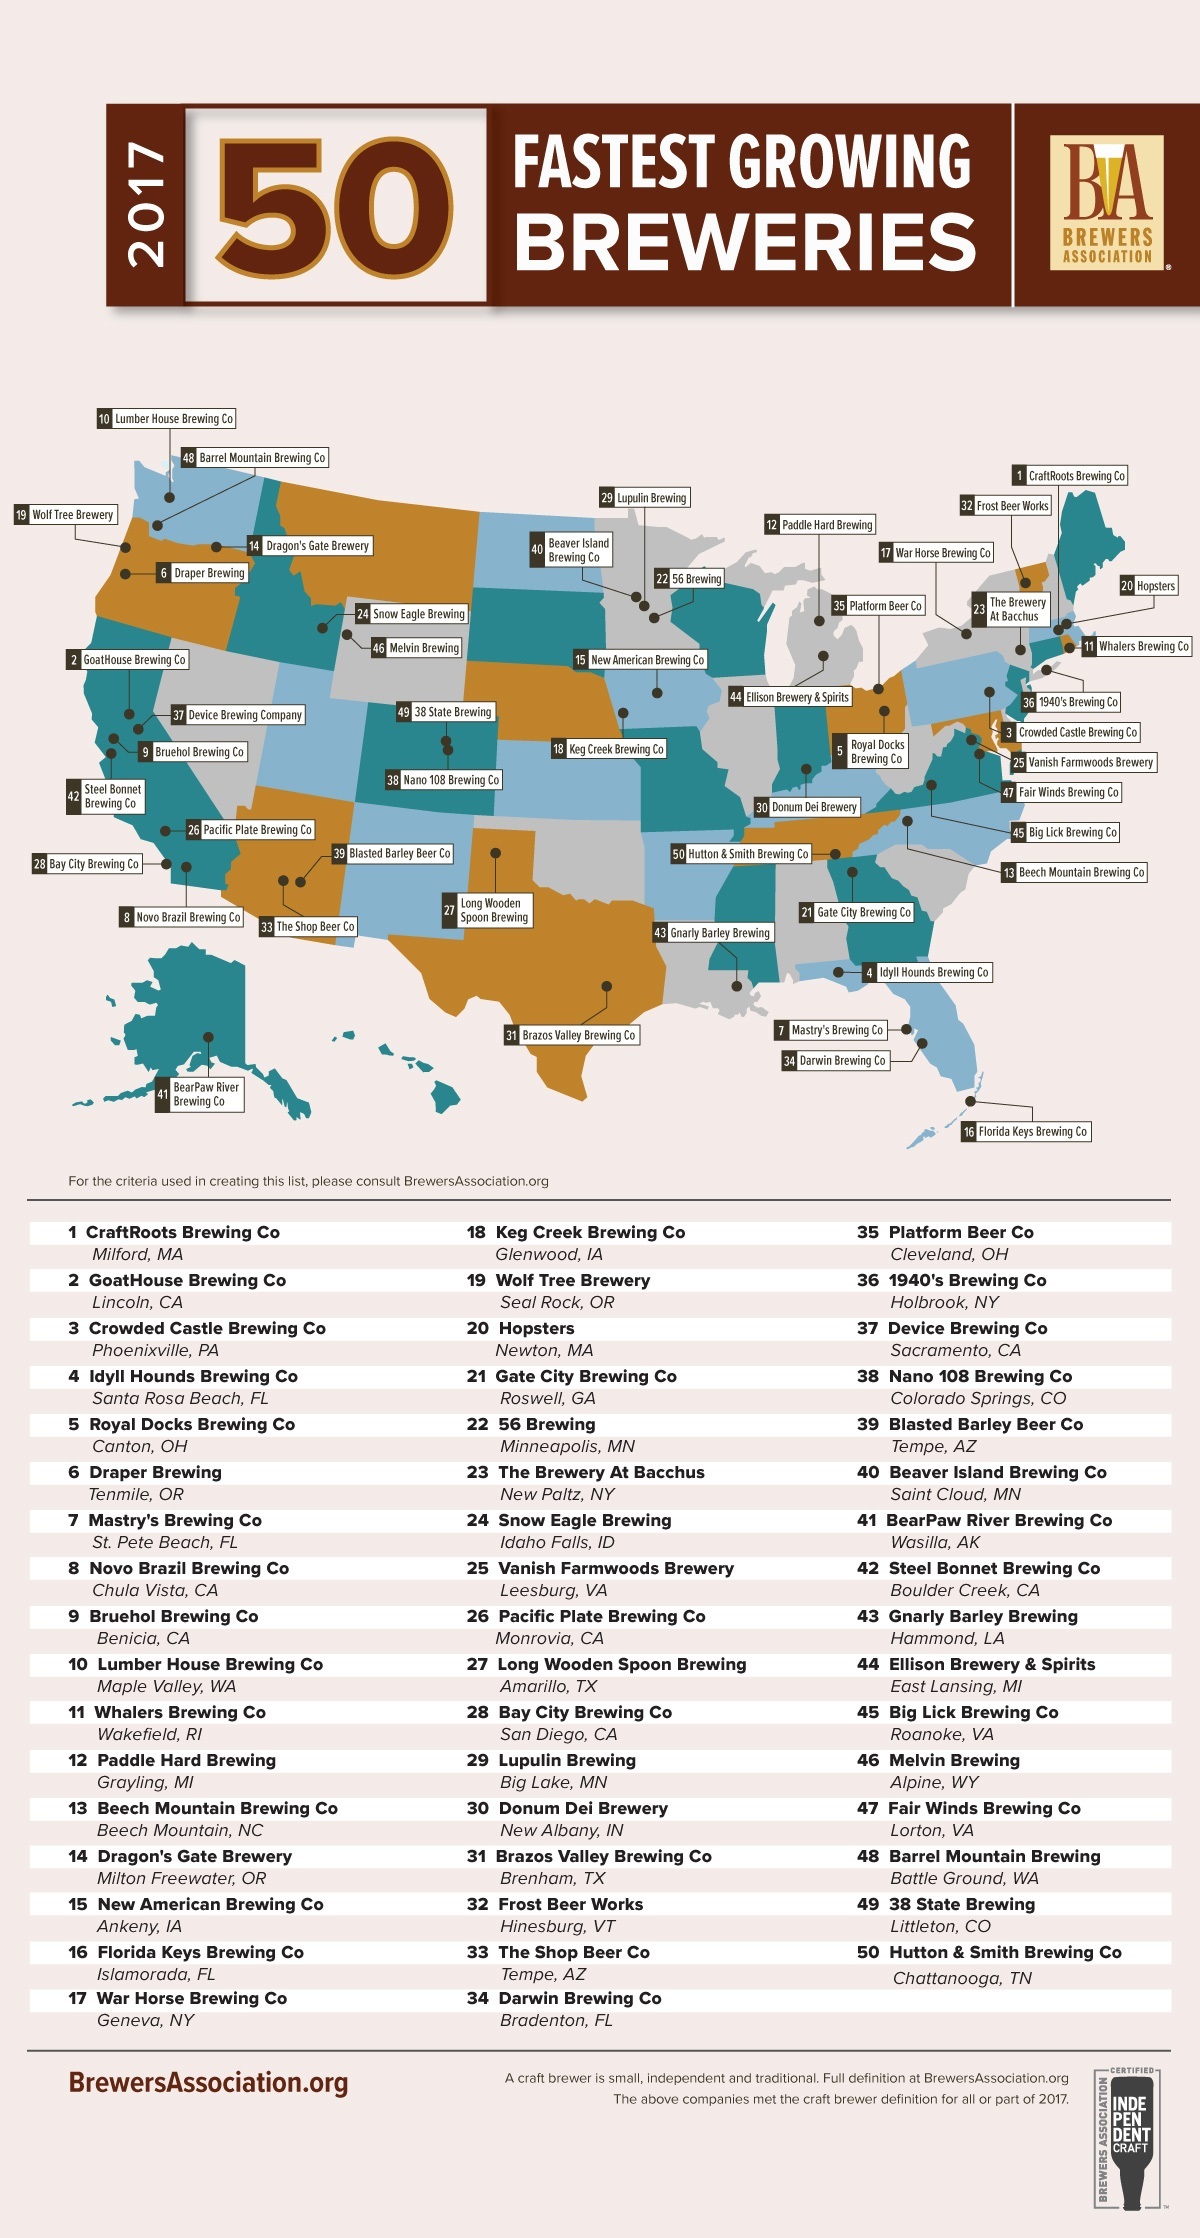
The list presented includes only small and independent breweries with all of their production at their own facilities. Breweries had to have opened 12/31/2015 or earlier to be considered. It only includes breweries that reported to the Brewers Association’s annual Beer Industry Production Survey; breweries with staff estimates or data from state excise tax reports were not considered. Finally, breweries must have had data from at least three years to be considered.
March Retail Sales
March retail sales increased 0.3 percent seasonally adjusted over February and five percent year-over-year as the economy continued to grow, the National Retail Federation said today. The numbers exclude automobiles, gasoline stations and restaurants.
“This is a healthy spending report despite market volatility, unseasonable weather and uncertain economic policies,” NRF Chief Economist Jack Kleinhenz said. “Consumers continue to show resiliency in spending, and these numbers reflect how the economy is performing with a strong job market, gains in wages, improvements in confidence, rising home value and judicious use of credit. The biggest risk to spending is in market fluctuations that could affect confidence, but we expect these basic improvements in economic fundamentals to continue.”
The three-month moving average was up 4.8 percent over the same period a year ago, and the results come as NRF is forecasting that 2018 retail sales will grow between 3.8 percent and 4.4 percent over 2017.
The March results build on improvement seen in February, which was up 0.2 percent over January and 4.3 percent year over year.
NRF’s numbers are based on data from the U.S. Census Bureau, which said overall March sales – including automobiles, gasoline and restaurants – were up 0.6 percent seasonally adjusted from February and up 4.5 percent year-over-year.
Specifics from key retail sectors during March include:
- Online and other non-store sales were up 7.6 percent year-over-year and up 0.8 percent over February seasonally adjusted.
- General merchandise stores were up 6.3 percent year-over-year and up 0.3 percent from February seasonally adjusted.
- Clothing and clothing accessory stores were up 6.1 percent year-over-year but down 0.8 percent from February seasonally adjusted.
- Grocery and beverage stores were up 5.9 percent year-over-year and up 0.2 percent from February.
- Furniture and home furnishings stores were up 4.1 percent year-over-year and up 0.7 percent from February seasonally adjusted.
- Building materials and garden supply stores were up 3.8 percent year-over-year but down 0.6 percent from February seasonally adjusted.
- Electronics and appliance stores were up 1.6 percent year-over-year and up 0.5 percent from February seasonally adjusted.
- Health and personal care stores were up 0.4 percent year-over-year and up 1.4 percent from February seasonally adjusted.
- Sporting goods stores were down 0.9 percent year-over-year and down 1.8 percent from February seasonally adjusted.
America’s Love Affair with Cheese
America’s love for cheese is undeniable, from sandwiches to salads to wedding cakes; cheese can be paired with almost any food group. Through it all, one of the classic uses for cheese remains the grilled cheese sandwich. To help celebrate “National Grilled Cheese Day,” Boar’s Head Brand®, set out to learn more about America’s love for cheese by commissioning a national research study.
The survey polled 1,001 adults from around the United States, aged 18 and older, to gauge overall preferences and feelings towards cheese. The survey revealed that America’s love for cheese is so deep, that 87 percent of respondents would give up either coffee, chocolate, or alcohol before giving up cheese! In fact, Americans don’t just love cheese, they know it as well – sixty percent of respondents could name more than five cheese varieties if asked.
Some other noteworthy findings from the study include the following:
- If they could, nine out of ten respondents would eat multiple servings of cheese every day
- When asked about favorite foods, almost half of respondents (46 percent) rank cheese as their first or second favorite, among a selection of food group options; with those aged 25-34 being most likely to rank cheese first (27 percent)
- American cheese is the top choice for sandwiches (68 percent), with Cheddar topping the list for salads at 59 percent
- Fifty percent of Americans prefer grilled cheese with a blend of two or more cheeses
- When asked if cheese were banned where they live, 2/3 of respondents (66 percent) would either definitely move, strongly consider it, or possibly move.
Bubble Tea Forecast
According to a new report published by Allied Market Research, titled, Bubble Tea Market by Base Ingredient, Flavor, and Component: Global Opportunity Analysis and Industry Forecast, 2017-2023, the global bubble tea market was valued at $1,957 million in 2016, and is projected to reach $3,214 millionby 2023, growing at a CAGR of 7.40 percent from 2017 to 2023. The black bubble tea segment accounted for more than 42 percent share of the global bubble tea market in 2016.
Bubble tea is a widely consumed flavored beverage containing tea as the basic component, along with chewy tapioca balls. It originated in Taiwan and is known by various names such as pearl milk tea, bubble milk tea, boba juice, boba tea, or simply bubble tea. The bubble tea market is driven by cost-effective price and health benefits associated with bubble tea. However, the addition of artificial preservatives & color and presence of excess sugar in bubble tea restrain the market growth. The introduction of new flavors of bubble tea and decreases in demand for carbonated drinks provide opportunities for market expansion.
Request Sample Report here.
By base ingredient, the global bubble tea market is divided into black tea, green tea, oolong tea, and white tea. The green bubble tea segment is estimated to be the most lucrative segment from 2017 to 2023, and account for one-third share of the global bubble tea by 2023. This is attributable to its several health benefits such as prevention cancer and cardiovascular diseases, reduction of cholesterol, improved metabolism, weight loss, and reduced risk of type II diabetes as well as Alzheimers & Parkinsons diseases.
Based on flavor, the global bubble tea market is divided into original flavor, coffee flavor, fruit flavor, chocolate flavor, and others. The fruit flavor bubble tea segment is estimated to grow at the highest CAGR during the forecast period, owing to high consumer preference, diversity in fruit flavor, and higher nutritional value as compared to other flavors.
Based on component, the global bubble tea market is divided into flavor, creamer, sweetener, liquid, tapioca pearls, and others. Liquid component is expected to dominate the bubble tea market throughout the forecast period, as liquid is the base of the bubble tea. The major part of the liquid is the tea, which is the key ingredient in the manufacturing of bubble tea.
Key Findings of the Bubble Tea Market:
-
The green bubble tea is expected to grow at a high CAGR of 8.20 percent, in terms of value, from 2017 to 2023.
-
The chocolate flavor is projected to grow at a high CAGR of 8.20 percent, in terms of value.
-
Europe is expected to grow at the highest CAGR of 9.10 percent, in terms of value.
-
The North American bubble tea accounted for more than 57 percent of the global market in 2016.
-
U.S. accounted for more than 97 percent of the North American market in 2016.
In 2016, North America and Asia-Pacific collectively accounted for more than 83 percent of the global bubble tea industry, in terms of value. This is due to the rapid gain in popularity of the bubble tea in these regions and its lower price. Europe is projected to grow at the highest rate, followed by Asia-Pacific, owing to increase in health benefits offered by consumption of bubble tea.
The major companies profiled in this report are Lollicup USA Inc., CuppoTee Company, Bubble Tea House Company, Ten Ren’s Tea Time, Boba Box Limited, Sumos Sdn Bhd, Gong Cha USA, Boba Tea Company, Troika JC. (Qbubble), and Fokus Inc.
Canadians Like Meat Alternatives
It seems meat alternatives are increasingly making their way onto plates across the country as new research from Mintel reveals that more than half (53 percent) of Canadians say they eat meat alternatives, including one in five (18 percent) who claim to eat them at least a few times a week.
Opportunity to grow meat alternatives extends well beyond consumers following plant-based diets as just 5 percent of Canadians say they are vegetarian and only 2 percent eat vegan diets. A healthful reputation may be helping to drive the category as two in five (21 percent) Canadians overall agree that meat alternatives are healthier than meat.
A testament to the growing popularity of meat alternatives, global meat substitute launches nearly doubled between 2013 and 2017, growing 90 percent in the last five years, according to Mintel Global New Products Database (GNPD). While Germany leads the way, accounting for 11.9 percent of global meat substitute launches in 2017, the Canadian market is ripe for innovation as Canada accounted for just 1.4 percent of launches in the same time frame. Indeed, although meatless burgers (34 percent) and meatless poultry (32 percent) are the meat alternatives Canadians are most likely to consume, other meat alternative types are gaining traction among consumers. One quarter of Canadians say they have eaten meatless hot dogs (27 percent), meatless deli slices (26 percent) and meatless bacon (23 percent).
“Meat alternatives’ growing popularity is giving rise to innovation, and while new product development is currently low in Canada, the increase in global launch activity suggests there is opportunity to expand the category in the region given the fact that roughly half of Canadians claim to eat meat alternative products. In an effort to reach those consumers that are less open to eating meat alternatives, brands should focus on traditional product categories like burgers and poultry as an easy entry point, and a means to expand the category into areas such as hot dogs and deli meats,” said Joel Gregoire, Associate Director, Canada Food and Drink Reports, at Mintel.
Despite increasing interest, the largest barrier to eating meat alternatives is meat itself. In fact, the top reason consumers who don’t eat meat alternatives say they don’t eat them is because they prefer meat (69 percent), followed by not liking the taste of meat alternatives (42 percent). Price is also a barrier for some as one in five (20 percent) say they don’t use meat alternatives because they’re too expensive, rising to more than one third (34 percent) of those aged 18-24.
Meat alternatives still have a ways to go as only 23 percent of Canadians overall agree that meat alternatives are a sufficient substitute for meat and 16 percent think that these products taste as good as meat. What’s more, many of those who do eat meat alternatives have a desire for products to more resemble meat as nearly one third (31 percent) look for meat-like flavours and one quarter (24 percent) look for meat-like textures when purchasing meat alternatives.
“There appears to be significant room to improve consumer perception of meat alternatives relative to meat. For those who don’t eat meat alternatives, blurring the line between meat and meat alternatives is crucial to winning over new converts. While few Canadians follow vegetarian or vegan diets, many do consume meatless products, suggesting that the true opportunity extends beyond those consumers who avoid meat, to those who love meat but may be looking for some healthy options. Meat alternatives that are indistinguishable from ‘real meat’ stand the best chance of realizing the category’s potential,” continued Gregoire.
Aside from mimicking the taste and texture of meat, consumers who eat meat alternatives are most likely to say protein content (40 percent) is an important quality when buying meat alternatives. And it seems consumers today are placing more focus on protein. Canadians are more likely to use traditional sources of protein such as eggs (86 percent), nuts (76 percent), dairy-based offerings (75 percent) and beans (71 percent); however, there is a burgeoning opportunity for adventurous protein sources. In fact, Canadians say that, while they don’t currently consume them, they are interested in trying pea protein (31 percent), spirulina (26 percent) and insects (eg cricket powder) (12 percent).
“As demand for protein in foods outside of meat and other animal-based products grows, the spectrum of proteins that consumers are interested in, or at least willing to eat, appears to be broadening, with many citing interest in emerging ‘buzz-worthy’ proteins ranging from insects to algae,” concluded Gregoire.
Minibar Market
The global minibar market size to reach USD 1.49 billion by 2024, owing to the transformation, growth, and emergence of the hospitality industry worldwide. With the rise in the demand for customer satisfaction and necessity of enhancing profitability in the hotel industry, the demand of minibars is estimated to grow over the forecast period. In addition, the increasing prerequisites of consumers and guests for hassle free services, high comfort, facilities, and luxury while travelling and their stay at elite hotels is anticipated to encourage the market growth. This in turn is expected to reassure the hotel industry to focus on providing value added services such as safety box, laundry, Wi-Fi, ironing, dry cleaning, minibars, in-room dining and others. One of the services offered by exclusive hotels nowadays is the in-room minibars, which adds to customer experience.
The prevailing rate of installation of minibars in rooms of luxury hotels poses growth potential for the global minibar market. Cherishable customer experiences results in enhanced customer loyalty and promotes continued association of customers in future as well, which in turn fuels the growth of minibar market on a global scale.
In terms of product type, the automatic minibars market is expected to grow driven by rise in technological advancements, and use of automated systems in the hospitality industry to ensure privileged services and ensure hassle-free customer handling.
Browse full research report with TOC on “Minibar Market Size Analysis By Product (Automatic, Manual), By Technology (Absorption, Compression, Thermoelectric), By Application (Transportation, Commercial & Residential buildings), And Segment Forecasts, 2014 – 2024” here.
The market for absorption minibars market is estimated to develop swiftly on account of the existing properties such as environment friendly, completely silent, highly reliable, energy efficient, and offers an extended service life. With the rise in technological advancements, automatic minibars can detect missing items, charge the guests based on the usage of the products using sensors and can be synchronized with the property management system (PMS) of hotels. The use of minibars owing to the features offered by them such as fully automated systems which solve issues faced by hotels and offices at operational levels is projected to fuel the overall market growth over the forecast period. The use of minibar in hotels to deliver customer satisfaction is expected to support the market growth for the global minibar market during the forecast period.
In terms of geography, the use of minibars in Asia Pacific is estimated to develop the fastest owing to the budding commercial and hospitality sector, growing tourism, and large customer base in the hospitality, recreational, and other commercial spaces.
Techological Trends in Supply Chain
MHI announces the release of the fifth in a series of MHI Annual Industry Reports developed in collaboration with Deloitte Consulting LLP. The 2018 MHI Annual Industry Report, titled “Overcoming Barriers to NextGen Supply Chain Adoption” provides new insights into trends and technologies that are having a dramatic business impact on supply chains, their security and the people who run them.
Manufacturing and supply chain professionals are facing many challenges but, according to the report, the top ones are increasing customer demands on supply chains (73 percent) and hiring qualified workers (64 percent).
Eleven technologies are working together to create next-generation supply chains that can meet these challenges because they are digital, on-demand and always-on. Eight out of ten survey respondents believe these supply chains will be the predominant model within just five years.
This year’s report provides updates on the innovative technologies MHI predicted would have the most potential to transform supply chains four years ago when the MHI Annual Industry Report was launched. The 2018 report includes two new technologies (Artificial Intelligence and Blockchain) that are rapidly emerging. The report also covers the potential of these technologies to disrupt the industry as well as their adoption rates and common barriers to adoption. The eleven technologies covered in the report are:
- Blockchain
- Robotics and automation
- Predictive analytics
- Internet of Things
- Artificial Intelligence
- Driverless vehicles and drones
- Wearable and mobile technology
- Inventory and network optimization
- Sensors and automatic identification
- Cloud computing and storage
- 3D printing
“Early adopters are successfully combining NextGen supply chain technologies to improve speed and agility and increase efficiency and visibility,” said George Prest, CEO of MHI.
Potential to disrupt and create competitive advantage
The top technologies respondents say can be a source of either disruption or competitive advantage are:
- Robotics and automation (65 percent, up from 61 percent in 2017)
- Predictive analytics (62 percent, up from 57 percent in 2017)
- The Internet-of-Things (IoT) (59 percent, up from 55 percent in 2017)
- Artificial Intelligence (53 percent, new category in 2018)
- Driverless vehicles & drones (52 percent, up from 30 percent in 2015)
Adoption Rates
Cloud computing and storage has the highest current adoption rate at 57 percent. Adoption is expected to grow to 91 percent over the next five years. Inventory and Network Optimization, now at 44 percent adoption is expected to grow to 90 percent over the next five years.
Over the same time frame, Predictive Analytics is expected to reach an 82 percent adoption rate, followed by IoT at 79 percent, Robotics and Automation at 73 percent, Blockchain at 54 percent, Driverless Vehicles and Drones at 50 percent and Artificial Intelligence at 47 percent.
Top Barriers to Adoption
The top three barriers to adoption of these technologies are:
1. Making the business case for NextGen supply chain investments
2. Tackling the supply chain skills gap and workforce shortage
3. Building trust and security in digital, always-on supply chains
Supply Chain Talent Gap
To implement any of these technologies, firms need access to a skilled and increasingly digital supply chain workforce. This has been a theme in all five annual reports and the talent gap is growing as the adoption of these technologies increases.
The top critical skills needed to compete in the next-generation supply chain, according to the survey are strategic problem solving (49 percent), analytics/modeling/visualization (43 percent) and general business acumen and cross-functional knowledge (38 percent).
“Algorithms, automation, sensors, big data and artificial intelligence are dramatically changing what supply chain talent looks like, how to find it and retain it,” added Prest.
Emerging Trend – Blockchain as a Solution to Supply Chain Cybersecurity and Transparency Challenges
When it comes to cybersecurity, the sophistication of hackers and “threat actors” is the biggest risk (44 percent), followed by the lack of awareness of the threat within the organization (40 percent) and poor cybersecurity practices among suppliers (37 percent).
As cybersecurity concerns grow, the demand for transparency at every level of the supply chain is skyrocketing as consumers increasingly expect full information about the origin and history of the products they consume.
Blockchain’s unparalleled ability to enable transparent yet controlled data sharing in a way that is extremely reliable, efficient, and highly-encrypted provides a powerful and robust platform to tackle some of today’s toughest supply chain challenges, while also providing an unmatched level of cybersecurity. This is where blockchain can be a huge supply chain differentiator.
This year’s report introduces the topic of Blockchain and examines how it may be the answer to many cybersecurity, trust and transparency challenges of supply chains.
The biggest barrier for blockchain adoption is that very few people understand what it is or how it can realistically be used in their operations. Only 11 percent of respondents believe they have a working understanding of blockchain technology and how it might be applicable to supply chains.
Adoption of blockchain in supply chains stands at 5 percent, but it is projected to jump to 54 percent over the next five years.
Firms across industries can benefit from using blockchain in their supply chains. Automotive manufacturers, food producers and pharmaceutical manufacturers, among others, can take advantage of the immutable and transparent nature of blockchain to track product origin and quickly and discreetly recall products that may have been produced with a defect, helping to minimize brand damage, costs, and customer inconvenience.
The report also provides real-world case studies of NextGen supply chain technologies and recommendations for leaders for developing strategies to implement these innovations.
“The time is now to think big but start small and act fast. You don’t need to invest a lot to start testing these technologies,” said Scott Sopher, principal and leader of the global supply chain practice at Deloitte Consulting LLP.
“While the transition to NextGen supply chains is complex, inaction is not a strategy. Ignoring these important developments may leave your supply chain at a severe disadvantage in the future,” added Prest.
The findings in this report are based on survey responses from 1,100 manufacturing and supply chain industry leaders from a wide range of industries. Half of respondents hold executive-level positions such as CEO, Vice President, General Manager, or Department Head. Participating companies range in size from small to large, with 47 percent reporting annual sales in excess of $100 million, and 10 percent reporting annual sales of $10 billion or more.
Download the complete report here.
Meeting On-Demand Economy Needs
Zebra Technologies Corporation announced the results of its Future of Fulfillment Vision Study, a global body of research analyzing how manufacturers, transportation and logistics (T&L) firms, and retailers are preparing to meet the growing needs of the on-demand economy. In response to today’s online-buying, smartphone-wielding consumer that expects a seamless, faster purchasing journey, the study revealed that 78 percent of logistics companies expect to provide same-day delivery by 2023 and 40 percent anticipate delivery within a two-hour window by 2028. In addition, 87 percent of survey respondents expect to use crowdsourced delivery or a network of drivers that choose to complete a specific order by 2028.
Key Findings:
- Only 39 percent of supply chain respondents reported operating at an omnichannel level. The survey found reducing backorders was the biggest challenge to reaching omnichannel fulfillment for one-third of respondents followed by inventory allocation and freight costs.
- 76 percent of surveyed retailers use store inventory to fill online orders, and 86 percent of retail respondents plan to implement buy online/pick up in store in the next year. Retailers are investing in retrofitting stores to double as online fulfillment centers and shrinking selling space to accommodate e-commerce pickups and returns.
- Globally, 87 percent of respondents agreed that accepting and managing product returns is a challenge. The increase in free and fast product delivery corresponds with an increase in product returns, a costly concern that retailers struggle to manage efficiently across many different purchasing models. Seven in 10 surveyed executives agree that more retailers will turn stores into fulfillment centers that accommodate product returns. More than 60 percent of retailers that currently do not offer free shipping, free returns or same-day delivery plan to do so while 44 percent expect to outsource returns management to a third party.
- Although 72 percent of organizations utilize barcodes today, 55 percent of organizations are still using inefficient, manual pen-and-paper based processes to enable omnichannel logistics. By 2021, handheld mobile computers with barcode scanners will be used by 94 percent of respondents for omnichannel logistics. The upgrade from manual pen-and-paper spreadsheets to handheld computers with barcode scanners or tablets will improve omnichannel logistics by providing more real-time access to warehouse management systems.
- Radio-frequency identification (RFID) technology and inventory management platforms are expected to grow by 49 percent in the next few years. RFID-enabled software, hardware and tagging solutions, offer up-to-the-minute, item-level inventory lookup, heightening inventory accuracy and shopper satisfaction while reducing out of stocks, overstocks and replenishment errors.
- Future-oriented decision makers revealed that next generation supply chains will reflect connected, business-intelligence and automated solutions that will add newfound speed, precision and cost effectiveness to transportation and labor. Surveyed executives expect the most disruptive technologies to be drones (39 percent), driverless/autonomous vehicles (38 percent), wearable and mobile technology (37 percent) and robotics (37 percent).
Regional Findings
- The need for inventory accuracy will continue to rise in North America. Manufacturers, logistics companies and merchants ranked current inventory accuracy at 74 percent and reported needing to be at 83 percent to handle the rise of omnichannel logistics.
- Retailers in Europe and the Middle East are filling digital orders directly from their physical stores. Retailers and operations leaders are calculating that a network of stores can get digital orders faster and more efficiently than a handful of centralized warehouses. More than 80 percent use store inventory to fulfill orders and 29 percent expect this to increase by greater than 10 percent over the next five years.
- 95 percent of respondents in Asia Pacific rate e-commerce as the driving need for faster delivery. The region expects to implement same-day delivery faster than any other region, and 42 percent of those surveyed ranked drones as one of the most important disruptive technologies.
- Shipping fees and returns are undergoing a makeover in Latin America. Approximately 40 percent of respondents plan to discontinue free shipping, 55 percent expect to end free return shipping and 61 percent forecast the elimination of separate returns facilities that are managed by third-party companies.
Zebra’s Future of Fulfillment Vision Study surveyed more than 2,700 professionals in transportation and logistics, retail and manufacturing firms on their plans, implementation levels, experiences and attitudes toward omnichannel logistics. Surveys were conducted in conjunction with research partner Qualtrics in 2017 across the United States, Canada, Brazil, Mexico, Colombia, Chile, France, Germany, United Kingdom, Italy, Russia, Spain, China, India, Australia and New Zealand.