
According to a Recent Study/Survey … End-of-September 2017 Edition
25 Min Read By MRM Staff
This edition of MRM’s popular “According to …” research roundup is perfect for the start of fall with the popularity pumpkin and coffee news.
Successful Digital Campaigns
Wyng launched the Digital Campaign Index, a real-time scoring system that allows brands to quickly and objectively measure digital campaign performance against other campaigns in their industry by averaging two independent performance indicators — Engagement Score (ES) and Virality Score (VS). The average score usually falls between 0 – 200. The Wyng team compiled their data and insights to provide customers, brand and agencies with objective, independent reference points for assessing the performance of digital campaigns, plus provide actionable insights to help maximize the success future activities.
The study found that co-created content (when a consumer and brand create shareable content together — like a branded SnapChat overlay) scores the highest both virality and engagement wise, out of all forms of campaigns. Media walls (facebook walls) score the lowest. The study found that in general restaurants had a much higher engagement score vs. virality score. Meaning that customers are more likely to engage and deeply experience (by clicking through, filling out forms, scrolling, and spending time) restaurant’s digital campaign as opposed to share virally (by hashtags, campaign shares, content shares, etc.) The average engagement score is 143, while the virality score is merely 78.
Changes in consumer behavior are leading to changes in how brands market and sell online. For example, consumers have grown weary of conventional interruptive advertising. Thanks to social media and user-generated content (UGC), consumers now discover brands from friends and peers online, not from banner or display ads. At the same time, instead of buying from physical locations, consumers are gravitating toward online retail and direct-to-consumer brand.com sites, shortening the distance between discovery, intent and purchase.
Because of these changes, brands can no longer rely on traditional advertising and marketing techniques to build purchase intent and loyalty. In their place, brands must craft digital experiences that cultivate deeper, more authentic relationships with consumers — experiences that result in meaningful consumer engagement and virality. These mid-funnel outcomes can now be measured, benchmarked and optimized using the The Digital Campaign Index, enabling brands to boost top-of-funnel return on advertising and marketing spend and improve bottom-of-funnel conversions.
The DCI Benchmark Report is a quarterly review of DCI benchmarks by industry and campaign format, along with related insights. This report provides brands and agencies with objective, independent reference points for assessing the performance of their digital campaigns, plus current and actionable insights to help maximize the success of their next campaign.
Digital campaigns — from promotions to sampling to shopper marketing programs — are critical to building and nurturing audiences with purchase intent. They exist as landing pages, microsites, website and mobile app embeds, and media formats like Snapchat Ads with WebView. While campaign reports on most platforms often include a dozen or more mid-funnel metrics (time spent, submissions, shares, earned reach, etc.), that approach fails in two ways: it doesn’t speak to the higher level goals of running a digital campaign — engagement and virality — nor does it facilitate comparison between the performance of disparate campaigns. In other words, it doesn’t help marketers develop a broad and comprehensive digital gameplan.
ES, VS and DCI Scores are discussed in detail in The Digital Campaign Index Whitepaper.
Highlights:
Fazoli’s “Win a Trip to Italy!” Campaign — More Viral than Engaging
Fazoli’s ran a sweepstakes campaign offering the chance to win either a trip to Italy or a year’s worth of free Fazoli’s Family Meals. Though the campaign was slightly below the Engagement Score average for its industry and campaign format, it was hundreds of points above the average for Virality demonstrating that a successful campaign doesn’t have to have record-breaking scores for both metrics.
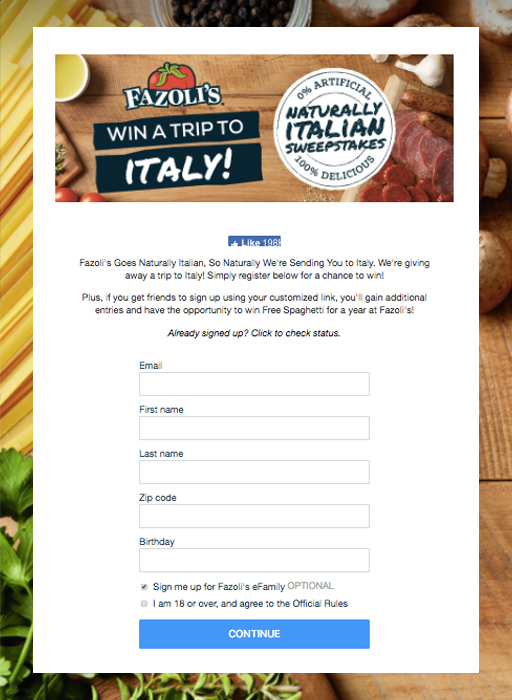
Part of the reason for Fazoli’s success is that the campaign included a refer-a-friend component, so consumers who recruited friends to enter earned an extra chance to win. This functionality can be added to many campaign formats, and campaigns that include refer-a-friend had an average VS of 312 in Q2, well above the average VS of 86 across all campaign formats.
Along with including a refer-a-friend component, Fazoli’s gave consumers a personalized experience by including links for consumers to share the campaign with their networks on Facebook, Twitter or Email. To keep consumers coming back to their campaign, Fazoli incorporated a counter that kept track of how many consumers entered the contest using the personal link someone shared. These best practices that Fazoli incorporated into their campaign can be leveraged by any brand in any industry.
People Prefer Pumpkin
While we heard maple is the new staple, early fall restaurant data indicate that while the dollar total of pumpkin sales aren’t surpassing last year’s figures, demand for pumpkin-related food and drinks is outpacing the previous two years. In other words, it’s a great year for pumpkin-loving consumers: 1) To date, the number of pumpkin offerings is higher than ever before, and 2) the average price for pumpkin items are lower than last year.
Upserve, a restaurant management platform, recently looked at data from bar and restaurant customers around the country related to pumpkin flavored item sales and customer behavior, and has obtained some interesting data points.
- All things pumpkin was America’s obsession last Fall, which in turn created buzz this year
- Compared to the same week last year, the total number of pumpkin items sold went up by 15.3 percent
- Over the same seven week period from 2016 to 2017, the average price of a pumpkin product dropped from $9.20 to $7.81 (a 15.1 percent reduction)
- Additional key findings around how Americans are enjoying their favorite seasonal menu items:
- People treat themselves to pumpkin on Saturdays
It’s true what they say, indulgence is for the weekends. Saturday is when people are most often enjoying their pumpkin-flavored treats, followed by Sunday and Friday. Sales data show that last year over 40 percent more pumpkin items sold on a Saturday compared to the best-selling week day, Friday. So far this year, 50 percent more pumpkin items are selling on Saturday than any week day.
But, not before September
Labor Day weekend really is the unofficial end to summer, and menus change accordingly—Pumpkin Spice pandemonium kicks off during the first week of September according to sales data. Over the past three years, there has been a significant jump in sales of pumpkin menu items between the last week of August and the first week of September. This year, sales increased almost 100 percent during the first two weeks of September.
Dunkin Donuts and Starbucks have it right—when it comes to pumpkin, bigger (selection) is better
The numbers support this, and restaurants that are adding additional pumpkin flavored items to the menu are seeing the reward in terms of sales. According to data, just this year, when 60 percent more pumpkin items were added to menus, sales of pumpkin-flavored items grew over 80 percent.
And this has been a consistent trend, in 2015, when the numbers of pumpkin items added to menus increased by 84.31 percent, sales grew 116.59 percent
How We Pay
In 2017, there are more payment options available to consumers than at any other point in history. But, with the advent of more and more payment options, cash is seemingly getting exiled to the outskirts of strip malls and casinos. Even Visa, who recently announced they would be awarding up to $500,000 to 50 eligible U.S.-based food service owners that made their business 100 percent cash-free, is getting involved in the war on cash.
As a general trend, it seems that even the way in which we pay is getting heavily influenced by the digitization of the 21st century. In a recent poll, LendEDU found that virtually a third of millennials are using the peer-to-peer payment app Venmo for drug-deals, a business that was forever monopolized by cash until a more tech-savvy solution came about.
With such a litany of payment options that the American consumer must choose from, LendEDU sought to discover not only today’s most prevalent payment method, but also the predicted payment trends of tomorrow.
To get this study rolling, LendEDU asked the following question to 875 American consumers ages 18 and up: “What is your main form of payment?”
For both today (42.86 percent) and five years from now (45.71 percent), debit card received the plurality of votes, which makes sense. Debit cards offer the ease of credit cards without the headaches that come with utilizing credit. The payment method that experienced the biggest drop off in votes between today and five years from now was cash. In an ode to the future, nearly 11 percent less poll participants believed they would still mainly be using cash in five years when compared to how they are paying for things now.
Credit cards also saw a slight decrease in potential users from today to five years down the road. While 23.31 percent of respondents said a credit card is their main form of payment today, only 21.83 percent said it would be their main form of payment in five years.
Both credit cards and cash received less votes from poll-to-poll, so where did those votes go? Digital wallets, mainly.
From one poll to the next, digital wallets, such as ApplePay, saw the biggest jump in the number of respondents that believed it would become the next big payment vehicle in five years. .91 percent of respondents said a digital wallet was currently their main form of payment, but 9.49 percent believed it would become their main payment form in five years.
Additionally, “Echeck” saw a poll-to-poll increase from .34 percent to ,8 percent, while “virtual currency” also saw a bump from .80 percent to 1.37 percent.
With the exception of cash and digital wallets, the discrepancies between payment forms of today and payment forms in five years were not all too drastic. However, when we asked respondents to state how they believed future generations will be making payments, there was a seismic shift in the results.
American’s Believe Digital Wallets, Virtual Currencies Will See Major User Growth in Future Generations
All 875 respondents were asked to answer the following question: “How do you think your children/future generations will be making payments?”
This particular question produced some really interesting results. Unlike the previous two questions, “debit card” no longer received the plurality of votes. Instead, “digital wallet” received the plurality of votes with 28.11 percent. If these three questions are taken collectively, digital wallets emerged as the clear winner. Despite digital wallets’ lack of popularity now (only .91 percent said it was currently their main form of payment), 9.49 percent of our respondents believed it would become their main form of payment in five years, and 28.11 percent believed it would be the main form of payment for future generations. Displaying a consistent upwards trajectory, expect to see more Americans using their phone’s digital wallet as you wait in the check-out aisles of the future.
While digital wallets trended upwards, cash went in the opposite direction. With each poll, cash received less and less votes until only 11.31 percent believed cash would be the main payment method of their children. Interestingly, cash only received a slightly higher percentage of the vote than did “virtual currency,” which raked in 8.80 percent.
Only 2.51 percent more people believe cash will be more prevalent than virtual currencies in the future.
You would be hard-pressed to find a more forward-thinking statistic than this: Only 2.51 percent more people believe cash will be more prevalent than virtual currencies in the future. The belief that virtual currencies, like Bitcoin, will become more mainstream in later years falls right in line with a previous LendEDU poll that found more Americans would be willing to invest in Bitcoin in the future, especially younger consumers.
Another eye-catching statistic from this particular question was that 11.89 percent of the respondents believed “some other form of currency not yet invented” would be the main form of payment for future generations. That answer option actually received more votes than did “cash,” “Echeck,” and “virtual currency.” It is impossible to predict what the next big payment vehicle will be, and if someone had explained the idea of Bitcoin to you ten years ago, you probably would have called the nearest psychiatric ward. Nonetheless, the fact that the answer received a considerable amount of votes is indicative of the American belief in innovation, and that many consumers believe current payment methods are outdated and vulnerable to be replaced.
It is worth noting that two of the more popular vote-getters for the first two questions, credit card and debit card, both experienced a dip in their respective shares of the voter pool. Cash seems to be the payment form that will suffer the most as time goes on. Cash is currently being phased out by many small businesses, and our poll results showed a direct correlation between the progression of time and the percentage of people that think cash will still be the main form of payment.
31.77 percent of our respondents said that cash is currently their main form of payment, while the remaining 597 poll participants selected a different payment mechanism. We wanted to find out some cash-trends amongst those 597 respondents that have already moved on from paper money.
We asked that cohort of poll participants the following question: “How often would you say you have cash on hand?”
The plurality of voters, 41.37 percent, said that they have cash on them sometimes. The second lowest proportion of respondents, 13.57 percent, said they always have cash on hand, while the third lowest proportion, 16.92 percent, said they have cash on hand more often than not. The second highest percentage of respondents, 25.63 percent, said they have rarely have cash in their possession. Only 2.51 percent claim they never have cash on them.
The purpose of that question was to clarify how prevalent cash still is amongst Americans that have a main form of payment other than paper money. As a general trend, it seems that most casual users of cash have a limited chance of having cash on their person, indicative of how increasingly unnecessary it is to have dollars on you when there are so many other viable payment options out there.
The next question was only asked to the respondents that one, had a main form of payment other than cash, and two, selected any answer from the question immediately above other than “always.”
In total, 516 respondents were proposed the following question: “Would you say you go to a business less because they only accept cash?”
Although the plurality of poll participants, 49.81 percent, said that they would take out cash if they really wanted to go to a cash-only business, this question still produced some telling results. 15.31 percent of respondents stated they can never go to cash-only establishments because they never have cash on them. Another 34.88 percent said this predicament prevents them from going to a business more than they would if that business accepted card.
Many of the establishments that do not accept anything other than cash are small, mom-and-pop businesses that are often toeing the line between going out of business and surviving the month. While many forward-thinking businesses are phasing out cash , the cash-only businesses are heading backwards. Just imagine how much more comfortable these cash-only businesses would be if they accepted other payment forms and retained even half of those consumers that said they are prevented from going to their favorite places because of their payment practices.
The spending tendencies between those who mainly use cash and those who mainly use a credit or debit card are almost identical. 74.37 percent of heavy cash users said that they use cash to pay for everything, including food, housing, and bills. Similarly, 71.68 percent of credit or debit users said they use their plastic for everything.
While the consequences for using a debit card for all expenses are not severe, consumers must be careful about swiping their credit card for everything. Utilizing a significant portion of your credit (which is what would happen if you are paying for everything with a credit card) not only makes you a risky, undesirable proposition for the credit card companies, but also puts you at risk of racking up serious APR fees if you overspend.
For those respondents that were either using cash for some things or a credit/debit card for some things were asked to specifically identify what they were using either payment vehicle for.
Grubhub Ordering Trends
Grubhub announced the results of its analysis of the past year’s efficient ordering trends. The findings provide insights on how people are using Grubhub’s Express Reorder, Preorder and Pickup features to place takeout orders with ease.
Some savvy ordering “winners” include:
- New York City, taking the top spot in the “Fastest Foodies” category. New Yorkers use the Express Reorder feature 91 percent more than the rest of the country.
- Portland, Ore., leading the pack in the “Food Forecasters” category.Portland diners use Preorder, Grubhub’s feature that lets diners order up to five days in advance, 140 percent more than the rest of the country, planning their meals ahead of time.
- Albany, N.Y., placing first in the “City Skippers” category. People inAlbany use Grubhub’s Pickup feature 101 percent more than the rest of the country to skip the lines and delivery fees.
- Overall, females are more likely to plan ahead using Preorder 105 percent more than males.
- Meanwhile, males are more likely to quickly reorder a favorite past meal, leveraging Express Reorder 18 percent more than females.
- New Yorkers, placing as the top banana orderers! People in the Big Apple quickly reorder bananas 85 percent more than the rest of the country.
- “We’re committed to finding new ways to connect our diners with great local restaurants so that they can discover the food they want, whenever the craving hits,” said Barbara Martin Coppola, CMO, Grubhub. “Whether our diners are planning ahead by preordering, picking up at the restaurant to skip the line, or quickly reordering from one of their favorites, we’re always gathering feedback and using insights from our diners to introduce features that make their lives easier.”
Data Findings include:
Top 10 “Fastest Foodie” Cities & Fun Facts
Cities that most commonly use the Express Reorder feature
New York City places 91 percent more Express Reorders than the rest of the U.S.
Most Express Reordered Dish: Turkey sandwich
Gender Wars: Males place 41 percent more Express Reorders than females
Cambridge, Mass. places 72 percent more Express Reorders than the rest of the U.S.
Most Express Reordered Dish: Vegetable tempura
Gender Wars: Males place 39 percent more Express Reorders than females
San Francisco places 60 percent more Express Reorders than the rest of the U.S.
Most Express Reordered Dish: Jeera rice
Gender Wars: Males place 46 percent more Express Reorders than females
Somerville, Mass. places 56 percent more Express Reorders than the rest of the U.S.
Most Express Reordered Dish: Salmon roll
Gender Wars: Males place 31 percent more Express Reorders than females
Boston places 52 percent more Express Reorders than the rest of the U.S.
Most Express Reordered Dish: Spicy scallop roll
Gender Wars: Males place 22 percent more Express Reorders than females
Los Angeles places 32 percent more Express Reorders than the rest of the U.S.
Most Express Reordered Dish: Hashbrowns
Gender Wars: Males place 27 percent more Express Reorders than females
Jersey City, N.J. places 27 percent more Express Reorders than the rest of the U.S.
Most Express Reordered Dish: Boneless chicken kabobs
Gender Wars: Male place 48 percent more Express Reorders than females
Washington, D.C. places 22 percent more Express Reorders than the rest of the U.S.
Most Express Reordered Dish: Goat biryani
Gender Wars: Males place 8 percent more Express Reorders than females
Chicago places 19 percent more Express Reorders than the rest of the U.S.
Most Express Reordered Dish: Chicken makhani
Gender Wars: Males place 13 percent more Express Reorders than females
Arlington, Va. places 14 percent more Express Reorders than the rest of the U.S.
Most Express Reordered Dish: Chicken pakora
Gender Wars: Males placed 23 percent more Express Reorders than females
Top 10 “Food Forecaster” Cities & Fun Facts
Cities that most commonly use the Preorder feature
Portland, Ore. places 140 percent more Preorders than the rest of the U.S
Most Preordered Dish: Chicken tacos
Gender Wars: Females place 195 percent more Preorders than males
Austin, Texas places 104 percent more Preorders than the rest of the U.S
Most Preordered Dish: Tortilla soup
Gender Wars: Females place 107 percent more Preorders than males
Dallas places 87 percent more Preorders than the rest of the U.S
Most Preordered Dish: Cobb salad
Gender Wars: Females place 161 percent more Preorders than males
San Diego places 76 percent more Preorders than the rest of the U.S
Most Preordered Dish: Mediterranean salad
Gender Wars: Females place 129 percent more Preorders than males
Houston places 65 percent more Preorders than the rest of the U.S
Most Preordered Dish: Chicken salad sandwich
Gender Wars: Females place 200 percent more Preorders than males
Seattle places 45 percent more Preorders than the rest of the U.S
Most Preordered Dish: Veggie pizza
Gender Wars: Females place 117 percent more Preorders than males
Rochester, N.Y. places 38 percent more Preorders than the rest of the U.S
Most Preordered Dish: Buffalo chicken salad
Gender Wars: Females place 85 percent more Preorders than males
Boston places 32 percent more Preorders than the rest of the U.S
Most Preordered Dish: Veggie pizza
Gender Wars: Females place 117 percent more Preorders than males
San Francisco places 30 percent more Preorders than the rest of the U.S
Most Preordered Dish: Cobb salad
Gender Wars: Females place 86 percent more Preorders than males
Las Vegas places 28 percent more Preorders than the rest of the U.S
Most Preordered Dish: Chinese chicken salad
Gender Wars: Females place 88 percent more Preorders than males
Top 10 “City Skippers” Cities & Fun Facts
Cities that most commonly use the Pickup feature to skip the lines and delivery fees
Albany, N.Y. places 101 percent more Pickups than the rest of the U.S
Dish Most Ordered for Pickup: Bacon, egg and cheese sandwich
Gender Wars: Females place 2 percent more Pickups than males
New Brunswick, N.Y. places 98 percent more Pickups than the rest of the U.S
Dish Most Ordered for Pickup: Chipotle chicken wrap
Gender Wars: Males place 39 percent more Pickups than females
Evanston, Ill. places 92 percent more Pickups than the rest of the U.S
Dish Most Ordered for Pickup: Philadelphia roll
Gender Wars: Females place 11 percent more Pickups than males
College Park, Md. places 80 percent more Pickups than the rest of the U.S
Dish Most Ordered for Pickup: Rainbow roll
Gender Wars: Females place 25 percent more Pickups than males
Troy, N.Y. places 80 percent more Pickups than the rest of the U.S
Dish Most Ordered for Pickup: Chicken pesto pizza
Gender Wars: Males place 8 percent more Pickups than females
Cambridge, Mass. places 58 percent more Pickups than the rest of the U.S
Dish Most Ordered for Pickup: Chicken tikka masala
Gender Wars: Females place 6 percent more Pickups than males
Boston places 58 percent more Pickup than the rest of the country
Dish Most Ordered for Pickup: Yellowtail and scallion roll
Gender Wars: Females place 3 percent more Pickups than males
Philadelphia places 42 percent more Pickups than the rest of the country
Dish Most Ordered for Pickup: Grilled chicken cobb salad
Gender Wars: Females place 2 percent more Pickups than males
Rochester, N.Y. places 41 percent more Pickups than the rest of the country
Dish Most Ordered for Pickup: Fajita burrito
Gender Wars: Males place 11 percent more Pickups than females
Stamford, Conn. places 41 percent more Pickups than the rest of the country
Dish Most Ordered for Pickup: Barbecue chicken wings
Gender Wars: Females place 9 percent more Pickups than males
Consumer Foodservice Delivery to Grow 51 Percent by 2021
Consumer foodservice is forecasted to reach US$3 trillion by 2021 with delivery as the fastest growing channel at 51 percent from 2016 to 2021, according to the latest data from Euromonitor International, a global market research company. Integrated technologies, better menu offerings and the overall “Experience More” megatrend, where consumers prioritise experiences over things, are impacting global foodservice, and operators need to cater to these shifting consumer preferences.
“Technology is replacing the service elements that defined more traditional restaurants,” says Stephen Dutton, consumer foodservice analyst at Euromonitor International. “Many new restaurant concepts feel they must leverage technology to remain relevant to younger consumers who have grown up in a more tech-enabled environment.”
Consumers want to eat at restaurants with values and causes that matter to them. As a result, more restaurant operators are embracing concepts that offer a holistic dining experience to meet the demand for dining occasions that match consumers’ values.
“Minimising food waste is one of those,” continues Dutton. “No-waste restaurants not only seek to minimise the amount of food that is wasted, but aim to do so in a creative, culinary way that generates excitement and enhances the dining experience.”
How Kids Spend Money
Greenlight, the world’s first smart debit cards for kids, recently compiled data from over 20,000 of their customers to determine which stores and restaurants teens are shopping at the most. This data is unique because it is reporting on actual teen purchasing behavior as opposed to survey data or an extrapolation of parents’ purchases.
Top Overall Merchants Kids Spend Money At (By Transaction Quantity)
- Mcdonalds (4 percent)
- Wal-Mart (3 percent)
- Google (2 percent)
- Microsoft (2 percent)
- Amazon (2 percent)
Top Restaurants Kids Spend Money At (By Transaction Quantity)
- Mcdonalds (16 percent)
- Starbucks (6 percent)
- Chick-Fil-A (5 percent)
- Subway (4 percent)
- Taco Bell (3 percent)
Top Categories Kids Spend Money At (By Transaction Quantity)
- Fast Food Restaurants (23 percent)
- Groceries (15 percent)
- Fuel / Gasoline (11 percent)
- General Retail (10 percent)
- Restaurant (8 percent)
To commemorate National Coffee Day, WalletHub released its report on 2017’s Best Coffee Cities in America. To determine the best local coffee scenes in America, WalletHub’s data crunchers compared the 100 largest cities across 14 key indicators of a strong coffee culture. The data set ranges from coffee shops, coffee houses and cafés per capita to average price per pack of coffee.
|
Top 20 Cities for Coffee Lovers |
||||||
|
1 |
Seattle, WA |
11 |
Philadelphia, PA |
|||
|
2 |
Portland, OR |
12 |
Minneapolis, MN |
|||
|
3 |
San Francisco, CA |
13 |
Oakland, CA |
|||
|
4 |
New York, NY |
14 |
Honolulu, HI |
|||
|
5 |
Los Angeles, CA |
15 |
Miami, FL |
|||
|
6 |
San Diego, CA |
16 |
Atlanta, GA |
|||
|
7 |
Chicago, IL |
17 |
Long Beach, CA |
|||
|
8 |
Denver, CO |
18 |
Austin, TX |
|||
|
9 |
Boston, MA |
19 |
Las Vegas, NV |
|||
|
10 |
Washington, DC |
20 |
Jersey City, NJ |
|||
Best vs. Worst
Miami has the lowest average price for a pack of coffee, $3.43, which is 2.3 times lower than in Honolulu, the city with the highest at $7.87.
Fremont, California, has the highest average annual spending on coffee per household, $185.00, which is three times higher than in Detroit, the city with the lowest at $61.29.
Gilbert, Arizona, has the highest share of households that own a single-cup/pod-brewing coffee maker, 21.1 percent, which is 2.9 times higher than in Hialeah, Florida, the city with the lowest at 7.3 percent.
New York has the most coffee shops, coffee houses and cafés (per square root of population), 1.0739, which is 45.5 times more than in Laredo, Texas, the city with the fewest at 0.0236.
Portland, Oregon, has the most coffee and tea manufacturers (per square root of population), 0.0180, which is 36 times more than in Riverside and San Bernardino, California, the cities with the fewest at 0.0005.
To view the full report and your city’s rank, click here.
Americans Love Coffee
While the convenience of on-the-go food and drink options is on the rise, it seems stopping by a coffee shop to grab a latte, mocha or cold brew coffee is still an essential part of the day for Americans. New research from Mintel reveals the US coffee house market continues to experience healthy growth with sales reaching an estimated $23.4 billion in 2017; a growth of 41 percent from 2011. Mintel forecasts coffee house sales will reach $28.7 billion by 2021. Although sales are heating up, the boom in new coffee shops entering the market is cooling down. The total number of coffee shops in the US is forecast to grow by just 2.17 percent this year, the slowest growth rate seen in the last six years*.

A potential threat to the coffee house market, ready-to-drink (RTD) coffee is the fastest growing segment (20 percent market share) of the $13.6 billion retail coffee market. The convenience and broad variety of flavors that RTD coffee offers prove to be popular as consumers increasingly seek out on-the-go and premium options. Mintel forecasts the RTD coffee segment will experience 67 percent growth from 2017-22.
“The coffee shop market is benefiting from shifting consumer interest in more premium, albeit pricier, coffee drinks such as specialty coffees, cold brew coffee and third wave coffee. However, the number of new coffee shops hitting the U.S. market is slowing, indicating sales growth is coming from increased consumer expenditure on these more expensive beverages rather than unit growth and expansion,” said Caleb Bryant, Senior Foodservice Analyst at Mintel. “We expect to see coffee shop sales continue on an upward trajectory over the next five years; however, increased competition from the ready-to-drink coffee category could pose a substantial threat. Ready-to-drink coffee is one of the fastest growing non-alcoholic beverages in the U.S.; it is convenient, comes in a variety of flavors and is oftentimes cheaper than specialty coffees at coffee houses. We also see many brands driving innovation in the category such as the emergence of nitro ready-to-drink coffees.”
Meanwhile, cold brew coffee continues to enjoy popularity in the U.S. with total U.S. retail sales of refrigerated cold brew coffee growing 460 percent from 2015-17 to reach an estimated $38.1 million this year. While cold brew at retail is on the rise, just seven percent of coffee drinkers say they have made their own cold brew coffee at home, with 11 percent agreeing cold brew takes too long to make.
Innovation may help persuade consumers to enjoy cold brew at home as one in eight (12 percent) are interested in roasts specially made for cold brewing coffee at home and one in 10 (10 percent) are interested in RTD nitro cold brew. What’s more, 13 percent of coffee drinkers over the age of 21 say they would be interested in alcoholic cold brew coffee.
“Despite the fact that cold brew has revolutionized coffee house menus and garnered increased media attention due to its popularity, the average consumer is not highly engaged with iced coffee or cold brew. This is likely due to consumers preferring to buy cold brew coffee at coffee houses and other foodservice retailers, as well as reserving cold brew coffee for the occasional treat rather than incorporating it into their daily routines. This highlights that while foodservice and retail coffee markets may be competitive, they are intertwined as consumers are typically exposed to new coffee products in foodservice, resulting in product development and innovation in the retail space,” said Megan Hambleton, Beverage Analyst at Mintel. “Innovations such as alcoholic cold brew could broaden usage occasions, driving more frequent consumption at night, and ultimately encouraging at-home consumption more often.”
Finally, the single-cup coffee market, while widely popular in recent years, is now slowing down as nearly one in five (17 percent) coffee drinkers agree single-cup coffee pods are bad for the environment and one third (34 percent) say single-cup coffee pods are expensive. These negative perceptions could be affecting sales given that retail single-cup coffee sales grew just 3.7 percent 2016-17 to reach $4.5 million, compared to 5.6 percent growth the year prior. Looking at the market overall, total retail sales of coffee in the US have slowed, with just 2.5 percent growth 2016-17, down from 2.6 percent growth the year prior.
“The overall retail coffee market enjoyed strong growth between 2012 and 2015, primarily driven by increased availability and interest in single-cup coffee and consumers buying single-cup coffee makers for their homes and offices. However, as market penetration of single-cup coffee makers has become more saturated and less people are purchasing new single-cup coffee makers, the segment has begun to stabilize, ultimately resulting in slowed growth of the coffee market as a whole over the last two years,” concluded Hambleton.
Restaurant Recruiting Changes
RestaurantOwner.com released the results of their 2017 Independent Restaurant Recruiting Survey. The report summarizes input gathered from over 400 independent restaurant owners and operators regarding their proven recruiting practices.
The days of the Help Wanted sign are numbered. Only a third (34 percent) of independent restaurant owners reported using signs placed in their restaurant to announce job openings. Instead, resourceful restauranteurs are turning to technology in their search for new talent, with 57 percent indicating that they use internet classifieds, 56 percent social networks, and 44 percent internet job sites in their search for new talent.
Despite technology-based solutions, word-of-mouth is still the best recruiting tool. An overwhelming majority (86 percent) of independent restaurant operators rely on employee referrals to find new team members. And when asked where they found the best employees, 48 percent responded with employee referrals.
Surprisingly, only 26 percent of respondents had a formal referral program. For independent restaurants that rewarded successful candidate referrals, employees typically earned $100 per referral once a referred candidate was employed for 90 days.
A positive restaurant culture (48 percent) was the most cited response to, “What’s the #1 reason people want to work in your restaurant?” Culture was more important than a desirable schedule (8 percent), the need for a job (10 percent), and even good pay/benefits (22 percent). Despite this, only 39 percent of respondents included information about their restaurant culture in job postings.
The two most cited hurdles currently faced by independent restaurant operators are a lack of qualified applicants (78 percent) and competition for employees (44 percent). Savvy restaurateurs shared that they overcame these hurdles with continuous recruiting, employee referrals, and by actively recruiting the employed.
A copy of the report is available here.
Distinct Attitudes and Behaviors of the First Native Digital Generation: Generation Z
IRI® announced initial findings from an ongoing study into the shopping attitudes and behaviors of Generation Z (aged 21 and under), providing manufacturers and retailers valuable insight into how to effectively communicate and activate with this new generation of consumers. Gen Z is just beginning to form their shopping habits, brand loyalties and purchase preferences, and as their influence and actual purchasing power grows, IRI’s findings show that manufacturers and retailers will need to adjust their marketing strategies to meet the distinct behaviors of this new generation.
“It is clear that Gen Z will be different from millennials and the generations before them on many levels — on top of being the most culturally diverse shopper population to date, Gen Zers are already forming unique purchase motivators and preferences,” said Robert I. Tomei, president of Consumer and Shopper Marketing and Core Content Services for IRI. “It will be critical for manufacturers and retailers to have a deeper understanding of these young shoppers as they gain influence and purchasing power, and leverage the power of personalization to reach them. With our sophisticated data-based solutions that consist of millions of shoppers and attribute-specific insights, IRI is uniquely positioned to help marketers activate against the diverse and powerful Gen Z market.”
The emerging research from IRI’s ongoing study helps describe the distinct characteristics that differentiate Gen Z from previous generations. Initial survey findings of those aged 14-21 include:
Brick & mortar holds its own against online. Gen Z sees both brick & mortar and online retailers being equally able to deliver the brands they want — a large product selection, low pricing and enjoyable shopping experiences.
Social media plays a far bigger role in influencing Gen Z purchase decisions than pricing or discounts. Gen Z is two to three times more likely to be influenced by social media than sale or discount pricing when making purchasing decisions, making them the only generation to be more driven by social media than price.
Ease of the shopping process has substantial influence. Gen Z is more likely than any other generation to choose a retailer based on how easy it is to find what they want, including millennials.
It’s not just a price game for Gen Z. The ability to find what they’re looking for in the store is as important in driving retailer choices as low prices.
IRI’s survey also found that as the first native digital generation, Gen Z expects to find savings at the touch of a button. While Gen Z is still not yet doing the majority of their own shopping, more than 25 percent of Gen Z members already engage with retailer apps for discounts and promotions, compared with 33 percent of millennials. These findings confirm the digital, social-centric shopper experience Gen Z will seek out, whether shopping online or in-store.
“One of the most interesting and compelling parts of Gen Z’s social media usage is related to how much they expect to be a part of the brand/retailer conversation. Our work with Gen Z to date suggests that they reject inauthenticity and being ‘marketed to,’ but they are not against marketing and advertising altogether,” said Lynne Gillis, principal of Survey and Segmentation for IRI. “What makes Gen Z different is they see and embrace the opportunity to be influencers, whether it’s among their own circle of friends or a broader audience. This has tremendous implications for how brands and retailers engage them in the marketing and advertising process.”
Meat Substitutes Market Growth
The global meat substitutes market was valued at USD 3.20 billion in 2013, and it is estimated reach USD 5.81 billion by 2022, with a CAGR of about 7.4 percent. The rise in demand for a healthy source of proteins and plant-based nutrients is the primary driving force of the market.
Growing health problems such as high blood pressure, heart disease, asthma, diabetes and increasing number of people suffering from obesity all around the globe have led to more and more number of individuals becoming health conscious. The increasing health concerns about consumption of meat coupled with several animal disease outbreaks in the recent past are the significant factors stimulating the growth of the global market. In the developing regions such as Latin America and Asia Pacific increasing standard of living due to the rising disposable income have propelled the meat substitute consumption. However, per-capita consumption of meat has experienced a decline, especially in developed regions of the world in the recent past.
Meat substitutes are mainly composed of ingredients such as wheat, soy, and others. Soy-based products are amongst the most popular ones and dominates the raw material segment; Soy products accounts for nearly four-fifth of the global market. The regional market such as North America and Latin America is expected to impact positively on growing soy production in these regions. The global soy production is dominated by countries such asBrazil, Argentina, and U.S. which serve half of the global soy demand.
Tofu, seitan, tempeh, TVP, Quorn, and other soy based and tofu-based products are the superior meat substitutes. Soy, mycoprotein, and wheat based are the main ingredients for this product. Textured vegetable protein (TVP) leads the global consumption market followed by tofu based products among all the other products. Other products occupy smaller sections of the markets.
In the past few years, Europe dominated the global meat substitute market followed by North America and Asia Pacific. Increasing soy production in the United States is projected to drive the regional market. Moreover, growing population in the developing regions of the world coupled with rising convenience food demand is expected to further expand the meat substitute market in the upcoming seven years.
Key industry players are investing in research and development activities to manufacture superior quality products as well as increase their product portfolio. Archer Daniels Midland produces TVP and dominates the global market accounting for more than half the market share. Partnerships and collaborations are the major strategies adopted by leading companies to stronghold their product offerings in the industry. Major market participants include Vbites foo Ltd., Morning Star Farms, MGP Ingredients Inc., Quorn Foods, Meatless B.V, Garden Protein Internationsl Inc., Amy’s Kitchen Inc., Cauldron Foods UK and Beyond Meat.
New California Wine Tourism
Results of a new online survey of more than 2,000 U.S. adults who recently visited California wine country were released today, offering insights to wineries and local wine associations in understanding and enhancing the experience of visitors to wineries and regions. Commissioned by Wine Institute with support from a USDA grant and conducted by Destination Analysts of San Francisco, the comprehensive survey offers a profile of the typical California wine country visitor statewide and by region and examines their awareness, interests and behaviors. Fielded in late 2016, the survey gathered responses from an equal number of visitors from out of state and within the state in recognition of the importance of in-state visitors to wine regions. A California wine tourist was defined as someone who had visited a California wine region for leisure within the past three years to capture both high-involvement and casual wine tourists.
Visitor Profile
The profile of the California wine country visitor is consistent with wine drinker demographics. The average age of visitors to California wine country is 43.9 years old, with Baby Boomers accounting for 39.5 percent, Gen Xers 21.9 percent and Millennials 36.1 percent. The majority of visitors are married (68.3 percent), resides in an urban (45.6 percent) or suburban (44 percent) area and are slightly more likely to be female (53.7 percent vs. 46.3 percent). California wine region visitors are well-educated and have higher incomes compared to the national average leisure traveler.
Wine Is Important to Lifestyle
More than 70 percent of California wine country visitors surveyed drink wine at least once a week with 36 percent drinking wine several times a week and nearly 20 percent imbibing daily. Nearly 60 percent consider wine “important” or “very important” to their lifestyles and see themselves as “very knowledgeable” about the beverage. About 30 percent have been a member of one or more wine clubs in the past three years, suggesting the potential for growth in wine club sign-ups but also serving as a reminder that while many wine tourists may not join clubs they do purchase wine from other outlets and recommend them to others based on winery visits.
High-End Travelers
Not surprisingly, California wine visitors highly value winery and restaurant experiences with three-quarters noting tastings, tours and food pairings at wineries to be “important” or “very important” and 70 percent identifying exceptional and interesting restaurants as a priority. Nearly 50 percent stayed in luxury hotels (48.3 percent four-star, 25.6 percent five-star) versus a national norm of about 15 percent staying in the equivalent of five-star properties. Visitors use a variety of resources in deciding which regions and wineries to visit and most often rely on word-of-mouth recommendations (62.3 percent) and general internet searches (43.9 percent). While most California wine region trips are driven by leisure vacations (32.6 percent) or weekend getaways (26.2 percent), nearly one in ten trips (8.5 percent) is an add-on to a business or convention trip.
Satisfied Visitors = Ambassadors
The vast majority of California wine visitors were highly satisfied with their trips and extremely likely to recommend the regions they visited to others. Over 70 percent of surveyed travelers preferred the California wine region they visited to out-of-state wine regions. About 73 percent found that the California wine region visited provided a “better” or “much better” experience. Residents from outside of the state gave the California wine experience higher ratings than those from California. Nearly 79 percent of travelers from other states gave a top score (8 or above on a 10-point scale), compared to 72 percent of Californians. Finally, visits to a wine region greatly increased the likelihood of purchasing wines from that region when travelers returned home, especially among out-of-state visitors (64 percent very likely to purchase).
Sources of Information
Word of mouth was by far the leading source of information (62 percent) for deciding what regions to visit, followed by general online search (44 percent), suggesting that social media and search optimization are very important communications channels for wineries and wine regions. Interestingly, wine magazines edged out travel magazines as an information source, while printed wine region maps came out higher than both (not everything has gone digital).
Regional Differences
The survey asked visitors to respond to a series of questions on regions they had visited in the past three years. Based on an analysis of responses, visitors to less well-known or remote wine regions of the state most closely mirror the high-involvement wine drinker versus visitors to more well-known regions. A higher percentage of visitors to lesser known regions regard wine as important to their lifestyles, are members of wine clubs and consider themselves knowledgeable about wine. This likely reflects both the dedication of high-involvement wine country visitors to seeking out new regions and a larger number of casual visitors to well-known regions – areas of opportunity for both wineries and regions.