
According to a Recent Study/Survey … End of October 2016 Edition
13 Min Read By MRM Staff
As part of our mission to be the go-to resource for on-the-go restaurant industry professionals, Modern Restaurant Management magazine (MRM) offers highlights of recent research. This end-of-October edition features news about the “Golden Hours” of service, the popularity of delivery services and Millennial marketing.
The ‘Golden Hours’ of Service
Balancing the art of dining with the science of running a business seems to be a never-ending duty. Timing—for both meal preparation and hours of business—is a top concern.
What is the best time to open?
To start cooking?
Is it worth it to invest in brunch service?
When are high volumes expected?
CAKE, a restaurant technology platform that uses information from their integrated POS and Guest Manager systems to track and analyze data, recently took a look at more than 2,000 restaurants with a combined revenue exceeding $100,000,000 to find the golden hour of service. Here’s what they found:
The Top Three Golden Hours:
- 7 – 7:59 p.m., which account for 11.49 percent of the total sales analyzed
- 12 – 12:59 p.m., which account for 10.54 percent of the total sales analyzed
- 8 – 8:59 p.m., which account for 10.27 percent of the total sales analyzed
Additional Findings:
- Morning sales accounted for 16.55 percent of revenue, while afternoon sales accounted for a whopping 83.45 percent of total revenue.
- The biggest single drop in sales comes after the lunch rush between Noon and 12:59 p.m. For the next four hours, average revenue continues to drop until the dinner rush begins at 5 p.m.
- The worst time to be open? That would be between 4:00 and 4:59 a.m., accounting for a mere .02 percent of total sales analyzed.
- During weekdays, average revenue on Thursdays is nearly double what it is on Mondays, indicating that folks begin the week with intentions of cooking at home, but tend to lose that motivation as the week progresses.
And regarding the never-ending debate about the value of opening for brunch, CAKE found that on the weekends, 21 percent of revenue came from morning and afternoon sales, while 79 percent of revenue came from evening sales. While the jury is still out on the final decision, CAKE can verify that during the weekends, dinner service seems to be more popular on Saturdays, while brunch service is more popular on Sundays. With regard to timing, the highest spike in brunch sales on weekends is at 1 p.m., while the highest spike for dinner sales is 7 p.m.
Downturn Continues
The downturn for most of the restaurant industry continued during September. Same-store sales were negative for the fourth consecutive month and chain restaurants endured another period of declining guest counts. Even restaurant job growth, which until recently had been posting solid gains, dropped considerably. This insight comes from data reported by TDn2K™ through The Restaurant Industry Snapshot™, based on weekly sales from nearly 25,000 restaurant units and 130+ brands, representing $64 billion dollars in annual revenue.
Same-store sales growth for September was -1.1 percent, a decline of 0.5 percentage points from August.
“The key driver behind the fall in sales during September was a decline in traffic, which continues to be the biggest challenge for chain restaurants,” said Victor Fernandez, Executive Director of Insights and Knowledge for TDn2K. “After improving slightly in August, traffic fell -3.5 percent in September. Traffic counts have fallen by at least -3.0 percent in four of the last six months.”
The third quarter of 2016, at -1.0 percent same-store sales growth and -3.4 percent in traffic, was the weakest quarter since the second quarter of 2010. Year-to-date results also present a sobering picture. Through September, 2016 sales growth was -0.6 percent, driven by a troubling -2.8 percent change in traffic. At the current pace, 2016 would be the weakest annual performance since 2009, when the industry was recovering from the recession.
Third quarter and 2016 results are, unquestionably, factors in the recent spate of organizational announcements. During the past few months, a number of bankruptcies have been reported, along with unit closures and executive changes. The industry continues to search for ways to revitalize traffic in an environment where general economic activity, including consumer sentiment, is relatively strong.
“The economy continues to expand at a pace that makes few happy,” commented Joel Naroff, President of Naroff Economic Advisors and TDn2K economist. “Still, job gains remain reasonable and the main reason the unemployment rate has not declined is that growing confidence in the ability to find a job has brought more people into the labor force. That is a normal pattern, but it was delayed in this cycle. Wage gains continue to accelerate and this is leading to more spending on everything, especially food. Indeed, when all eating and drinking establishments are accounted for, retail sales for the sector were up 6.4 percent for the first eight months of the year. That is much faster than the 2.9 percent gain for all retailers. Growth in sales at restaurants has slowed recently, but only modestly according to the government’s numbers. There is no recession in the sector as households continue to eat out.”
While comp sales remain negative, new restaurant units continue to be added, albeit at a slower rate. No doubt some of this might be attributed to real estate deals that were in place prior to conditions slowing. But, the unit growth points out that some segments and brands are finding success navigating the market turbulence.
Quick service is an example. QSR was the top performer based on same-store sales in the third quarter with growth of 2.2 percent. All other segments were negative (except upscale casual, which was flat). Besides growing sales in existing restaurants, quick service (the largest segment in the industry based on sales) also posted the highest total sales growth during the first half of 2016, growing at a rate of 4.7 percent year-over-year.
Regional Sales Results
The best performing region in the third quarter was California. It was the only region with positive sales in each quarter of 2016. California also had the largest absolute gain in year-over-year personal income for the second quarter, which likely translated into positive restaurant spending in recent months. The weakest region in the third quarter was again the Southwest, a distinction it has held for the last four quarters. Income growth seems to be a factor here as well. Of the four states included in this region, three (New Mexico, Louisiana and Oklahoma) are among the 10 states with lowest personal income year-over-year growth rate during the second quarter.
The Restaurant Workforce
After growing at an average 3.7 percent year-over-year during the first seven months of the year, the creation of new chain restaurant jobs has slowed down since July. The growth rate for August was a modest 0.7 percent, according to TDn2K’s People Report™. Even if this may alleviate some of the staffing pressures for restaurants, turnover rates for both hourly employees and restaurant management positions increased again during August. The industry has been experiencing an upward trend in its turnover rates for the last five years. Restaurant management turnover is now higher than it was before the recession for all industry segments and employee retention has been cited by most restaurant operators as one of their most critical challenges for 2016.
The People Report Workforce Index for fourth quarter predicts continued staffing and retention difficulties for the industry. Combined with the declining sales growth for many brands and segments of the industry, significant challenges are expected through the end of the year.
Delivery Has Room to Grow
Research from Mintel reveals that 87 percent of Americans who use third-party food delivery services agree that it makes their lives easier, and nearly one third (31 percent) say they use these services at least twice a week.
Despite impressive usage among third-party food delivery consumers, the industry is still relatively new as only 12 percent of Americans say that they have used a third-party delivery service in the past three months. Among non-users, three in 10 (30 percent) say that they would rather order delivery directly from the restaurant itself, citing concerns over price, as more than one quarter (27 percent) believe that delivery fees are too high. What’s more, some 23 percent of non-users say they live in an area where these companies do not operate.
Another barrier Mintel research highlights is that many Americans crave the experience of actually going to a restaurant: 28 percent of those who haven’t used a third-party delivery service say that they prefer to eat at a restaurant. Consequently, more than two thirds (65 percent) of restaurant delivery users agree that it’s more fun going to a restaurant than ordering in.
“Restaurant delivery is a hot market right now with many companies vying for the top spots. While usage today is low, it is important to note that the third-party delivery industry is still relatively new and low usage is to be expected, but it presents opportunity for growth. Those who do use these services tend to be Millennial men living in urban areas, indicating a need for these companies to attract a more diverse consumer base. Delivery cannot compete with the entire restaurant experience, but third-party companies can work at increasing the incidence of restaurant delivery by highlighting the benefits of having food delivered directly to the consumer,” said Caleb Bryant, Foodservice Analyst at Mintel.
Fifty-three percent of non-users age 55+ say nothing would motivate them to use third-party delivery services.
Americans who have not used a third-party restaurant delivery service say fast delivery (31 percent), restaurant selection (28 percent), low order minimums (27 percent) and first-use coupons (26 percent) would motivate them to try it. However, there may be no convincing the older generations, as more than half (53 percent) of non-users age 55+ say nothing would motivate them to use these services, compared to 11 percent of non-users aged 18-24 and one third (33 percent) of non-users overall.
Despite hesitation from some non-users, restaurant delivery users tend to have positive perceptions surrounding delivered foods as two thirds (63 percent) agree that it is more convenient to get delivery than dining out with a family. What’s more, three in five (61 percent) consumers say that restaurant delivery apps are easy to use, while over one third (34 percent) believe restaurant delivery is faster than picking up food themselves.
“Older consumers tend to dine out less frequently than other age groups. As such, these consumers may view going out to eat as a more special occasion, not as something to just have at home, while younger consumers tend to be very open to at least trying restaurant delivery services. Third-party restaurant delivery services must assuage consumer doubts and concerns over delivery by convincing them that online and mobile delivery are faster, more convenient options, and by offering deals and incentives to encourage trial. Additionally, as smartphone ownership has almost peaked, restaurant delivery companies must create apps that are easy to use and standout in app stores crowded with competing offerings,” continued Bryant.
56 percent of consumers have restaurant food delivered so they don’t have to leave their home.
Mintel research reveals that “dinner and a movie” is taking an untraditional spin as two in five (41 percent) consumers, including well over half (57 percent) of Millennials, say that they have restaurant food delivered so they can watch movies and TV shows at home. Adding to the perceived convenience factor of food delivery the leading reason restaurant delivery consumers have restaurant food delivered is so they don’t have to leave their home (56 percent). While some 39 percent of restaurant delivery users say that food delivery services allow them to enjoy restaurant-quality food at home, nearly three quarters (74 percent) agree that more chain restaurants should offer delivery, indicating potential future growth in the segment.
“While there’s no denying that Americans enjoy the dining out experience, we’re finding that more and more consumers want to enjoy their favorite restaurant meal in the comfort of their own home. This is creating opportunity for restaurants to offer delivery services or partner with a third-party provider. There may also be a marketing opportunity for third-party restaurant delivery companies to cross-promote with entertainment companies to engage those consumers who enjoy eating restaurant quality food in front of the TV. The key to expanding delivery services lies in addressing some of the top concerns among consumers, namely price, while also leveraging the existing positive feelings and perceived benefits of delivery to keep current customers engaged,” concluded Bryant.
What Teens Like
Piper Jaffray Companies completed its 32nd semi-annual Taking Stock With Teens research survey, which highlights spending trends and brand preferences amongst 10,000 teens across 46 U.S. states.Since the project began in 2001, Piper Jaffray has surveyed more than 140,000 teens and collected over 37 million data points on teen spending in fashion, beauty and personal care, digital media, food, gaming and entertainment.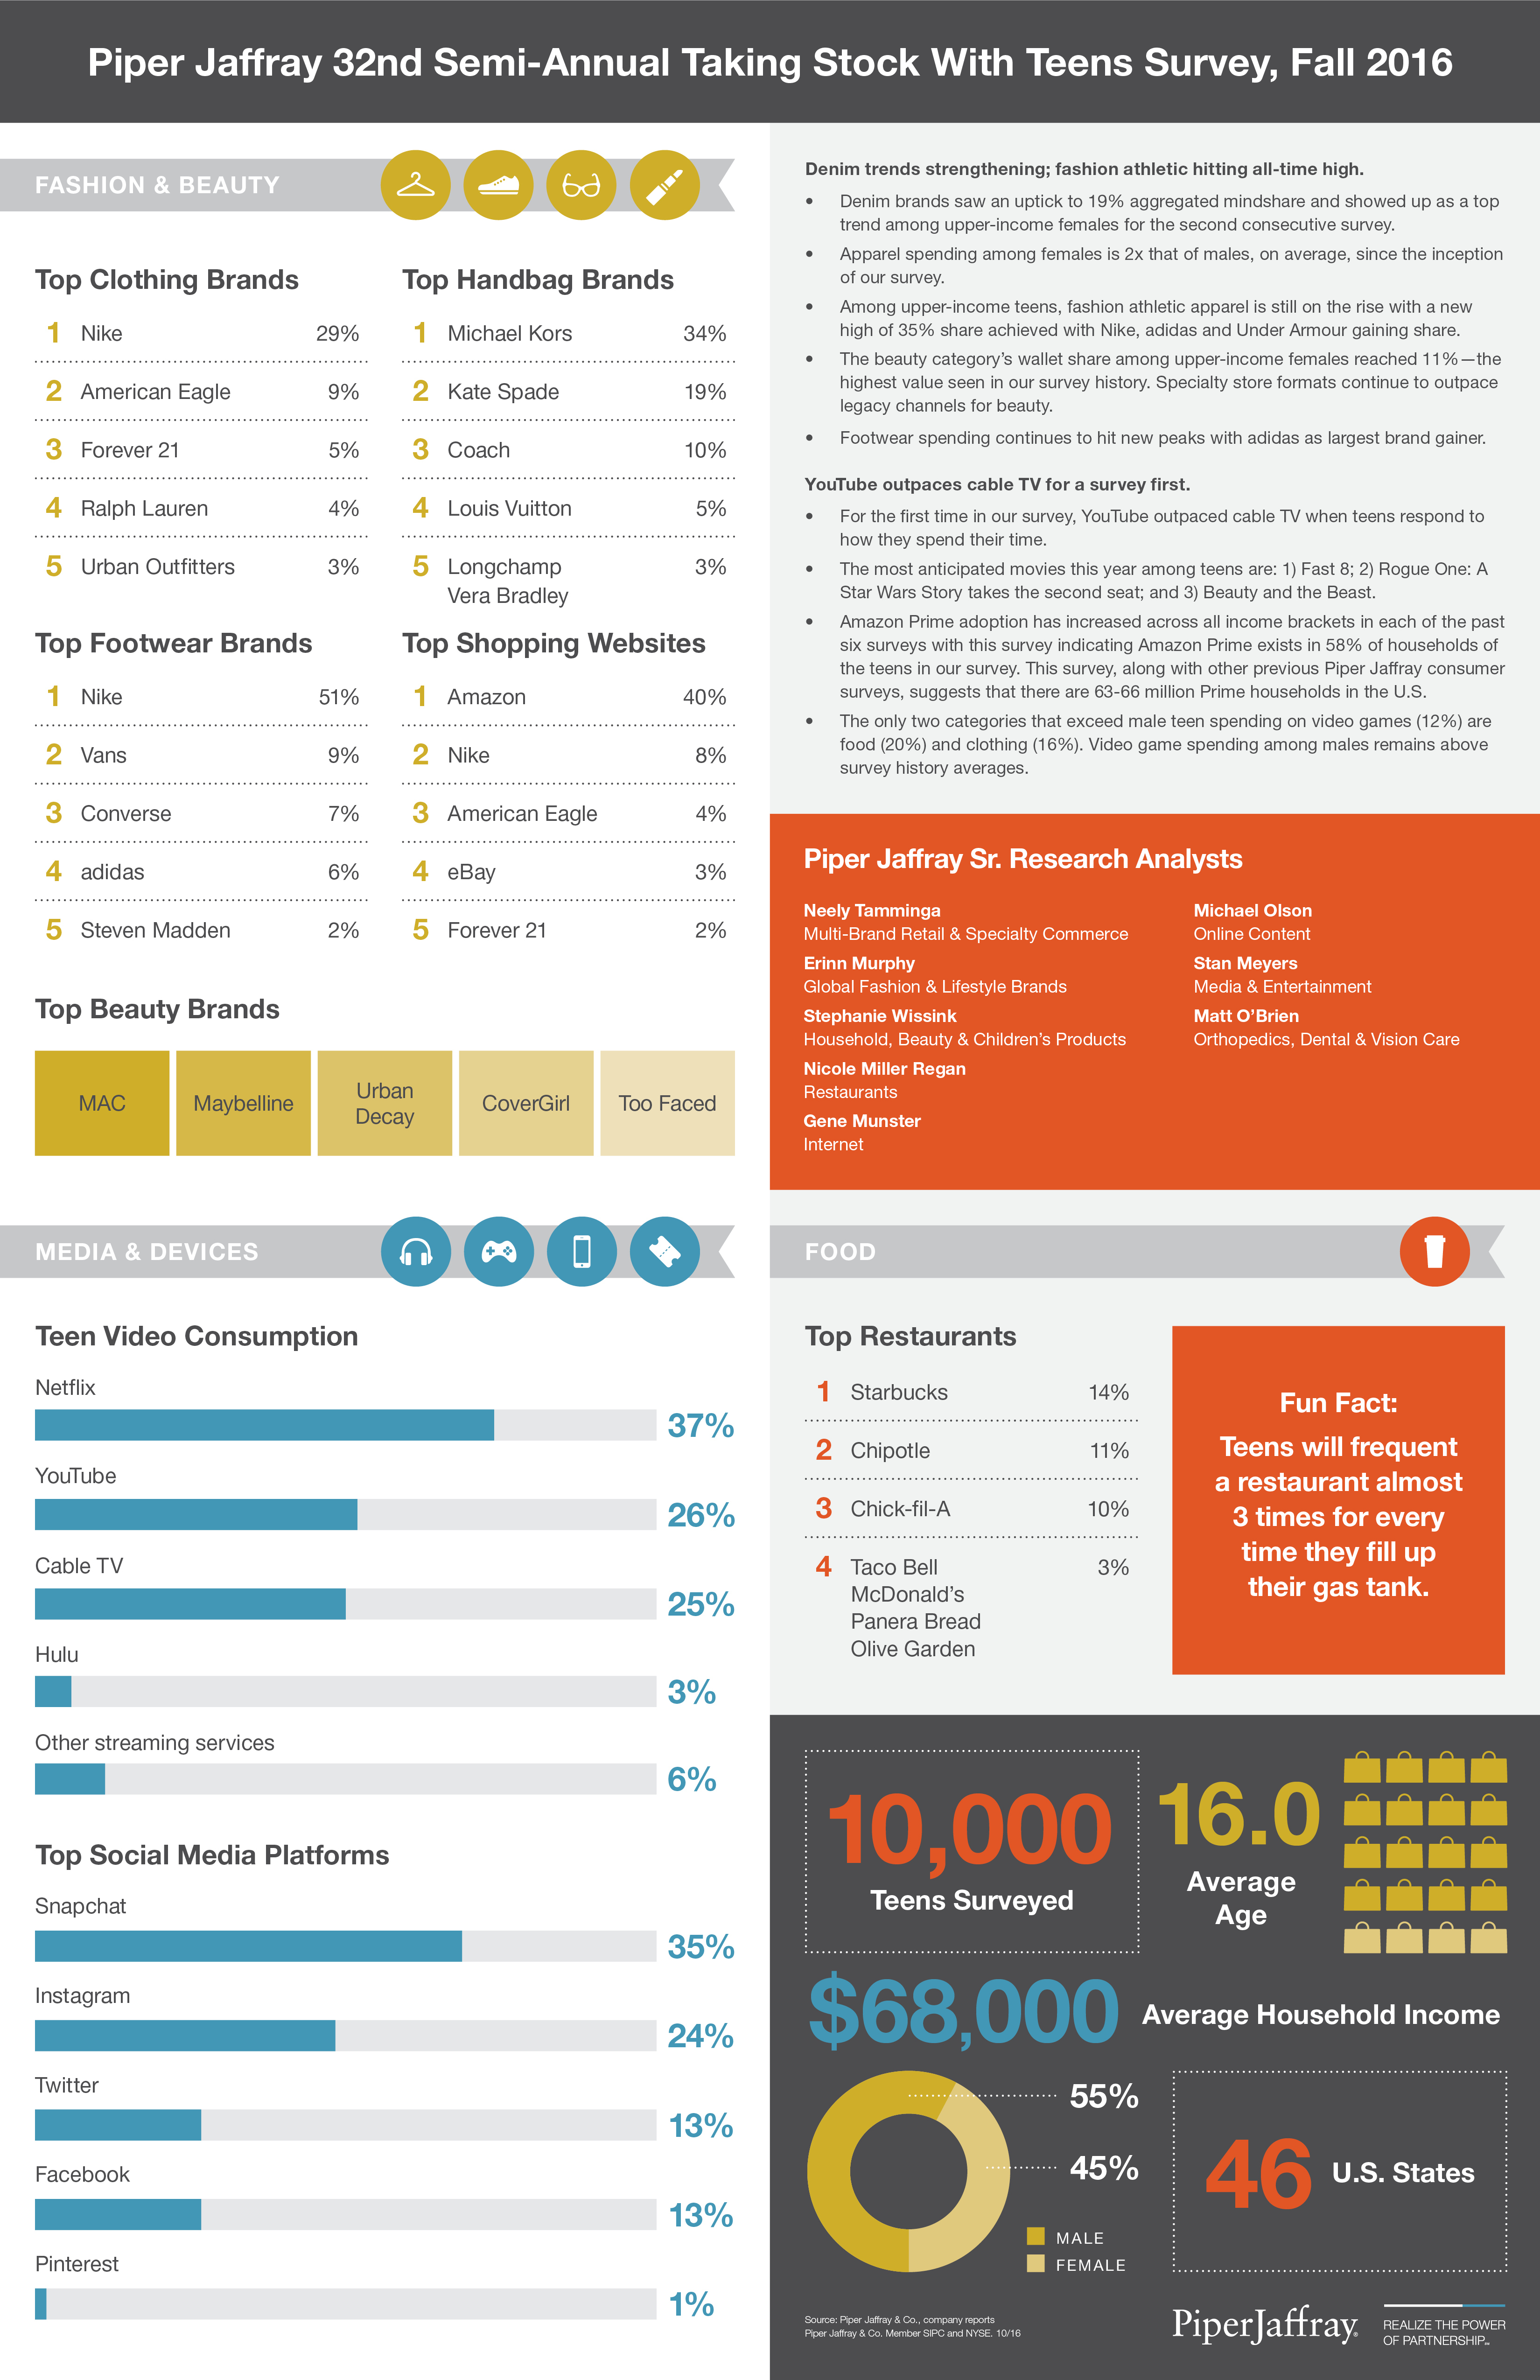
Restaurants represented 23 percent of overall spending for upper-income teens; teens are choosing limited-service concepts at nearly a 50 percent greater rate than full-service concepts. With that, teens consider the overall value equation versus price-alone when choosing preferred dining destinations, with the average check ranging from $5 to $17.
Millennial Marketing
Marketing to millennials does not have to feel like an abstract concept. In fact, brand stories are the emotional glue that connects spirits brands to Millennial consumers because compelling narratives appeal to Millennials’ desire to be “in the know” and also motivate them to share their discoveries, according to new research by MMWPR.
“The youngest Millennials come of legal drinking age this year, making this generation the most coveted group targeted by today’s beer, wine and spirits brands,” said JP Schuerman, President of MWWPR’s Western Region. “Given their proclivity for discovery and their preference for craft, it’s critical that spirits brands be wired into the emotional triggers and trust factors that drive Millennials to trial — and then inspire them to become advocates for their labels.”
Conducted through consumer surveys and bartender focus groups, the millennial marketing research found that 54 percent of Millennials share spirits-branded content posted by a social influencer, while 45 percent share editorial content posted on social media. In other words, marketing to millennials has the potential to further amplify SOV via earned media opportunities. Once Millennials have experienced a new spirit, they are most likely to share their discoveries on social media if influencers and/or traditional media outlets validate them.
“Influencer marketing and earned media ranked highest when it came to Millennials advocating on behalf of a brand via their social channels,” Schuerman said. “Millennials are protective of their online brands and require this third-party permission to discuss and endorse their spirits of choice. The earned hit is no longer the end result — it’s now the credibility spark that ideally ignites an integrated social push across trusted channels and among influencers.”
These results underscore why spirits brands looking to successfully strategize and execute millennial marketing campaigns must have a captivating and unique narrative that lends itself to third-party validation, which can then be shared via social media.
In fact, the MWWPR research found that this generation is more interested in brands with good stories to tell than how the products taste, and that more than one-third of Millennials are more likely to choose a spirit based on its unique history and tradition. In addition, over half (66 percent) of Millennials are more inclined to try craft or small batch liquor brands, which typically have captivating stories, rather than their “big brand” counterparts.
The results also revealed that this generation is highly motivated to try new brands and share their discoveries. Nearly all Millennials (93 percent) usually try a new liquor brand after someone recommends it to them, according to the study. The most trusted sources that drive Millennials to trial are friends, co-workers and bartenders, in that order. While each influencer group has a unique set of qualities that inspire trust, the findings show that authenticity and experience are always at the center of influence.
When it comes to advocacy, more Millennials share their brand affinities with one another.
Millennial Marketing: Spirits 101
- 90 percent of Millennials get excited when they discover a new liquor brand
- 66 percent of Millennials tell their close friends when they discover a new liquor brand
- 31 percent of Millennials share on social media after discovering a new liquor brand
Sports and Alcohol
For many Americans, watching certain sports and enjoying an adult beverage seem to go hand-in-hand. A recent Harris Poll asked legal drinking age Americans what alcohol beverage types they’re most likely to associate with various sports, and what they’re most likely to drink while watching and cheering on their favorite sports teams.
Some sports have a much higher association with alcoholic beverages than others. A majority of those who consume alcohol at least several times a year (“regular drinkers”) associate football (84 percent), baseball (78 percent), hockey (62 percent), car racing (66 percent), horse racing (62 percent), basketball (60 percent), and boxing (56 percent) with one or more alcoholic beverage types. About half associate golf (50 percent), soccer (48 percent), and beach volleyball (46 percent) with adult beverages, while just 4 in 10 do the same with tennis (42 percent).
When asked what type of adult beverage first comes to mind when thinking of 11 different sports, it’s no surprise that beer is the clear leader for sports like football (75 percent), baseball (70 percent), car racing (55 percent), and hockey (51 percent). Beer also tops the list, though to a lesser extent, for basketball (48 percent), boxing (39 percent), soccer (34 percent), beach volleyball (25 percent), and golf (17 percent). Following closely in second place for golf is spirits/liquor (14 percent). One quarter of regular drinkers associate horse racing first with spirits/liquor (25 percent), while wine tops the list for tennis (19 percent).
“There is no denying the concurrence of watching sports and enjoying an adult beverage. Given the surrounding business environment connected with professional sports, there is intense competition among those beverages to become that fan’s beverage of choice – whether that occasion be at a sporting event or watching that sport at home or elsewhere. Suppliers would be wise to know which sport(s) offers the best opportunities for their products, and which sports might require greater emphasis in order to elevate their products into the fan’s consideration set when they choose an alcoholic beverage,” said Danny Brager, Senior Vice President of Nielsen’s Beverage and Alcohol Practice.
Millennial Moms
According to ROTH Capital Partners, LLC’s 2016-2017 Millennial Mom Survey, its fifth annual proprietary survey examining current trends and spending patterns across five consumer categories including infant and juvenile products, food and grocery, dining and restaurants, healthy and active lifestyle, and apparel and accessories. The survey, conducted in partnership with Research Now, features 126 questions and was completed by 1,000 Millennial Mothers.
90 percent of Millennial Moms are comfortable with brands communicating with them via their mobile device while they shop in-store.
“Millennials are changing the rules on how brands connect with consumers. We’ve seen this disruption across multiple consumer categories and have seen valuation multiples increase for business models that address these changes”
Key findings from the ROTH Millennial Mom Survey include:
- A majority of Millennial Moms believe their economic status will eventually be better than their parents’
- 90 percent of Millennial Moms are comfortable with brands communicating with them via their mobile device while they shop in-store
- 59 percent of Millennial Moms are likely to write a review after visiting a restaurant
- About 50 percent of Millennial Moms are willing to pay a premium for socially responsible brands
- 36 percent of Millennial Moms trust local food brands the most
Sneaky Chefs
More people are consuming dairy and meat alternatives, and they are also getting sneaky by serving those plant-based alternatives to others without telling them, according to a study by Earth Balance.
The nationwide study of 2,000 consumers found that approximately one-quarter of respondents have served a dairy or meat alternative to friends and family without disclosing the swap, and most people who consumed the sneaky swap ended up enjoying the replacement, according to the home chef. Surprisingly, men are more likely to have acted as the sneaky chef, with 27 percent revealing that they’ve served up alternatives to unwitting diners vs. 22 percent of women.
Who Spotted the Swap? Apparently, the alternatives tasted a lot like the “real thing” to many friends and family members, with the study revealing that nearly half – 43 percent – failed to realize they were being served a dairy or meat alternative. Millennials and GenXers were the most perceptive when it came to identifying the substitution, while older generations had a harder time spotting it. Also, men were 11 percent more likely to spot it than women.
Whether they were on to the chef or not, the majority liked the alternative foods they were served. In fact, 74 percent of sneaky chefs reported that the people who ate the food alternative enjoyed it. Enjoyment levels were high across all generations, but the highest were among Gen Y and Baby Boomers – 80 percent of those 25-34 years old liked it, as did 77 percent of those 55 and older.
The study found that 55 percent of people have used substitutions or modifications when preparing their favorite recipes to try to make them healthier, and they’re often doing so stealthily with the hopes that their friends and family will discover and enjoy them, rather than dismissing the dish based on preconceived notions about taste and/or texture.
Not surprisingly, parents are some of the most stealth ingredient swappers. Parents of two-12 year olds were shown to be much more likely to substitute the “real thing” for what are often deemed as healthier offerings. Thirty-five percent of parents said they’d served an alternative dairy or meat product without telling the recipients, which is 10 percent higher than the overall average and 23 percent higher than non-parents.
Kids, though, may have a more discerning palette than expected. Sixty-one percent noticed what they were served wasn’t the “real thing,” which is 4 percent higher than the overall average. Being keen to the swap didn’t mean they like the food any less. In fact, kids’ enjoyment rates were still high (>72 percent) and close to the overall average.
Spill Factor
Americans are no strangers to spilling their drinks (and the embarrassment that comes with it), according to results from a nationwide survey from Contigo. Survey results revealed unexpected facts about America’s spilling habits and what they’d sacrifice to a avoid spills. Key findings from the survey include:
We’re a clumsy nation: Two in three U.S. adults have spilled a drink in the past year, and some generations sip more confidently without spilling than others. Over half (53 percent) of Millennials have admitted to a spill, compared to 35 percent of baby boomers.
We’d give up anything to go spill-free: One in five Americans would give up social media to be spill-free for a month.
Multitasking can lead to spills: One in three Americans that frequently spill are seen by survey respondents as trying to do too much at once, and 40 percent of Americans admit to spilling while in the car.
Sometimes we’d like to spill on certain individuals: If given the opportunity—and with no consequences —one in four working Americans would love to spill coffee on presidential candidates.