
According to a Recent Study/Survey … End-of-May 2018 Edition
31 Min Read By MRM Staff
This edition of Modern Restaurant Management (MRM) magazine’s “According to …” research roundup features a study on gluten free and allergen friendly lifestyles, Millennial dining trends, young Canadian dining trends, Americans’ cheesy preferences, egg trends, adventurous donut eaters and hot dog horrors.
Gluten Free and Allergy Friendly Lifestyle Trends
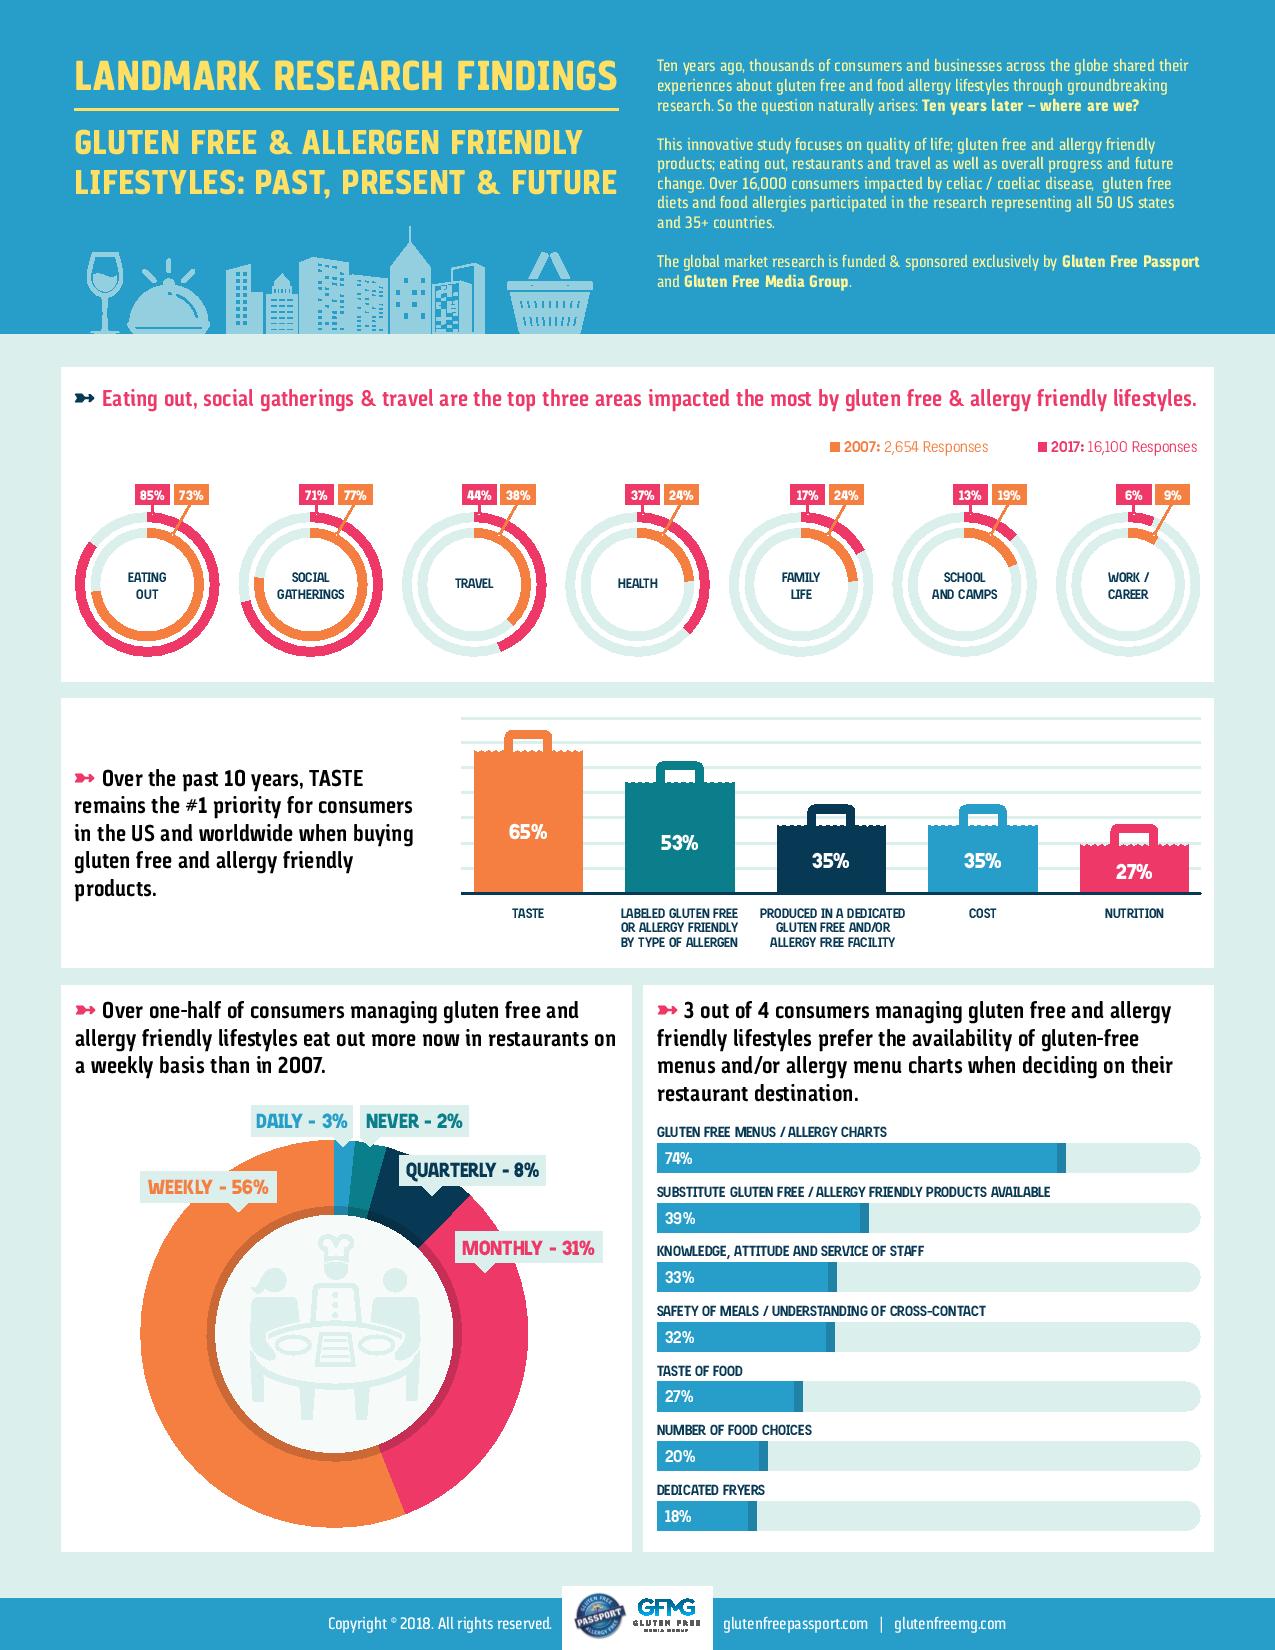
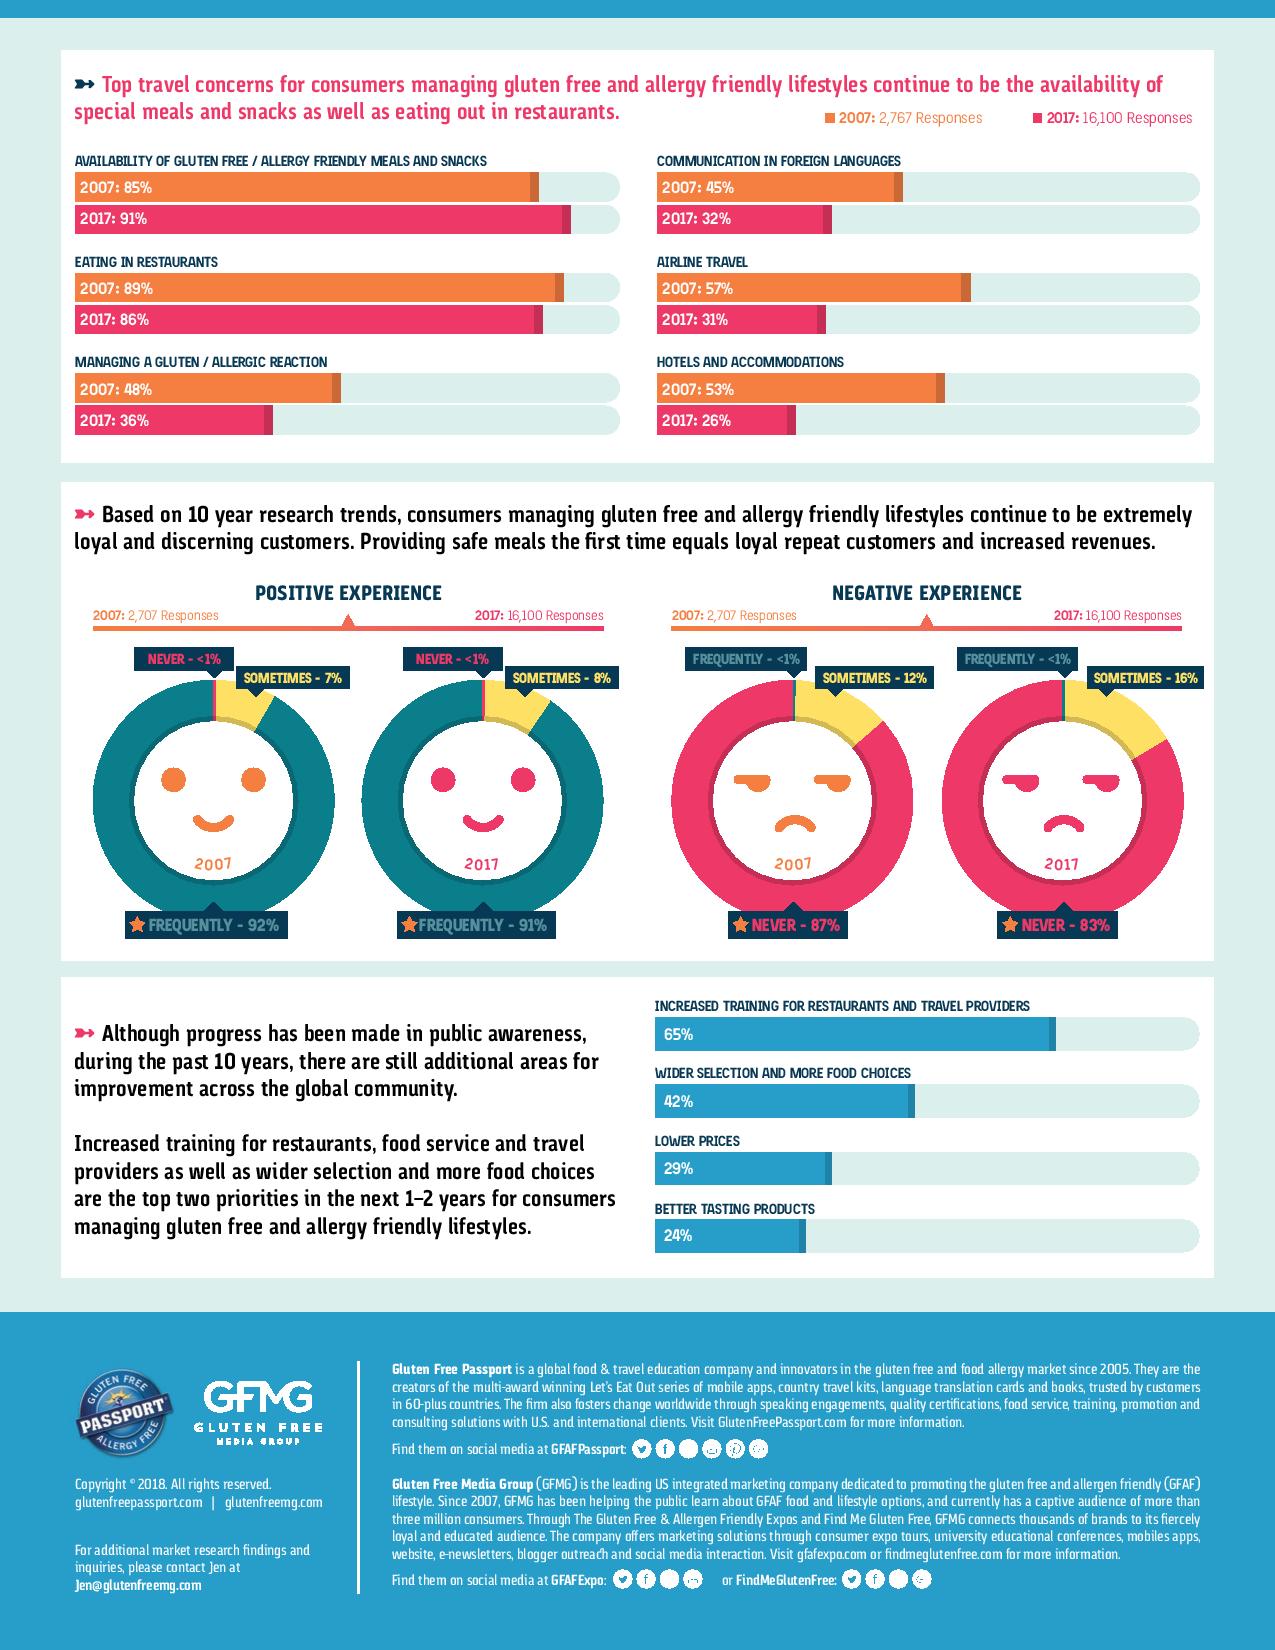
Ten years ago, thousands of consumers and businesses across the globe shared their experiences about gluten free and food allergy lifestyles through groundbreaking research. Now, Gluten Free Passport and Gluten Free Media Group teamed up and exclusively funded a follow up study, Gluten Free & Allergen Friendly Lifestyles: Past, Present and Future to see what has changed and where we are now in 2018.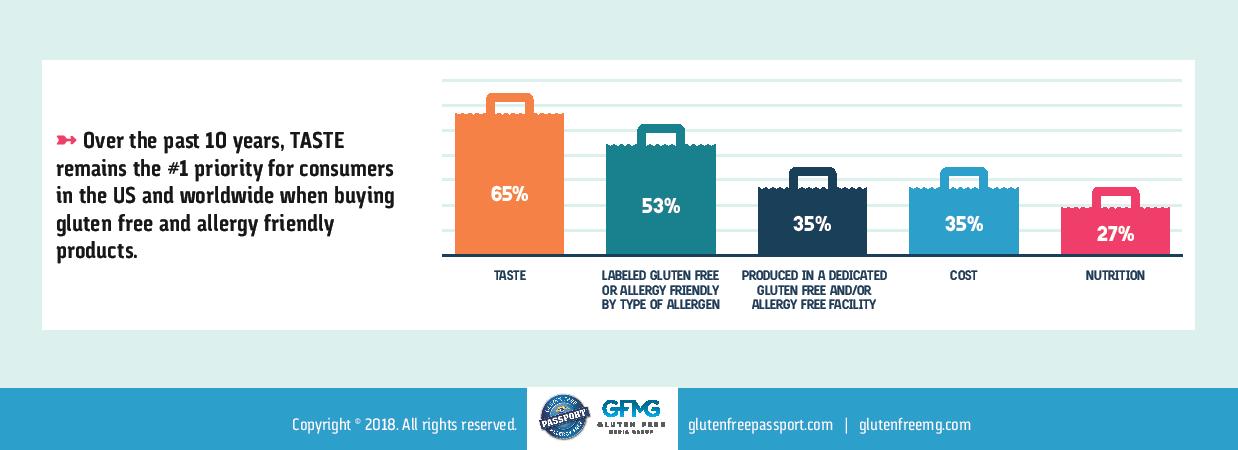
This innovative study focuses on quality of life, gluten free and allergy friendly products, eating out, restaurants and travel as well as overall progress and future change. Over 16,000 consumers impacted by celiac/coeliac disease, gluten free and allergy and food allergies participated in the research representing all 50 US states and 35+ countries.
Restaurant Payments Survey
Cayan released findings from their Restaurant Payments Survey, which identifies how restaurants should use payments to complement their dining experience and keep patrons satisfied. The survey polled 1,010 consumers nationwide, ages 18-65.
The first thing the survey found is that the frequency of dining out in 2018 is extremely high among all demographics. Eating out used to be more rare, often reserved for a special occasion; now, it’s become a regular activity, and not just for millennials.
75 percent of respondents to our poll eat out at least once a week, and almost half (47 percent) eat out at least three times a week. But today’s diners have more choices, whether it’s quick serve, fast-casual, sit-down, takeout, food trucks, or any number of other options. The competition is more intense than ever.
The Stats Are Clear: Payments Make a Difference
Because of this competition, every aspect of the dining process is being held up to greater scrutiny. Now, customer experience has become nearly as important as the food itself. And as people have begun to go out for food more often, they have developed strong preferences in areas like payments.
- More than half of respondents (58 percent) consider a restaurant’s payment technology important
- Almost a third of respondents (32 percent) said that they would reconsider where they dine based on the payment technology that the restaurant uses (or doesn’t use)
- Almost a third of respondents (32 percent) said that a payment incident has ruined a dining experience for them before
Speed and Security Matter Most
The stats show that customers care a great deal about payments. So, what matters most to them in the payments experience?
Nearly two-thirds (61 percent) said that they are most concerned with secure payments and processing. With all the breaches in the news recently, especially at some notable restaurant chains, this is not a surprising result. Customers want the peace of mind that comes with secure data, and a data breach can have huge financial consequences for a brand—just look at the stock of some of the chains that have suffered breaches recently.
For about a third of respondents (32 percent), the speed of the transaction is what’s most important to them in restaurant payments. It’s especially true as some diners have now seen new—but still rare—technology like pay at the table that drastically speeds up transaction and checkout speed. At sit-down restaurants, for instance, the traditional payment process in America has several steps as waiters go back and forth between the table and the register. In Europe, the process is far faster with pay at the table. The technology has not yet become widespread here in America, but it’s becoming clear that more and more diners want it.
Millennials Want Pay at the Table—And So Does Everyone Else
Millennials are not only the largest demographic in the United States, they also make up the largest population of diners. And that’s why they’re so crucial to restaurants. As a highly tech savvy generation, millennials, more than any other demographic, would like pay at the table to be available in more restaurants.
- Almost 72 percent of millennials would prefer to pay this way if it was available.
- Millennials also place a higher value on speed than other demographics—47 percent of millennials said speed of transaction is the most important aspect of restaurant payments, while only 29 percent of Gen X/Y said this, and 20 percent of boomers.
- But pay at the table is something that nearly every demographic is interested in. 69 percent of Generation X and Y would prefer to pay through pay-at-the-table, and 66 percent of boomers would prefer it.
While only six percent said it’s the most important aspect of payments, that may be because it remains rare in the United States. As adoption grows, it will likely be viewed as “table stakes.”
American’s Love Affair with Cheese
Americans love their cheesy foods. From the overall most popular pizza to mac-n-cheese to just plain cheese, a survey conducted by Bite Squad, the restaurant delivery service, reveals what cheesy foods Americans love most. The survey was conducted just in time for National Cheese Day, celebrated by cheese lovers across the country on June 4.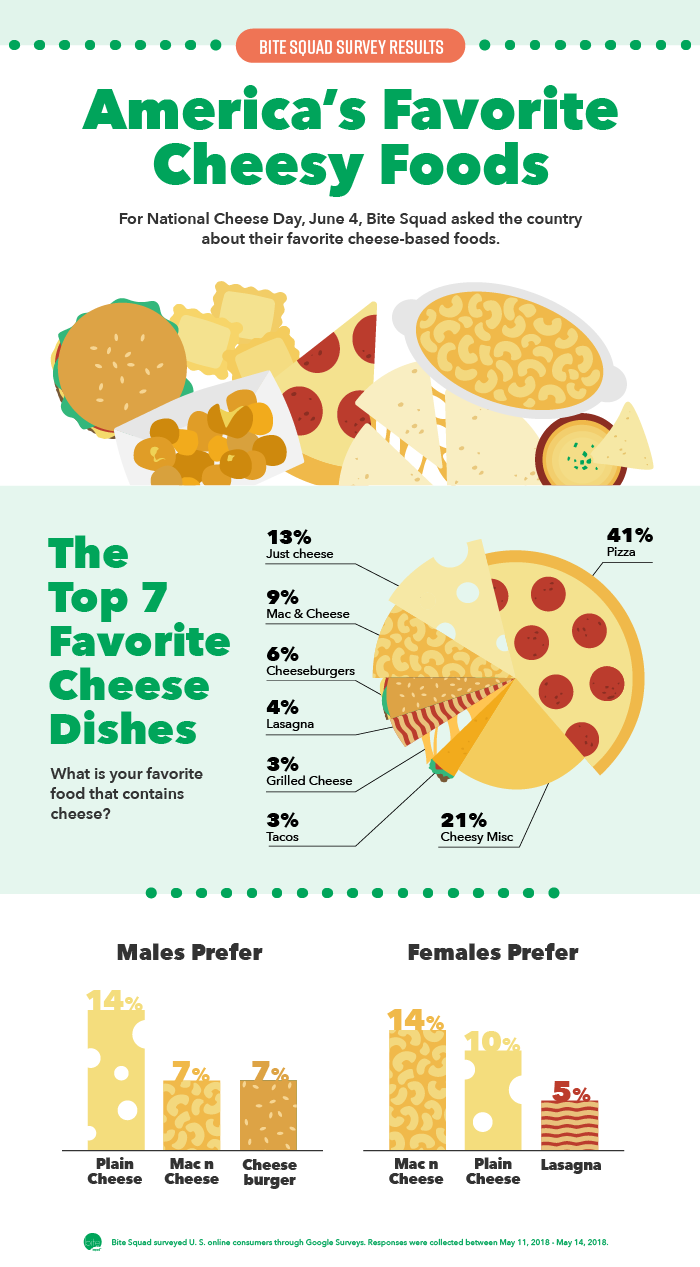
At the beginning of May, Bite Squad asked 2,500 Americans “What is your favorite food that contains cheese?” An overwhelming 41 percent of respondents answered pizza, while the second most popular answer was just plain cheese, at 13 percent. From there, macaroni and cheese, cheeseburgers, lasagna, grilled cheese and tacos rounded out the top seven.
“We’ve got a fountain of cheesy data flowing from our customers’ current order behavior” said Craig Key, Chief Marketing Officer at Bite Squad. “But we wanted to zoom out to see how cheesy dish preference changes from state to state.”
Using the survey data, Bite Squad took a closer look at what cheesy foods each state prefers most, after the top seven. Cheese dip is the big cheese, winning the hearts of Americans in 10 states. Enchiladas are a close second, with eight – mostly southwestern – states professing their love. Seven states have a sweet spot for cheesecake, matched by seven states that prefer a cheesy quesadilla. Most surprising? Florida likes a cheesesteak! And most predictable? Of course, cheese curds are well-loved in the midwest.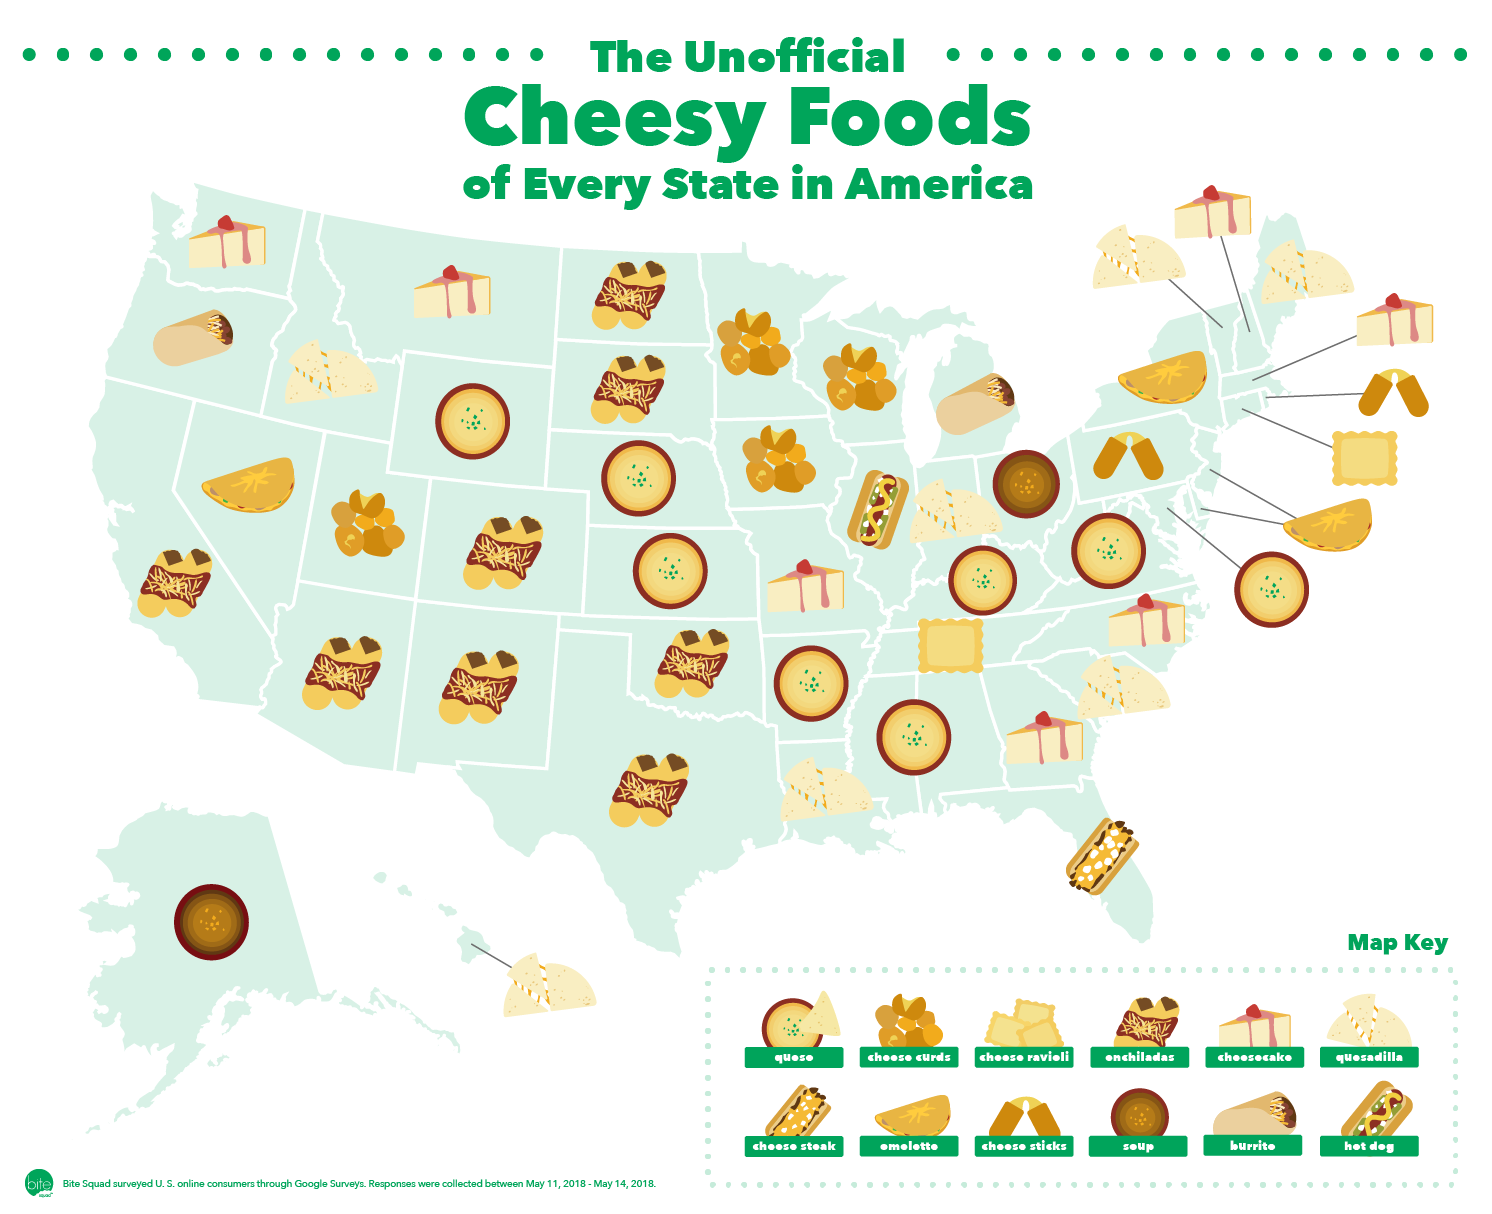
The company also analyzed internal data to determine the cheesy food dishes most ordered for delivery in 2018. Cheeseburgers top the list, followed by macaroni and cheese, cheese dip, cheese pizza, cheesecake, cream cheese wontons, cheesesteak, grilled cheese, cheese curds and quesadillas.
“We ranked our most delivered cheesy dishes in May compared to last year, and cheese dip is shredding it this year!” said Key. “I’m not sure if it’s because of the dip-pics we posted on the blog or what, but from beer cheese dip to Mexican queso to cheese and artichoke combos, this cheesy favorite is a rising star, jumping from the number 10 spot to number three.”
The data on cheese dip shows southern states may edge out the rest, Arkansas has more cheese dip orders than any other state. Tennessee holds second place for cheese dip delivery and South Carolina is in third place.
Bite Squad commissioned Brandish Insights to survey U.S. online consumers through Google Surveys about their favorite food containing cheese. The survey was completed by 2,560 respondents. Survey responses were collected between May 11, 2018 and May 14, 2018.
Independent Operators’ Spending Power
There is a flipside to the gloomy news about independent restaurants in the U.S., according to The NPD Group, a leading global information company. While the number of independent restaurant units in the U.S. dropped by three percent, 346,105 independent restaurants remained opened, which represents over half of the 647,288 commercial restaurant units in the U.S., based on NPD’s Fall 2017 ReCount® restaurant census. Independent commercial restaurant operators are forecast to spend about $39 billion with foodservice manufacturers and broadline foodservice distributors in 2018 and will represent 15 percent of total restaurant operator spend, according to NPD’s Foodservice Future Views, which sizes operator spend by foodservice markets and product categories.
Restaurant visits overall have been flat to declining for the last several years and visits to independent restaurants have declined by 2 percent over the last five years. In the quarter ending March 2018, independent traffic declined by 1 percent and total restaurant visits and chain traffic were flat compared to same period year ago. Still there were 60.5 billion total foodservice visits made in the year ending March and 13 billion of those visits were made to independent restaurants.
Another sign that there are independent restaurants doing well is that independent operators purchasing enough volume to order from broadline foodservice distributors have been increasing their spending and orders with broadline foodservice distributors. Independent operators, who represent a third of broadline foodservice distribution dollars, increased their purchases with leading broadline distributors by 2 percent and cases ordered by 2 percent in the quarter ending March 2018 compared to same quarter year ago, reports NPD.
“If restaurant chains are the backbone of the U.S. foodservice industry then independent restaurants are the heart because they are individuals who went into the business for the love of it,” says Warren Solochek, NPD’s senior vice president, industry relations. “Independent restaurant operators do face different challenges than chains since they have less resources and capital to withstand tougher
Top Consumer Choice Brands
Technomic announced the winning brands of the 2018 Consumers’ Choice Awards. Using combined research from two dynamic platforms—Transaction Insights and Ignite consumer brand tracking—the top-rated chains for the past year were revealed.
This award recognizes winners in five categories in three segments.
|
Quick Service |
Fast Casual |
Full-Service |
|
|
Best Takeout Experience |
In-N-Out Burger |
Five Guys Burgers and Fries |
Olive Garden |
|
Best Use of Technology |
Marco’s Pizza |
Panera Bread |
Red Robin Gourmet Burgers and Brews |
|
Most Loyal Customers |
Whataburger |
Raising Cane’s Chicken Fingers |
LongHorn Steakhouse |
|
Most Kid Friendly |
Chick-fil-A |
Newk’s Eatery |
Texas Roadhouse |
|
Consumer’s Choice – Best Overall |
Chick-fil-A |
Newk’s Eatery |
Fleming’s Prime Steakhouse & Wine Bar |
Award winners this year were identified based on data from two Technomic platforms: Transaction Insights and Ignite consumer brand tracking. Each platform tracks the performance of leading chains in unique ways.
Ignite consumer brand tracking measures guests’ experiences through ongoing consumer surveys covering the top 115 restaurant chains in the U.S. in terms of sales, along with additional chains to round out menu categories and capture regional data. This ongoing study represents responses from more than 100,000 consumers collected between April 1, 2017, and March 31, 2018. Learn more about the capabilities of Technomic’s consumer brand tracking via Ignite.
Transaction Insights reports restaurant brand-level sales performance, customer traffic and market share, derived straight from actual customer transaction data. Features of this program include actual transactions at the total check level; credit and debit card brands included in the data; longitudinal sample of 3 million consumers; more than 18 million monthly restaurant visits captured and statistically reliable data at the individual DMA and city levels. Learn more about Transaction Insights and its features.
Young Canadian Dining Trends
While traditional meals such as lunch (60 percent) and dinner (77 percent) are by far and away the most likely occasions Canadian diners* go out to eat, it seems the country’s youngest consumers are driving interest in non-traditional times for dining out. New research from Mintel reveals that diners aged 18-24 are the most likely to say they dine out for a late-night meal (35 percent vs 16 percent overall), a snack (30 percent vs 19 percent overall) and for brunch (22 percent vs 18 percent overall).
But while these younger diners are the most frequent visitors to restaurants, with two thirds (66 percent) saying they dine out at least once a week, the effects are weighing heavily on their minds and wallets. In fact, diners aged 18-24 are twice as likely as diners overall to say that eating out/ordering in impacts their ability to meet their financial goals (34 percent vs 17 percent overall) and a similar percentage say they feel guilty about how often they eat out/order in (36 percent vs 17 percent overall).
Despite any potential feelings of guilt or negative financial repercussions, it seems acting on impulse is driving them do to so as diners aged 18-24 are also the most likely to say they dine out/order in to satisfy a craving (55 percent vs 44 percent overall).
“Young Canadians are the driving force behind dining out for non-traditional meal occasions such as late-night meals and snacking, due in part to a need for convenience and as the result of young consumers turning to snacking as a ‘stand-in’ for traditional meals. This indicates the increasing importance for restaurants to promote non-traditional eating occasions to ensure relevance with younger audiences, especially as snacking represents a great opportunity to connect with these consumers,” said Carol Wong-Li, Senior Lifestyle and Leisure Analyst at Mintel. “However, younger consumers are torn between feelings of enjoyment when dining out and guilt over the cost and frequency with which they do so. As snacking can be a more cost efficient way for younger Canadians to dine out, offering snack opportunities at unique times of day is a good way for foodservice marketers to not only keep young diners interested, but to encourage them to enjoy their services with a little less guilt.”
Canada vs Quebec: Dining out for Different Reasons
As the economy grows stronger, dining out is on the rise, with more than half (54 percent) of Canadian diners today saying that they dine out/order in at least once a week, compared to 42 percent who said the same in 2016**. And it seems that dining out is increasingly being considered an indulgence as the top reasons diners say they dine out/order in is to treat themselves (58 percent) or as a reward (39 percent).
For Quebecers who dine out, it’s less about treating oneself and more about the social value of a meal as they are more likely than Canadian diners overall to say that the social aspect of eating out is important to them (42 percent vs 36 percent overall) and that the experience of eating out adds value to their lives (38 percent vs 33 percent overall).
All in all, Mintel research reveals that, across Canada, eating out is a way for consumers to escape from the norm as more than two in five (44 percent) diners say they dine out/order in to enjoy food they don’t prepare at home and one quarter (26 percent) do so to try new restaurants.
“Quebecers are more likely to see dining out as a social experience, suggesting that eating out is perhaps less of a special-occasion occurrence, but still a highly communal and personally meaningful one. This highlights a boon for foodservice vendors as Quebecers are likely to need less of a reason or excuse to go out to eat. Consumers from this region also tend to dine out more at traditional eating occasions than the average Canadian, which suggests that opportunities exist to grow cheques by offering the full-package deal of serving appetizers and desserts alongside entrées,” continued Wong-Li.
Young Canadian Women are More Adventurous Diners
While young, female diners aged 18-24 are dining out on a weekly basis (65 percent) nearly as often as their male counterparts (67 percent), it seems younger women show greater interest in a variety of dining out locations. In fact, young Canadian women are more likely than men the same age to say they have dined out at or ordered food from coffee shops (77 percent women aged 18-24 vs 60 percent men aged 18-24), food courts/halls (49 percent vs 35 percent), smoothie/juice shops (30 percentvs 20 percent) and bakeries (30 percent vs 22 percent).
“In today’s digital age, it is highly likely that the food and drink cravings of younger consumers are driven by their exposure to social media content. As discussed in Mintel’s 2016 Global Food & Drink Trend ‘Eat With Your Eyes,’ the high levels of social media engagement among younger generations are driving increased visibility of food/drink trends, highlighting the importance of ensuring retailers have ‘Instagrammable’ elements, whether it be rainbow-coloured drinks or black charcoal ice cream, that can draw the attention of young consumers,” concluded Wong-Li.
Small Business Hiring
The Paychex | IHS Markit Small Business Employment Watch for May shows a small increase in the rate of hiring and a slight decrease in the pace of wage growth. The Small Business Jobs Index grew for the first time since January, up 0.07 percent to 99.60. Job growth among small businesses is down 0.73 percent year-over-year, reflecting tightening labor markets. Hourly earnings grew $0.67 to $26.61, up 2.59 percent from last year. The pace of annual wage growth is down from its peak of 2.96 percent in June 2017, but one-month (2.80 percent) and three-month (2.86 percent) annualized hourly earnings growth continue to trend higher than the annual rate.
“The national index saw a slight improvement in May, its first since January, but remains below 100,” said James Diffley, chief regional economist at IHS Markit.
“It’s encouraging to see the jobs index increase for the first time since January. The modest rate of growth in small business employment reflects the continuing pressure of the tightening labor market,” said Martin Mucci, Paychex president and CEO.
May 2018 Paychex | IHS Markit Small Business Employment Watch
National Jobs Index
- At 99.60, the Small Business Jobs Index increased slightly in May, but is down 0.73 percent year-over-year.
- Reflecting tightening labor markets, the 12-month growth rate has been negative since March 2017.
National Wage Report
- Hourly earnings growth peaked at 2.96 percent in June, but has steadily decelerated to 2.59 percent in May.
- The three-month annualized growth rate improved to 2.86 percent, increasing for the sixth consecutive month.
- At 2.80 percent, the one-month annualized growth rate continues to trend higher than the annual rate, but reversed its path downward in May.
Regional Jobs Index
- Back over 99, the West had its best one month gain in more than a year, 0.21 percent.
- The Midwest was the only region to decrease in May, declining slightly (0.07 percent) to 99.75.
Regional Wage Report
- Decelerating further in May to 2.25 percent, the South is now the weakest region for hourly earnings growth.
- Though hourly earnings growth is only slightly higher in the Midwest, 2.29 percent, one-month and three-month annualized growth rates are both above three percent.
State Jobs Index
- With its third strong gain of 2018, Texas moved into first place among states with an index level of 101.09.
- Back to 100, Missouri jumped four spots in April and 10 spots in May, improving more than two percent in 2018.
State Wage Report
- Falling below one percent in May, Virginia is experiencing a quick drop-off in hourly earnings growth in 2018.
- Wage growth is slowing moderately in New York, but remains above three percent and near the top of the state rankings.
- Earnings growth in Illinois has picked up in 2018, averaging an $0.08/hour increase per month, compared to only $0.04/hour in 2017.
Metropolitan Jobs Index
- St. Louis is over 100 for the first time since 2016 and is ranked sixth among metros, its highest ranking in more than 10 years.
- Detroit jumped 0.41 percent in May and is back over 100 for the first time since May 2017.
- Houston continues to show strong improvement in small business employment growth, up 2.17 percent year-over-year and over 101.
Metropolitan Wage Report
- Topped by Phoenix, the Southwestern metros remain the leaders in wage gains.
- Seattle has both the weakest hourly earnings and weekly hours worked growth among metros. Ranked positively in 2017, wage growth has quickly lost momentum in Seattle during 2018.
Industry Jobs Index
- At 99.36, Leisure and Hospitality has trended below 100 since September, but had a solid 0.26 percent gain in May and remains the sector with the best performance compared to the 2004 base year.
- At 100.30, Construction has been above 100 for the past six years, signifying steady small business employment growth.
Industry Wage Report
- Near four percent, Leisure and Hospitality has had the strongest hourly earnings growth each month of 2018.
- Professional and Business Services has decelerated to 2.17 percent growth in May, ranking last among industry sectors in 2018.
- At 4.07 percent, Trade, Transportation, and Utilities leads weekly earnings growth among industries.
Teens Think About Food A lot
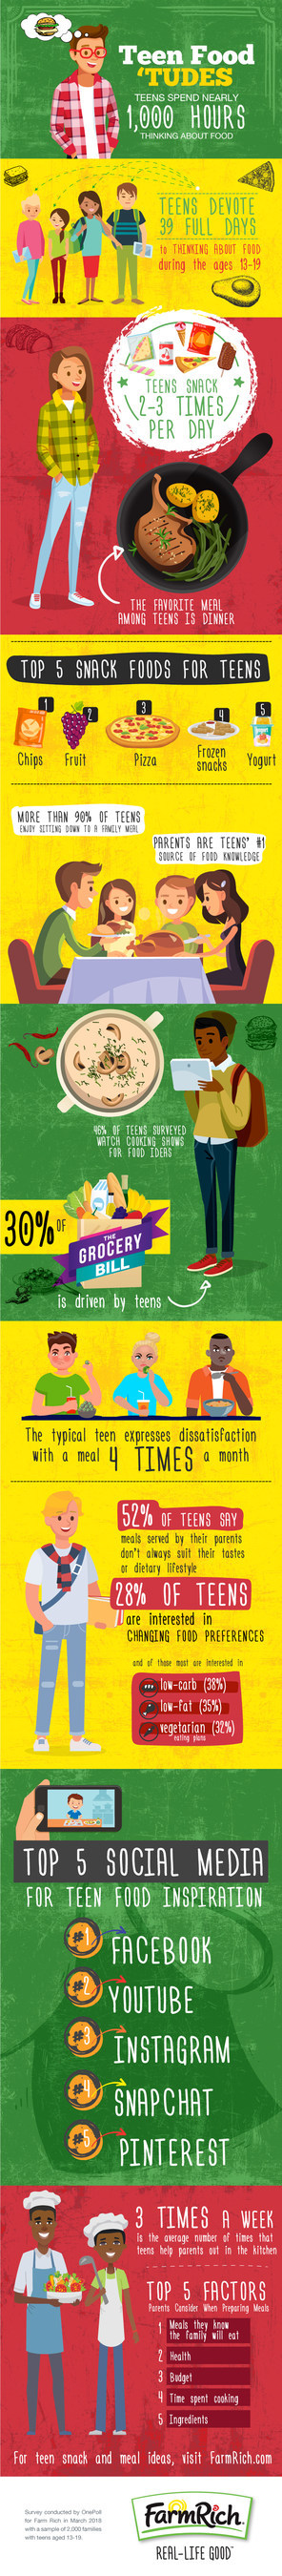
Today’s teenagers spend an average of 1,000 hours, or 39 entire days, thinking about food between the ages of 13-19. With the next bite always on the brain, this has led teens to become more involved in family shopping, meal planning and food routines.
A new national survey of 2,000 families with teenagers, ages 13-19, commissioned by Farm Rich, found:
- Teen palates are becoming more sophisticated, drawing inspiration from social media, parents and cooking shows
- Parents say 30 percent of the weekly grocery bill is driven by teens’ preferences and eating behaviors
- Teenagers snack 2-3 times per day
- The typical teen expresses dissatisfaction with a meal four times a month
- The favorite meal among teens is dinner
At Home & Online
While there are lots of sources for food inspiration, parents still play a key role in their kids’ understanding of food, and teens view food as more than just a means of satiating hunger.
- 7 in 10 say parents are their primary source for food knowledge
- 46 percent surveyed watch cooking shows for food ideas
- At 27 percent, Facebook is the largest social media source for culinary inspiration, followed by YouTube at 21 percent
- 20 percent of teens use cooking as a way to unleash creativity
The survey confirms that teens are on track to become the next generation of culinary creators, with about 25 percent saying they are experimental and adventurous in the kitchen, and willing to try unique and different foods. And 45 percent of parents share that their teens weigh in often on what should be included in mealtime menus.
A Moving Target
More than half of the teens surveyed say meals provided at home don’t always suit their preferences. Such attitudes have led parents to consider ‘Meals I know my family will eat’ as the most important factor when menu planning. And young people often move the goalposts – 28 percent have completely changed their diet, asking parents to switch up the menu.
- The most popular meal plans for teens are low-carb (38 percent), low-fat (35 percent) and vegetarian (32 percent)
- Teens complain about meals roughly 48 times per year
- They snack heavily between meals (2-3 times a day), including these top choices:
- Chips
- Fruit
- Pizza
- Frozen Snacks
Despite these changing diets and preferences, more than 90 percent enjoy sitting down to eat with the family, with dinner the favorite meal among 65 percent.
Family-Style
To keep the peace while minimizing wasted food, parents encourage teens to get involved in grocery shopping, asking them to pick out ingredients and by giving them a role in planning/preparation. With the average teen now helping mom and dad in the kitchen three times a week, there are strong indications that this generation of gourmands is here to stay.
“The parent-teen relationship will always have its challenges but involving teens in the process of meal planning and prep is a simple way to let them know they’re being heard,” says Shannon Gilreath, Farm Rich Director of Marketing. “Enjoying good food is a language we all speak, and it goes a long way in bonding families together, even during those tumultuous teenage years.”
The Teen Food Attitudes survey was conducted in March 2018 by OnePoll, with a sample of 2,000 families with teens.
Adventurous Donut Tasters
Dawn Foods, a global manufacturer and ingredients supplier to bakeries around the world, released findings from its inaugural Donut Day surveyithat found the majority of Gen Z (those aged 18-21) and Millennial (those aged 22-34) consumers (82 percent) are interested in trying unique and adventurous donut flavors, such as pickle-flavored donuts, sriracha and s’mores. For nearly 100 years, Dawn has partnered with bakers around the world to help them think outside the box and deliver original tastes and flavors to their customers. These bakers produce the world’s best donuts every day – including innovative new mashups such as grilled cheese donuts as well as beloved favorites like chocolate glaze and everything in-between.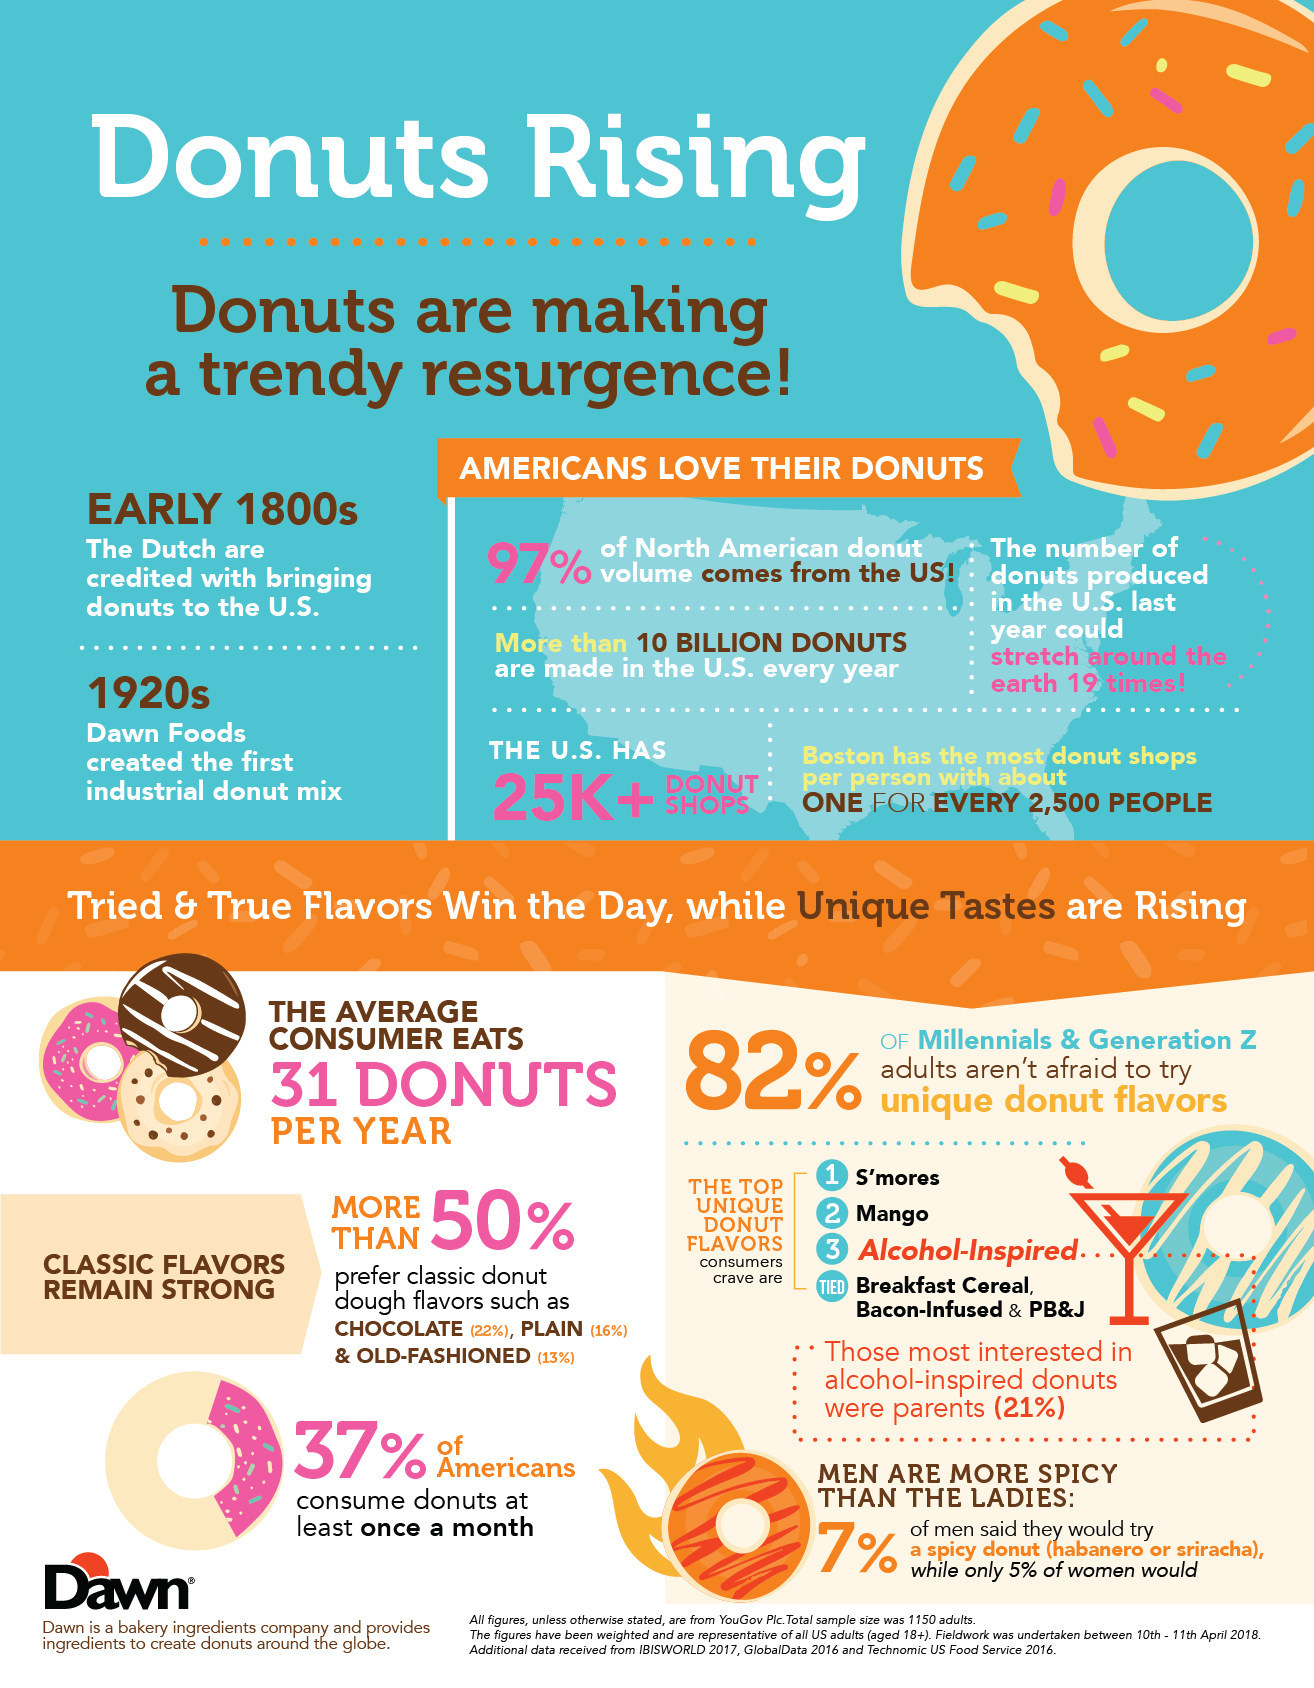
“Our company began in 1920 with the basics: two bakers and a recipe for delicious donuts and now, almost 100 years later, if you’ve ever had a donut in this country, you’ve likely tasted our ingredients,” said Angie Goldberg, Chief Marketing Officer, Dawn Foods. “As the popularity of this sweet treat grows, our team will continue to deliver the ingredients, inspiration and innovation needed to help our customers satisfy this demand.”
Tried & True Flavors Win the Day, While Unique Tastes are Rising
The top unique donut flavors all adults crave range from nostalgic S’mores and Peanut Butter & Jelly, to edgy flavors infused with alcohol and bacon:
- S’mores (29 percent)
- Mango (18 percent)
- Alcohol-Inspired (17 percent)
- Breakfast Cereal, Bacon-Infused and Peanut Butter & Jelly were tied with 16 percent
Additional survey findings include the following.
- Donuts are still a popular treat: More than a third of consumers (37 percent) eat donuts at least once a month
- Classic flavors remain strong: More than 50 percent prefer classic donut dough flavors such as chocolate (22 percent), plain (16 percent) and old fashioned (13 percent)
- Younger audiences are most likely to branch out: 82 percent of Millennials and Generation Z consumers are interested in trying new and unique donut flavors
- Parents prefer tipsy donuts: Those most interested in trying alcohol-inspired donuts were parentsii (21 percent)
- More adventurous palates are out west: West coast consumers are the most adventurous donut eaters, with 72 percent saying they’d try bold donut flavors
- Men are more spicy than the ladies: 7 percent of men said they would try a spicy donut (habanero or sriracha), while only 5 percent of women would
“Today, the options to delight consumers are virtually limitless,” said Goldberg. “Whether it’s National Donut Day or Friday at the office, we know donuts will continue to be enjoyed by consumers for years to come.”
For more information on the survey findings, click here.
Spice is Nice
New Jersey based Pereg Natural Foods asked its resident spice expert – Joy – to give us her take on the 25 spices every kitchen must have to spice up your life, your recipes and your palate. She also offers some storage tips and info on uncommon spices, too.
“It was hard to choose just 25 from among Pereg’s wide assortment of pure spices, but I whittled it down to 25 as the absolute must have spices for any kitchen,” said Joy, of Pereg Natural Foods. Here they are:
25 Spices Every Kitchen Must Have
- Ground Cumin
- Basil
- Cinnamon
- Bay Leaves
- Smoked Paprika
- Thyme
- Garlic Powder
- Oregano
- Onion Powder
- Rosemary
- Nutmeg Powder
- Red Pepper Flakes
- Coriander Powder
- Cayenne Pepper
- Ground Cloves
- Turmeric
- Curry Powder
- Yellow Mustard
- Cardamon Powder
- Cajun Seasoning
- Allspice Powder
- Chili Powder
- Ginger Powder
- Black Pepper
- Sea Salt
Storing Spices
No sauna’s please! When storing spices, your biggest enemies are: Air, Light, Humidity, and Heat. If you purchase spices in bulk, store them in an airtight container in the freezer. Store smaller quantities in a cool, dry place.
Some Uncommon Spices
Hilbeh – Also known as fenugreek, methya, menthya, vendayam, menthulu, uluva, uluhaal and methi. In Persia it is known as shanbalîleh. The name hilbeh is Arabic. It has a very light bitter and spicy taste (which might require getting used to). It is commonly used in Indian cuisine and is said to help improve digestion, increase libido, and treat hormonal disorders.
Sumac – The sumac bush, native to the Middle East, produces deep red berries, which are dried and ground into coarse powder. Less commonly, the berries may also be sold whole. Ground sumac is a versatile spice with a tangy lemony flavor, although more balanced and less tart than lemon juice. A small sprinkle also adds a beautiful pop of color to any dish. Sumac is one of the main components in the spice mix za’atar. It’s great over vegetables, grilled lamb, chicken and fish. Ground sumac also makes a nice, flavorful topping on dips like hummus.
Sumac has been used across the globe for its medicinal properties and uses. Research has shown that health benefits of sumac are many, as it is naturally anti-fungal, anti-microbial, anti-oxidant and anti-inflammatory.
Luisa Leaves – Luisa is sold under several names, the most common being lemon verbena. It can be found as prepared tea (bags), as loose tea, and as dried leaves. Luisa is believed to help one relax, aids in digestion, soothes menstrual pains and cramps and aids in kidney function. The leaves are used to add a lemon flavor to fish and poultry dishes, vegetable marinades, salad dressings, jams, puddings, Greek yogurt and beverages. It also is used to make herbal teas, or added to standard tea in place of actual lemon (as is common with Moroccan tea). It can also be used to make a sorbet.
Some of the most expensive spices include saffron, machlab (common in Syrian cuisine), nutmeg, mace, cardamom, cloves and several types of pepper.
Eggs on Trend
Eggs are the menu-maker’s best friend, especially when they can be turned into unique, premium signatures that reach beyond the breakfast daypart. In the new report Eggs: Culinary Trend Tracking Series market research firm Packaged Facts highlights nine egg-tastic innovations sweeping foodservice and restaurants across America:
- Chilaquiles and Migas (Hispanic breakfast egg dishes) – Mexican breakfast specialties are no longer just for Mexican restaurants or Hispanic marketplaces—though these remain a good place to enjoy them. Adding or subbing in artisanal proteins, next-level sauces and salsas, and riffs on the traditional tortilla puts an upscale, cheffy spin on migas and chilaquiles, but other familiar Mexican and Hispanic specialties can take an egg and be converted into adventurous breakfast fare.
- Deviled Eggs – The classic party and picnic food is all grown up and getting cheffy, with variations ranging from down-and-dirty pickle relish and mustard to ultra-chic with caviar and smoked salmon. Think of this take on the egg as a great canvas for innovation in venues as varied as pubs and casual restaurants, or as a self-assured comfort food in fine dining.
- Eggs Benedict – Increasingly inventive guises for omelets opened the door for Benedict experimentation, especially now that the breakfast and brunch dayparts are getting more creative attention.
- Frittatas – Frittatas have been riding a mainstreaming wave of more authentic Italian menu items, along with the push to all-day breakfast innovation beyond omelets. Quiche-like frittatas are suitable for casual and family-style restaurants and more upscale lunch menus, as well as in quick-service restaurant sandwiches.
- Meringues – For something made from leftovers, meringue can inspire a lot of innovation. As long as the egg whites can be stabilized, they can be flavored with a whole pantry full of ingredients, with both sweet and savory personalities—which makes them a creative favorite of both the pastry and the salty/spicy sides of the kitchen.
- Okonomiyaki Japanese Pancakes – Fascination with Japanese izakaya (pub) fare has brought okonomiyaki to the American public, in the form of small plates and Millennial-friendly global fast casuals. Much like frittatas, okonomiyaki can be used to showcase seasonal or specialty ingredients, repurpose overproduction, star as a daily special, and keep a rein on food costs.
- Shakshuka (Middle Eastern poached eggs in savory sauce) – Beloved by bloggers, breakfast fans and healthy eaters (including vegetarians), this egg specialty is showing up on restaurants menus coast to coast, thanks to the Middle Eastern restaurant trend and trendy brunch dining. Packaged Facts notes that as a restaurant phenomenon, shakshuka and other saucy poached egg specialties are in their infancy, but restaurateurs can act now to help set the next big trend for an egg dish already on the foodie radar.
- Sous Vide/Slow-Cooked Eggs – Sous vide and other slow-cooked eggs are favorites in chef-driven restaurants, and Starbucks’ sous vide eggs bites, introduced in 2017, helped propel sous vide into mainstream consciousness. Sous vide and other slow-cooked eggs have been embraced by chefs with a penchant for immersion circulators and other “techy” cooking styles, with a boost in popularity from traditional Japanese specialties like ramen and the desire to showcase locally sourced eggs. They’re also much easier to make than the poached eggs they’re replacing in items like frisee salads.
- Egg Yolks – The egg yolk has long been a powerful, versatile traditional culinary tool as an emulsifier in sauces, in baking and desserts, and in pasta dough, among many other uses. But taking the Millennial mantra of “put an egg on it” another step, egg yolks are now adding a final flourish to all kinds of creative foods.
As Packaged Facts notes, each of these egg specialties is super-adaptable, playing well with scads of other ingredients, from breakfast to late-night, and for carnivores and vegetarians alike.
“Eggs have always been a restaurant and home kitchen workhorse, but they have garnered new levels of respect,” says David Sprinkle, research director for Packaged Facts.
As part of its examination of eggs, Packaged Facts also identifies key trend drivers propelling retail food and culinary trends. Many are likely familiar to marketers, brand managers, and consumer trend specialists who are tracking what is compelling to consumers and motivates them to purchase and consume certain foods and beverages, and to replace one menu selection or packaged product with another. These drivers align with core consumer values to be tapped for menu and new product development. Menu and retail trend translation tips included in the egg profiles provide detailed ideas and suggestions on how these culinary trends can be used to generate well-fed customers and business growth.
TripAdvisor’s Most Excellent
TripAdvisor®, the travel planning and booking site, today announced the “Most Excellent” global tourism destinations that have the highest percentage of TripAdvisor Certificate of Excellence recipients. Now in its eighth year, the Certificate of Excellence is given to accommodations, restaurants and experiences that deliver great service and consistently achieve high traveler reviews on TripAdvisor.
“TripAdvisor is the place consumers go to plan and book their trips, and study after study has shown the site’s impact on travel purchasing decisions,” said Neela Pal, vice president, brand marketing, TripAdvisor. “When travelers see a Certificate of Excellence sticker or certificate on display, they immediately know that the business has a track record of offering highly rated guest or diner experiences. Now, with our ‘Most Excellent’ lists, we’re excited to reveal the destinations where travelers are most likely to encounter these excellent businesses.”
TripAdvisor determined which destinations had the highest percentage of Certificate of Excellence recipients across the following categories:
MOST EXCELLENT CITIES
|
“Most Excellent” Cities Overall |
|
1. Key West, USA |
|
2. Reykjavik, Iceland |
|
3. Edinburgh, UK |
|
4. Marrakech, Morocco |
|
5. Amsterdam, The Netherlands |
|
6. Dublin, Ireland |
|
8. Krakow, Poland |
|
9. Glasgow, UK |
|
10. New Orleans, USA |
|
“Most Excellent” Cities for Restaurants |
|
1. Key West, USA |
|
2. Reykjavik, Iceland |
|
4. Cabo San Lucas, Mexico |
|
5. Venice, Italy |
|
10. Krakow, Poland |
|
“Most Excellent” Cities for Experiences |
|
1. Punta Cana, Dominican Republic |
|
2. Cabo San Lucas, Mexico |
|
3. Playa del Carmen, Mexico |
|
4. Benidorm, Spain |
|
5. Reykjavik. Iceland |
|
10. Tenerife, Spain |
|
“Most Excellent” Cities for Accommodations |
|
1. Chicago, USA |
|
2. Stockholm, Sweden |
|
3. Munich, Germany |
|
4. San Francisco, USA |
|
5. Singapore |
|
10. Taipei |
MOST EXCELLENT COUNTRIES
|
“Most Excellent” Countries Overall |
|
1. Iceland |
|
2. Ireland |
|
4. Greece |
|
5. Morocco |
|
6. France |
|
8. Italy |
|
9. Portugal |
|
10. Belgium |
|
“Most Excellent” Countries for Restaurants |
|
1. Iceland |
|
2. Greece |
|
3. Ireland |
|
5. Portugal |
|
6. France |
|
7. Italy |
|
8. Spain |
|
10. Hungary |
|
“Most Excellent” Countries for Experiences |
|
1. Iceland |
|
2. Greece |
|
3. Mexico |
|
4. Portugal |
|
5. Morocco |
|
6. Vietnam |
|
8. Brazil |
|
9. Thailand |
|
10. Chile |
|
“Most Excellent” Countries for Accommodations |
|
1. Singapore |
|
3. Morocco |
|
4. Iceland |
|
5. Ireland |
|
7. Australia |
|
8. Greece |
|
9. Canada |
|
10. Indonesia |
Certificate of Excellence Methodology
Certificate of Excellence winners were selected using a proprietary algorithm that takes into account the quality, quantity, and recency of user reviews, as well as the business’ tenure on the site. Recipients must maintain an overall TripAdvisor rating of at least four out of five, have a minimum number of reviews and have been listed on TripAdvisor for at least twelve months. A business must be listed for the full 12-month qualifying period between April 1 to March 31 to be considered. Recipients are announced only once a year in late May.
“Most Excellent” Methodology
“Most Excellent” cities and countries were calculated as a percentage of businesses listed on TripAdvisor that received a Certificate of Excellence recognition within that destination during the qualifying period. Cities must have had a minimum of 1,000 businesses (i.e., accommodations, restaurants, experiences) listed on TripAdvisor. Country markets must have had a minimum of 5,000 businesses listed on TripAdvisor.
Small Business Tax Survey
In a new survey of 1,000 small business owners, LendingTree found the majority of small business owners (65 percent) expect to see savings as a result of the new tax law, and most plan to use that savings for business debts. The survey was conducted via Google Consumer Surveys March 29-31.
Here’s what they found:
Only 15 percent of business owners plan to pass tax savings onto their employees while most plan to tackle business debt
When asked what they plan to do with their tax savings, more than one-third (35 percent) of respondents said they would pay down debt.
More than a quarter said they don’t plan to use tax savings to change anything within their business, while only 15 percent said they would increase wages and benefits. Nine percent said they would increase non-wage expenses. Just 7 percent would use the extra funds to hire more employees.
It’s hard to blame business owners for earmarking their tax savings for debt. Nearly half of the small business owners we surveyed (46 percent) said they have business-related credit card debt. Of those with business debt:
48 percent carry debt on a personal credit card
27 percent carry debt on a business credit card
25 percent carry debt on both personal and business cards
27 percent of small business owners relied on debt to cover their start-up costs
While more than half (55.7 percent) of small business owners tapped their personal savings to start their business, roughly one-quarter (27 percent) relied on debt.
Among owners who borrowed funds for start-up costs, about 12 percent took out a business loan, 7.5 percent used credit cards, 6 percent used a personal loan and 1 percent used a home equity loan.
The majority of start-up costs are under $10,000
The good news is their funding needs weren’t so great that any decent-sized nest egg would be put at risk.
More than half of business owners who responded to the survey said they started with less than $10,000. For the majority of entrepreneurs, their start-up costs didn’t exceed four figures:
Less than $5,000 – 44.7 percent
$5,000 – $9,999 – 15.3 percent
$10,000 – $24,999 – 11.6 percent
$25,000 – $49,999 – 7.7 percent
$50,000 – $99,999 – 7.6 percent
$100,000 – $249,000 – 6.4 percent
More than $250,000 – 6.8 percent
Nearly 80 percent of small business owners don’t have a six-month emergency fund
It’s generally recommended for small business owners to stash at least three to six months’ worth of savings for leaner times. We found 55 percent don’t meet that bar.
Tax savings would come in handy for the 80 percent of small business owners who report having less than six months’ worth of expenses on hand in cash.
Even more strapped for cash, 70 percent have no more than three months’ worth of cash on hand and 21 percent of small business owners don’t have a reserve for even one month’s expenses.
Here’s a breakdown of how many months’ worth of money business owners have available:
Zero – 20.5 percent
One – 15 percent
Two – 19.1 percent
Three – 15.1 percent
Four – 6.7 percent
Five – 3.5 percent
Six or more – 20.2 percent
Established businesses are more likely to have more savings in reserve. Of those in business for 15 years or more, 31 percent have six months’ worth of expenses saved. The amount of money in the reserve is lower for new businesses. Among companies 10 to 15 years old, 20 percent have six months’ worth of expenses stashed away, compared with 18 percent of those operating between five and 10 years. Among the youngest businesses open in less than five years, just 16 percent have saved six months’ worth of cash.
Edible Packaging Market
The global edible packaging market will grow at a CAGR of more than six percent during the period 2018-2022, according to the latest market research report by Technavio.
A major factor driving the growth of the market is the safe and hygienic transportation of edible packaged food. The edible packaging layer is consumable. Thus, the packaged food must be protected from germs, and other harmful substances during processing and shipping. Therefore, safe and hygienic transportation of edible packaged food is essential and challenging for companies. Long distances and the time of transit increase the chances of spoilage in edible packaged food.
In this report, Technavio highlights the growing demand for lightweight food and beverage packaging as one of the key emerging trends in the global edible packaging market:
Growing demand for lightweight food and beverage packaging
Research and development activities for developing lightweight packaging to help reduce packaging waste have increased. One of the benefits of lightweight packaging is that it is cost-effective. Glass packaging is heavy, fragile, and difficult to transport that adds to management efforts and increases the transportation costs. Lightweight glass for lightweight packaging is produced by blasting frozen polymer with a laser and then rapidly cooling the liquid.
“The demand and popularity of lightweight packaging materials are increasing across the globe. The increase in the use of air cushion bags in the packaging industry led to the popularity of lightweight packaging. The increasing popularity will prompt vendors to provide lightweight edible packaging solutions,” says a senior analyst at Technavio for research on packaging.

The edible packaging market in the Americas had the highest share of approximately 39 percent in 2017. The Americas will project steady growth during the forecast period and is expected to account for the highest share by 2022.
Australians Fast Food Preferences
New research from Roy Morgan shows over 17 million Australians aged 14+ (84.5 percent) buy or eat take away food whether from leading fast food outlets such as McDonald’s, KFC or Subway or from the local fish and chips shop, pizza shop, convenience store or the like.
Although an increasing number of Australians are turning to the convenience of meal delivery services such as Uber Eats and Foodora which we covered in detail last week, traditional fast food restaurants still hold sway for large numbers of Australians.
Old favourite McDonald’s is Australia’s leading quick service restaurant with over half of Australians, or 52.7 percent, eating at or having McDonald’s take away in an average six months, almost 12 percentage points ahead of second placed KFC on 40.8 percent.
Jostling closely for third place are three quick service restaurants at which just under a third of Australians eat at or have take away in an average six months with Subway on 30.8 percent just ahead of both Hungry Jack’s on 29.0 percent and Domino’s Pizza on 28.3 percent.
Top 10 Quick Service Restaurants eat at or have take away in an average six months – 12 months to March 2018
 Source: Roy Morgan Single Source: April 2017 – March 2018, n = 15,067 Australians aged 14+.
Generation Z most ‘hooked’ on McDonald’s & KFC
Analysing the leading quick service restaurants by generation shows that McDonald’s and KFC are the two top quick service restaurants for all five generations. McDonald’s is preferred to KFC by between 11-13 percentage points across the generations.
Patronage of leading quick service restaurants is heavily correlated to age with Generation Z the most likely to eat at McDonald’s (67.3 percent) and KFC (56 percent) while Pre-Boomers are the least likely of the generations to eat at either. Only 26.5 percent of Pre-Boomers eat at McDonald’s and only 15.1 percent eat at KFC.
Subway is the third most popular quick service restaurant for Pre-Boomers (14.8 percent), Baby Boomers (21.3 percent) and Generation X (32.7 percent). Hungry Jack’s comes in third for Generation Y on 36.9 percent and Domino’s Pizza is third for Generation Z, on 42.2 percent.
Top 2 Quick Service Restaurants eat at or have take away in an average six months by Generation – 12 months to March 2018

Source: Roy Morgan Single Source: April 2017 – March 2018, n = 15,067 Australians aged 14+.
Michele Levine, CEO, Roy Morgan, says new research shows the explosion of meal delivery services in recent years has barely impacted on Australians love of traditional fast food outlets such as McDonald’s, KFC, Subway and Hungry Jack’s: “Over 17 million Australians eat take away food and despite the burgeoning food choices available in recent years McDonald’s remains clearly the most visited fast food restaurant in the country. Over half of Australians aged 14+ (52.7 percent) eat McDonald’s in an average six months while traditional fast food rival KFC is second on 40.8 percent.
“Nearly a third of Australians eat Subway, Hungry Jack’s or Domino’s Pizza food in an average six months and Domino’s Pizza is now the third most popular restaurant for the upcoming Generation Z.
“Other leading fast food outlets include Red Rooster, and the reigning 2017 Roy Morgan Customer Satisfaction Award Winner Grill’d. Over 10 percent of Australians eat Red Rooster or Grill’d in an average six months.
“The consistently high customer satisfaction performance for Grill’d is certainly delivering the gourmet burger restaurant an increasing customer base as a relatively new entrant to the market. Grill’d opened its first store just over a decade ago in 2004 while other leading fast food chains have been in Australia since the 1980s (Domino’s Pizza and Subway) or even earlier.
“Advances in technology mean ordering food via an app on your mobile phone is easier than ever. To remain relevant when services including gourmet food experiences are quite literally at your fingertips quick service restaurants such as McDonald’s, KFC, Grill’d, Domino’s Pizza and others need to understand their customers and provide for their needs, wants and desires better than ever before.
Cold Coffee Popularity
Summer is just around the corner, which means consumers across the globe will be reaching for cool, refreshing beverages. According to latest research from Mintel Global New Products Database (GNPD), cold coffee has drinkers buzzing, as around one in five (19 percent) global new coffee launches was iced, ready-to-drink (RTD) in 2017, up from 16 percent in 2015.
While Europe has been slower to follow the iced coffee boom, Mintel highlights strong potential among younger drinkers. Two-thirds (66 percent) of UK 18-24-year-old coffee drinkers think chilled coffee is a good alternative to sugary drinks, compared to a quarter (26 percent) of drinkers aged 45+. This echoes what is happening in America where younger drinkers, who are less ingrained in the ritual of drinking hot coffee, have driven RTD coffee growth. Some 68 percent of US 18-34-year-olds currently consume single-serve RTD coffee compared to 43 percent of all adults.
Globally, Japan leads in RTD coffee innovation, accounting for 18 percent of all iced RTD coffee launches in 2017. The US follows, accounting for 13 percent of these launches in 2017, up from 10 percent in 2016.
Chilled coffee is thriving in the US, growing at least 10 percent annually between 2013-17. In fact, more than half (56 percent) of new RTD coffee launches in the US were cold brew in 2017, up from 38 percent the year prior. Meanwhile, RTD coffee is also building momentum in China; Mintel forecasts annual growth of around 20 percent in the next five years as RTD steals more share from instant coffee.
But despite the rapid rate of growth of RTD elsewhere in the world, Europeans remain resistant to the lure of iced coffee. While Spanish consumers are most likely to have tried iced/chilled coffee in Europe, only 10 percent have actually purchased it either from a store or online. Meanwhile, in ‘coffee-purist’ countries like France and Italy, purchase of iced/chilled coffee among all adults is just 3 percent and 4 percent, respectively.
Jonny Forsyth, Associate Director, Mintel Food & Drink, said: “Global investment in chilled, RTD coffee has increased as producers target a younger drinker who enjoys the format’s taste, refreshment and indulgence. RTD coffee is proving a better format for innovation than other hot-serve formats and, in 2017, manufacturers continued to push the format’s boundaries. Cold brew is helping to premiumise the RTD category and is growing fast in the US, albeit less so in other markets. But while new product launches of iced coffee have reached record highs globally, in the US cold brew has emerged as a vibrant growth segment of chilled coffee, and could prove to be the tipping point for take-up of cold coffee in Europe. The key to success lies with the younger generation who have been introduced to chilled coffee in branded coffee shops, which are growing quickly in Europe.”
US Tops Global Coffee Sales, but Nordics Drink the Most
After experiencing strong gains from 2012-15, the US coffee market slowed somewhat from 2016-17 as market penetration of single-cup coffee makers grew saturated. However, the US is still comfortably the world’s biggest market by volume, and is premiumising in response to the influence of the nations dynamic coffee shops market. Last year, US consumers bought 607,000 tonnes of coffee, followed by Brazil (425,000 tonnes), Germany (424,000 tonnes), Japan (304,000 tonnes), and finally Indonesia (268,000 tonnes). Meanwhile, in the UK sales of coffee stood at 63,000 tonnes, while in China sales reached 53,000 tonnes.
The US is also at the forefront of innovation, accounting for 11 percent of all global coffee launches in 2017. This is more than double the innovation of its nearest competitors Japan, France and the UK, each accounting for 5 percent of global coffee innovation.
While the US leads the way in volume sales, North European countries enjoy a very high per capita consumption of coffee—especially in Finland, where consumers drank 7.91kg per person in 2017, and Norway, where they consumed 6.62kg.
The rise in Super Coffee
The rise of ‘super coffee’ reflects how third-wave coffee shops (and some retail brands) have increasingly pushed coffee with health benefits such as added coconut oil, chia seeds, protein and grass-fed butter.
Mintel highlights opportunities for coffee brands to target health-obsessed younger drinkers seeking added health benefits. In the US, one in six (17 percent) 18-34-year-old male coffee drinkers view added functionality (eg extra protein, added vitamins) as important when choosing which coffee to drink.
Finally, it seems coffee is following global consumers’ love affair with all things natural. In 2017, 10 percent of global coffee launches claimed to be organic, up from 8 percent in 2016. This rise was led by the US, where organic accounted for 22 percent of all coffee launches in 2017, up from 15 percent in 2016.
“Coffee with added protein is still a relatively unexplored area of global coffee innovation despite Starbucks targeting this space in the US market since 2015. Increasing attention to health and wellness among consumers globally will result in specific opportunities for coffee with added protein, as well as organic coffee, in the next two years. Europe has particular potential given rising interest in high-protein diets and the popularity of milky coffee among younger adults,” concluded Forsyth.
Restaurant Management Software Market
The global restaurant management software market is projected to reach USD 6.94 billion by 2025, according to a new report by Grand View Research, Inc., expanding at a CAGR of 14.6 percent during the forecast period. The market is likely to witness substantial growth over the forecast period. Technology disruption in the restaurant industry and soaring need for restaurant specific software such as billing and payment processing, inventory management, table management, and menu management are among the key trends stimulating market growth.
Moreover, growing awareness regarding importance of data analytics solutions in providing valuable insights to improve day to day operation is poised to provide an up thrust to the market. Adoption of cloud systems is estimated to experience sharp rise during the forecast period, which in turn will supplement the growth of the market.
The front end software segment holds the largest share in the market in 2016. It is anticipated to account for over 58.0 percent of the overall market revenue by 2025. Spiraling adoption of POS software by restaurant owners for applications such as food ordering, billing, payment processing, customer interaction, tracking sales, order management reporting, and marketing is expected to trigger the growth of the market. All these software solutions help restaurant owners and managers to streamline their business operation, deliver enhanced customer experience, analyze their costs, and increase their profit.
Further Key Findings
- On the basis of deployment, the on premise segment dominated the market in 2016. It is estimated to generate revenue over USD 4.53 billion by 2025
- The market for table & delivery management is anticipated to witness the highest CAGR of 17.6 percent over the forecast period
- The Asia-Pacific market was at the forefront of the global arena in 2016. Flourishing food service sector and growing adoption of advance technology at restaurants, such as tablets, iPads, and tableside payments, is expected to augment the regional market
- Key players including NCR Corporation; HotSchedules; Revel Systems Inc.; Touch Bistro; and ShopKeep have a strong foothold in the market.
Hot Dog Horrors
The question that instills fear in the hearts of four in 10 Americans: What’s in your hot dog? As Americans get ready to fire up their grills this summer, Applegate, the nation’s leading natural and organic meat company, announces new survey findings that illustrate just how petrified people truly are about ingredients in a favorite grilling staple, hot dogs.
The survey kicks off Applegate’s season of ‘The Cleaner Wiener,’ promoting Applegate Naturals® Beef Hot Dog and Applegate Organics® The Great Organic Uncured Beef Hot Dog™, which are Non-GMO Project Verified and made with humanely raised, 100 percent grass-fed beef.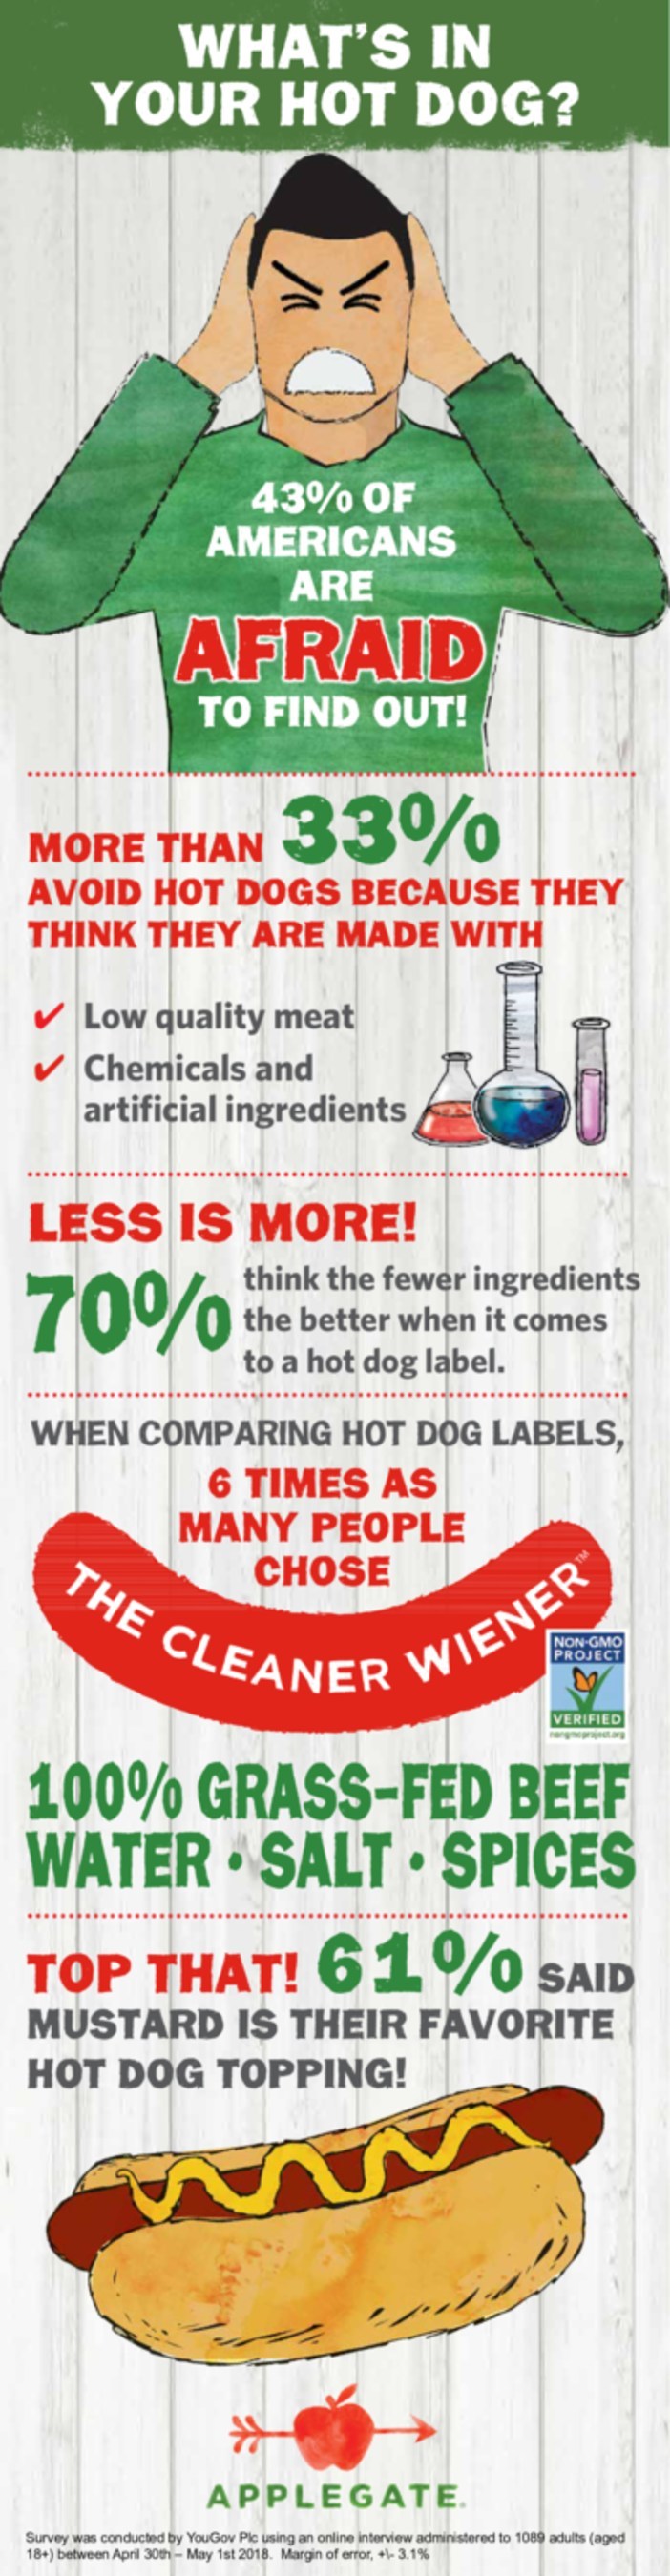
Key survey takeaways included:
- Fear factor: a whopping 43 percent of Americans say they are scared to find out what goes into their hot dogs.
- Science or sausage?: Over a third of Americans avoid eating hot dogs because they believe they are made with low quality meat or are made with artificial ingredients and chemicals.
- Keep it short: Americans are six times more likely to prefer a hot dog made with a simple, short list of ingredients.
- Less is more: 70 percent of Americans agree that when looking at a hot dog ingredient label, the fewer ingredients, the better.
- Hold the antibiotics: A majority of Americans agree that it’s important that their hot dogs are made from livestock never given antibiotics or hormones (56 percent), and nearly half (48 percent) agree that it’s important their hot dogs are made from 100 percent grass-fed beef.
- Millennials not hot for dogs: Americans ages 18-34 avoid hot dogs more than any other age group; 24 percent say they never buy hot dogs.
- Women more choosy: Nearly 50 percent of females are scared to find out what is in their hot dogs, compared to just 37 percent of males.
- Top that: 61 percent of Americans list mustard as their favorite hot dog topping.
“Hot dogs are the poster child for scary ingredients,” said Nicole Glenn, Applegate vice president of marketing. “But there’s nothing to fear in The Cleaner Wiener – it’s made with simple ingredients that don’t require a food science degree to spell or pronounce: grass-fed beef, salt, water and spices.”
The survey that Applegate conducted interviewed more than 1,000 adults ages 18 and over to see how they really felt about hot dogs from their ingredients to consumption habits to favorite toppings and everything in between.