
According to a Recent Study/Survey … End-of-March 2018 Edition
33 Min Read By MRM Staff
This edition of Modern Restaurant Management (MRM) magazine’s “According to …” research roundup features studies on emerging brands, food texture, beer as well as Passover and Easter eating trends.
Emerging Brands Report
Fishbowl released its 5th annual “Emerging Brands Report” announcing the 30 “emerging brands” for 2018 that exhibit a strong promise of potential growth in the upcoming year, based on the analysis of social data.
The report identifies emerging brands within the restaurant industry that are growing while embracing progressive and innovative and approaches to food, service, atmosphere and their audience. Consumers often discover these brands early in their development and become emotionally invested in their growth, creating an active sense of ownership that drives loyalty and increases vocal support via social media. Recognized in order as the top 10 emerging brands for 2018 are: True Food Kitchen, Bareburger, Harvest Seasonal Grill, Firebird’s Wood Fired Grill, Tupelo Honey Cafe, La Colombe Coffee, The Lazy Dog, Mendocino Farms, HopCat, and Cava Grill.
A new element introduced into the ranking process of this year’s report is the Fishbowl Social Score™. This metric uses key performance indicators to rate restaurants’ success in social media on a 1-10 scale across multiple social channels — analyzing consumer feedback, frequency measures from social activity per location, and an Enthusiasm Index.
Each year, Fishbowl’s list of emerging brands contains aspects that are indicators of existing trends – one year, Burgers and Pizza dominated, another year ‘Fresh’ brands were the majority. In 2017, one of the outstanding features of the list was brand strength. Featured restaurants knew their mission – and their customer – inside and out. Distinctive to the 2018 list is the diversity of concepts sought out by today’s savvy guest – American, Burger, Family, Mediterranean, Tavern, Vegetarian, Fresh, Asian, Chicken, Coffee, Pizza, Salad and Juice brands are all represented this year.
“The practice of being strongly mission-driven is important,” said Mike Lukianoff, Fishbowl’s Chief Analytics Officer. “Combine that characteristic with high-quality food and exceptional customer service and it’s a recipe for success that breaks through the clutter in what is a very crowded and competitive marketplace.”
Social Data Analytics is a key component in the suite of analytic capabilities that Fishbowl delivers to the restaurant industry. “As we see through the social data, true understanding of the individual guest’s needs is essential and very relevant when building authentic brand loyalty,” said Jim Soss, Chief Executive Officer of Fishbowl. “Our unique digital and data platform enables clients to leverage this knowledge so they can engage guests in a personalized manner, reaching customers via preferred channels.”
A full report and an extended list of the Top 30 Emerging Brands is available for download here.
Texture is a Factor
Texture continues its rise to becoming a central feature of food and drink innovation. According to new research from Mintel Global New Products Database (GNPD), 20 percent of food and drink launches in Europe in 2017 had a texture description, up from 17 percent the previous year. This further cements the continent’s lead in usage of texture claims: Europe featured the largest share of global food and drink launches with texture descriptions since January 2016. Even the innovative markets in Asia Pacific saw less food and drink launches with texture descriptions, accounting for 14 percent of global new food and drink products with texture claims in 2017.
Katya Witham, Global Food & Drink analyst at Mintel, explained the texture trend today (22nd of March) at Anuga FoodTec in Cologne:
“As the 2018 Mintel Global Food & Drink Trend ‘New Sensations’ describes, texture has a particular opportunity to follow the lead of colour, which has become an increasingly popular feature in food and drink formulations that aim to allure more of the senses. Food and drink products have used ingredients such as turmeric, matcha, and even activated charcoal to create vibrantly hued products that look particularly good in social media. While colour will continue to be important, texture is the next facet of formulation that provides consumers with interactive and social media worthy experiences.”
And interest in such products is evident across Europe. A sizable proportion of European consumers is open to trying unusual textures: 37 percent of Spanish, 36 percent of Polish, 26 percent of French and 22 percent of German and Italian (respectively) consumers say they would like to try food and drink products with unusual textures.
In Germany, interest is especially high in certain product categories. Three quarters (75 percent) of German consumers are, for example, interested in sweet or savoury spreads with unusual or interesting textures. At the same time, 40 percent of Germans would be interested in cooking sauces that bring different textures to a meal. Chocolate appears to be both especially prone to experimentation with texture and successful with this approach in Germany. Nearly half of Germans (48 percent) have already tried chocolate with added texture and would be interested in trying it again, with consumers aged 16-24 even more convinced of the idea; 60 percent have tried and would like to try textured chocolate again.
Witham added, “Texture will only become a more prominent feature in food and drink innovation in Europe. It is an especially important component for consumers who want a more tangible and interactive consumption experience. Products that appeal to multiple senses can provide consumers with escapes from the routine and stress of life, opportunities to make memories and generate share-worthy social media posts. The sound, feel and satisfaction provided by texture make it a trend to watch in 2018 and beyond.”
Foodservice Packaging State of the Industry
The Foodservice Packaging Institute’s 2018 State of the Industry Survey shows steady industry volume and profit growth in 2017. Survey respondents predict this trend will continue in 2018.
“Each year, we ask our members and non-members to share their insights on issues directly related to the foodservice packaging industry,” said Lynn Dyer, president of the Foodservice Packaging Institute. “Based on their feedback, the 2018 State of the Industry Survey projects another positive year for the foodservice packaging industry and our members.”
Results compiled for the survey included input from raw material and machinery suppliers, converters, and foodservice distributors and operators. Over 75 percent of foodservice packaging manufacturers and suppliers reported volume growth and more than 40 percent reported profit growth last year.
Respondents foresee that the greatest areas for market expansion are in the fast-casual and quick-service sectors. This is due to their continued popularity and ability to adapt to an evolving consumer with offerings such as home delivery, e-commerce solutions, and the desire for a quick food experience that’s not “fast food.” Respondents also anticipate tapping into grocery stores because of improved food quality and meals-to-go — either ready-made or make-at-home kits — as these stores try to compete with fast-casual and quick-service restaurants.
More than 80 percent of the respondents expect volume expansion and nearly 65 percent expect profit growth in 2018. Foodservice operators who responded also saw increased sales and were optimistic that this trend would continue.
The positive indicators for growth in 2018 include over 60 percent of the North American manufacturers planning corporate expansion through construction of new facilities, expansion of current facilities, and mergers and acquisitions, and more than 80 percent of North American converters who plan to purchase machinery in 2018.
The survey results also identified five common challenges facing the industry based on the responses from North American converters and suppliers:
1. Increasing raw material costs.
2. Lack of qualified labor.
3. Increasing government legislation / regulation.
4. Public perception of packaging or foodservice packaging as “waste.”
5. Recovery / end-of-life options for foodservice packaging.
“We love to see the continued growth and optimism within our industry. What these challenges remind us is that businesses still need materials and labor to be successful and to grow,” said Dyer.
Craft Brewing Growth
The Brewers Association (BA)—the trade association representing small and independent1American craft brewers—today released 2017 data on U.S. craft brewing2 growth. With over 6,300 breweries operating during the year, small and independent craft brewers represent 12.7 percent market share by volume of the overall beer industry.
In 2017, craft brewers produced 25.4 million barrels, and saw a 5 percent rise in volume3 on a comparable base and an 8 percent increase in retail dollar value. Retail dollar value was estimated at 26.0 billion, representing 23.4 percent market share. Microbreweries and brewpubs delivered 76 percent of the craft brewer growth. Craft brewing’s growth occurred in the context of a total beer market which dropped 1 percent by volume in 2017.
“Growth for the craft brewing industry is adapting to the new realities of a mature market landscape,” said Bart Watson, chief economist, Brewers Association. “Beer lovers are trending toward supporting their local small and independent community craft breweries. At the same time, as distribution channels experience increased competition and challenges, craft brewer performance was more mixed than in recent years, with those relying on the broadest distribution facing the most pressure.”
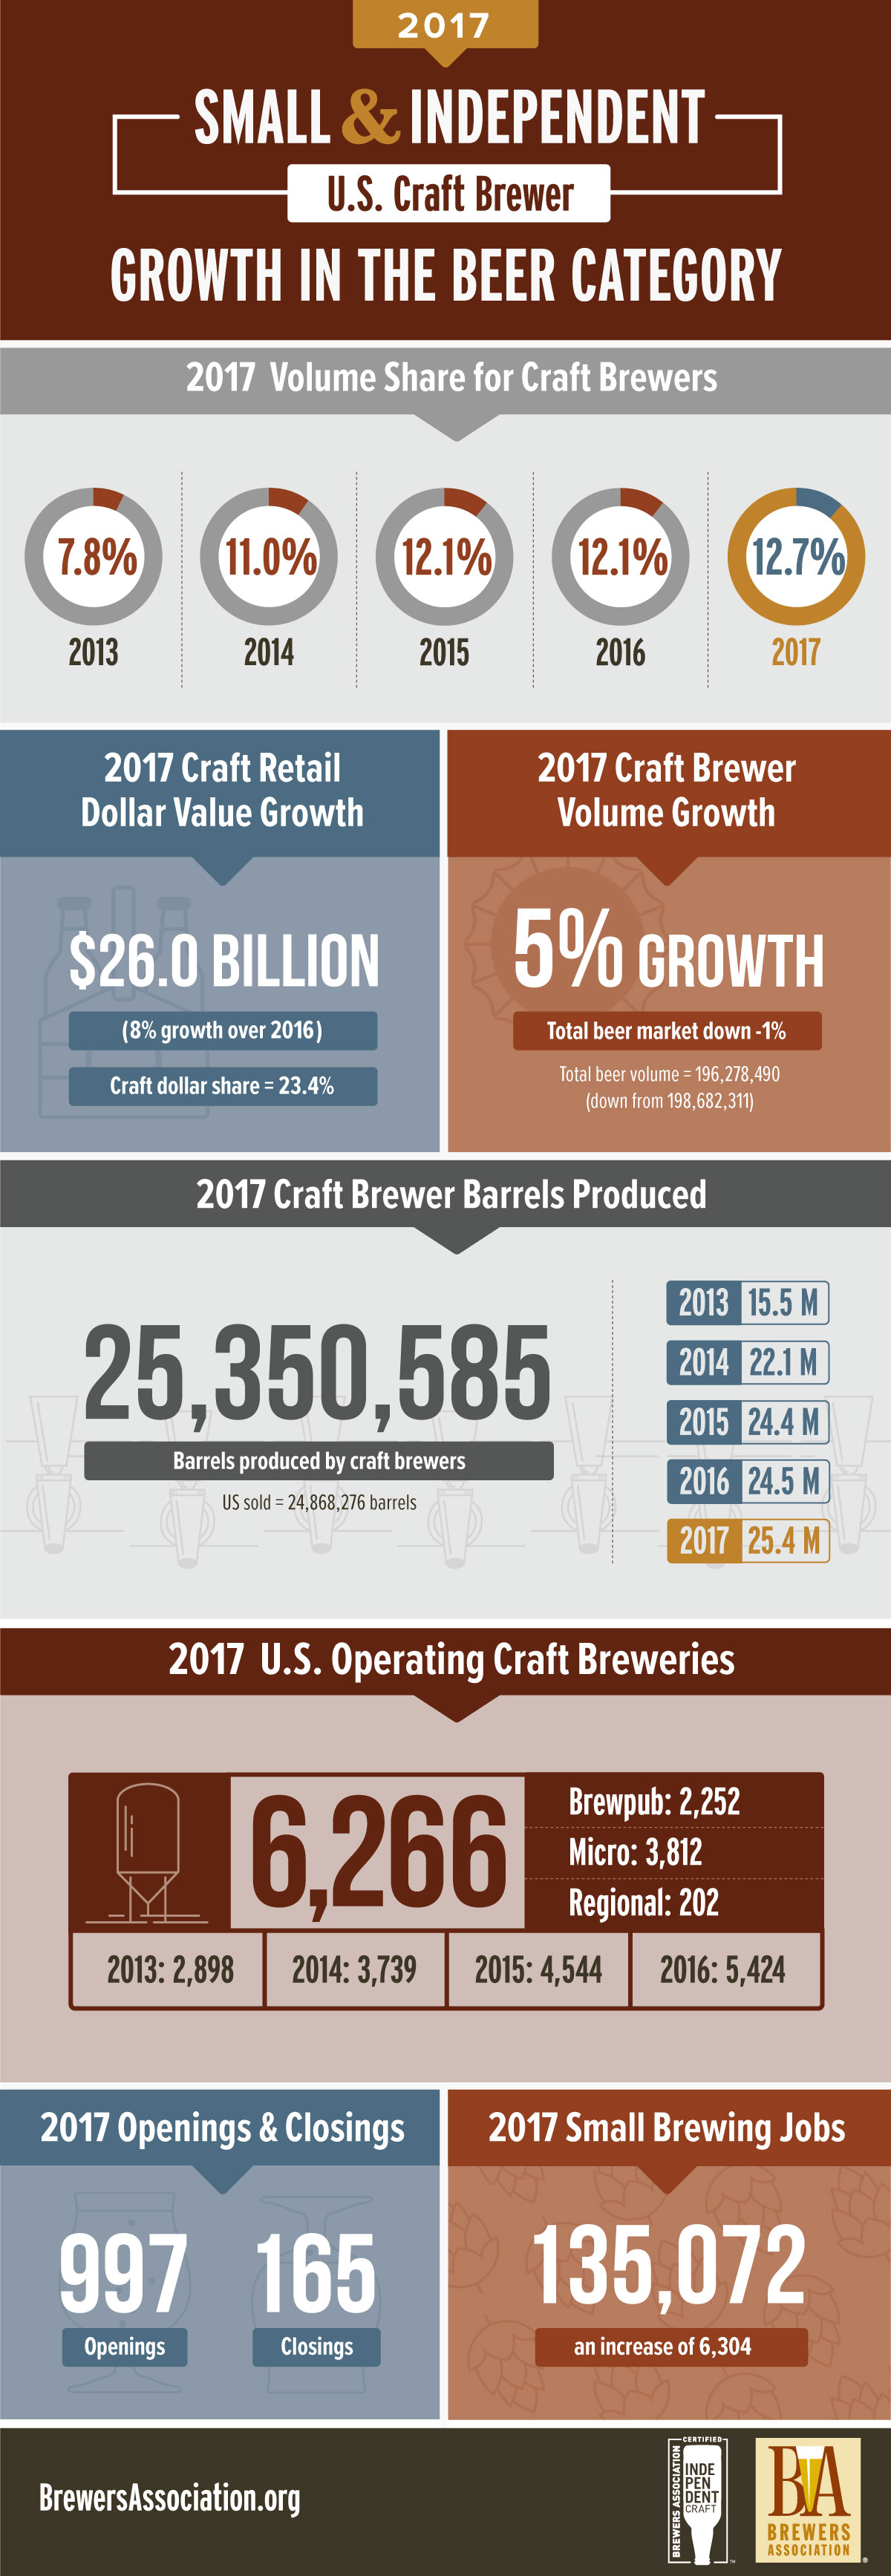
Additionally, in 2017 the number of operating breweries in the U.S. grew 16 percent, totaling 6,372 breweries, broken down as follows: 3,812 microbreweries, 2,252 brewpubs, 202 regional craft breweries and 106 large or otherwise non-craft brewers. Small and independent breweries account for 98 percent of the breweries in operation. Throughout the year, there were 997 new brewery openings and only 165 closings— a closing rate of just 2.6 percent. Combined with already existing and established breweries and brewpubs, craft brewers provided more than 135,000 jobs, an increase of greater than 6,000 from the previous year.
“Beer lovers want to support businesses that align with their values and are having a positive impact on their local communities and our larger society,” added Watson. “That’s what small and independent craft brewers are all about. The ability to seek beers from small and independent producers matters.”
Too Much Choice
Alcoholic beverage consumers tend to be novelty seeking, but constant bombardment with craft launches and unusual flavors has led consumers to feel that they are overloaded with choice, says leading data and analytics company leading data and analytics company GlobalData.
The news that more than half (57 percent) of beer and cider consumers in Asia-Pacific (APAC) find new experiences more exciting than new products also suggests that future success may depend more on finding ways to deliver new “consumption memories” than flooding the market with new products.
The company’s report, ‘Snapshot of Beer and Cider Innovation Trends’, states that overloading the consumer with choice has devalued the ‘craft’ concept. As a result, consumers are shifting toward more immersive, individual, and personalized experiences instead of seeking out overpriced novelties.
This sentiment is reflected in the company’s survey findings confirming that 46 percent of consumers in APAC say that marketing buzzwords such as ‘craft’ and ‘artisanal production’ are just an excuse for manufacturers to charge extra for alcoholic beverages.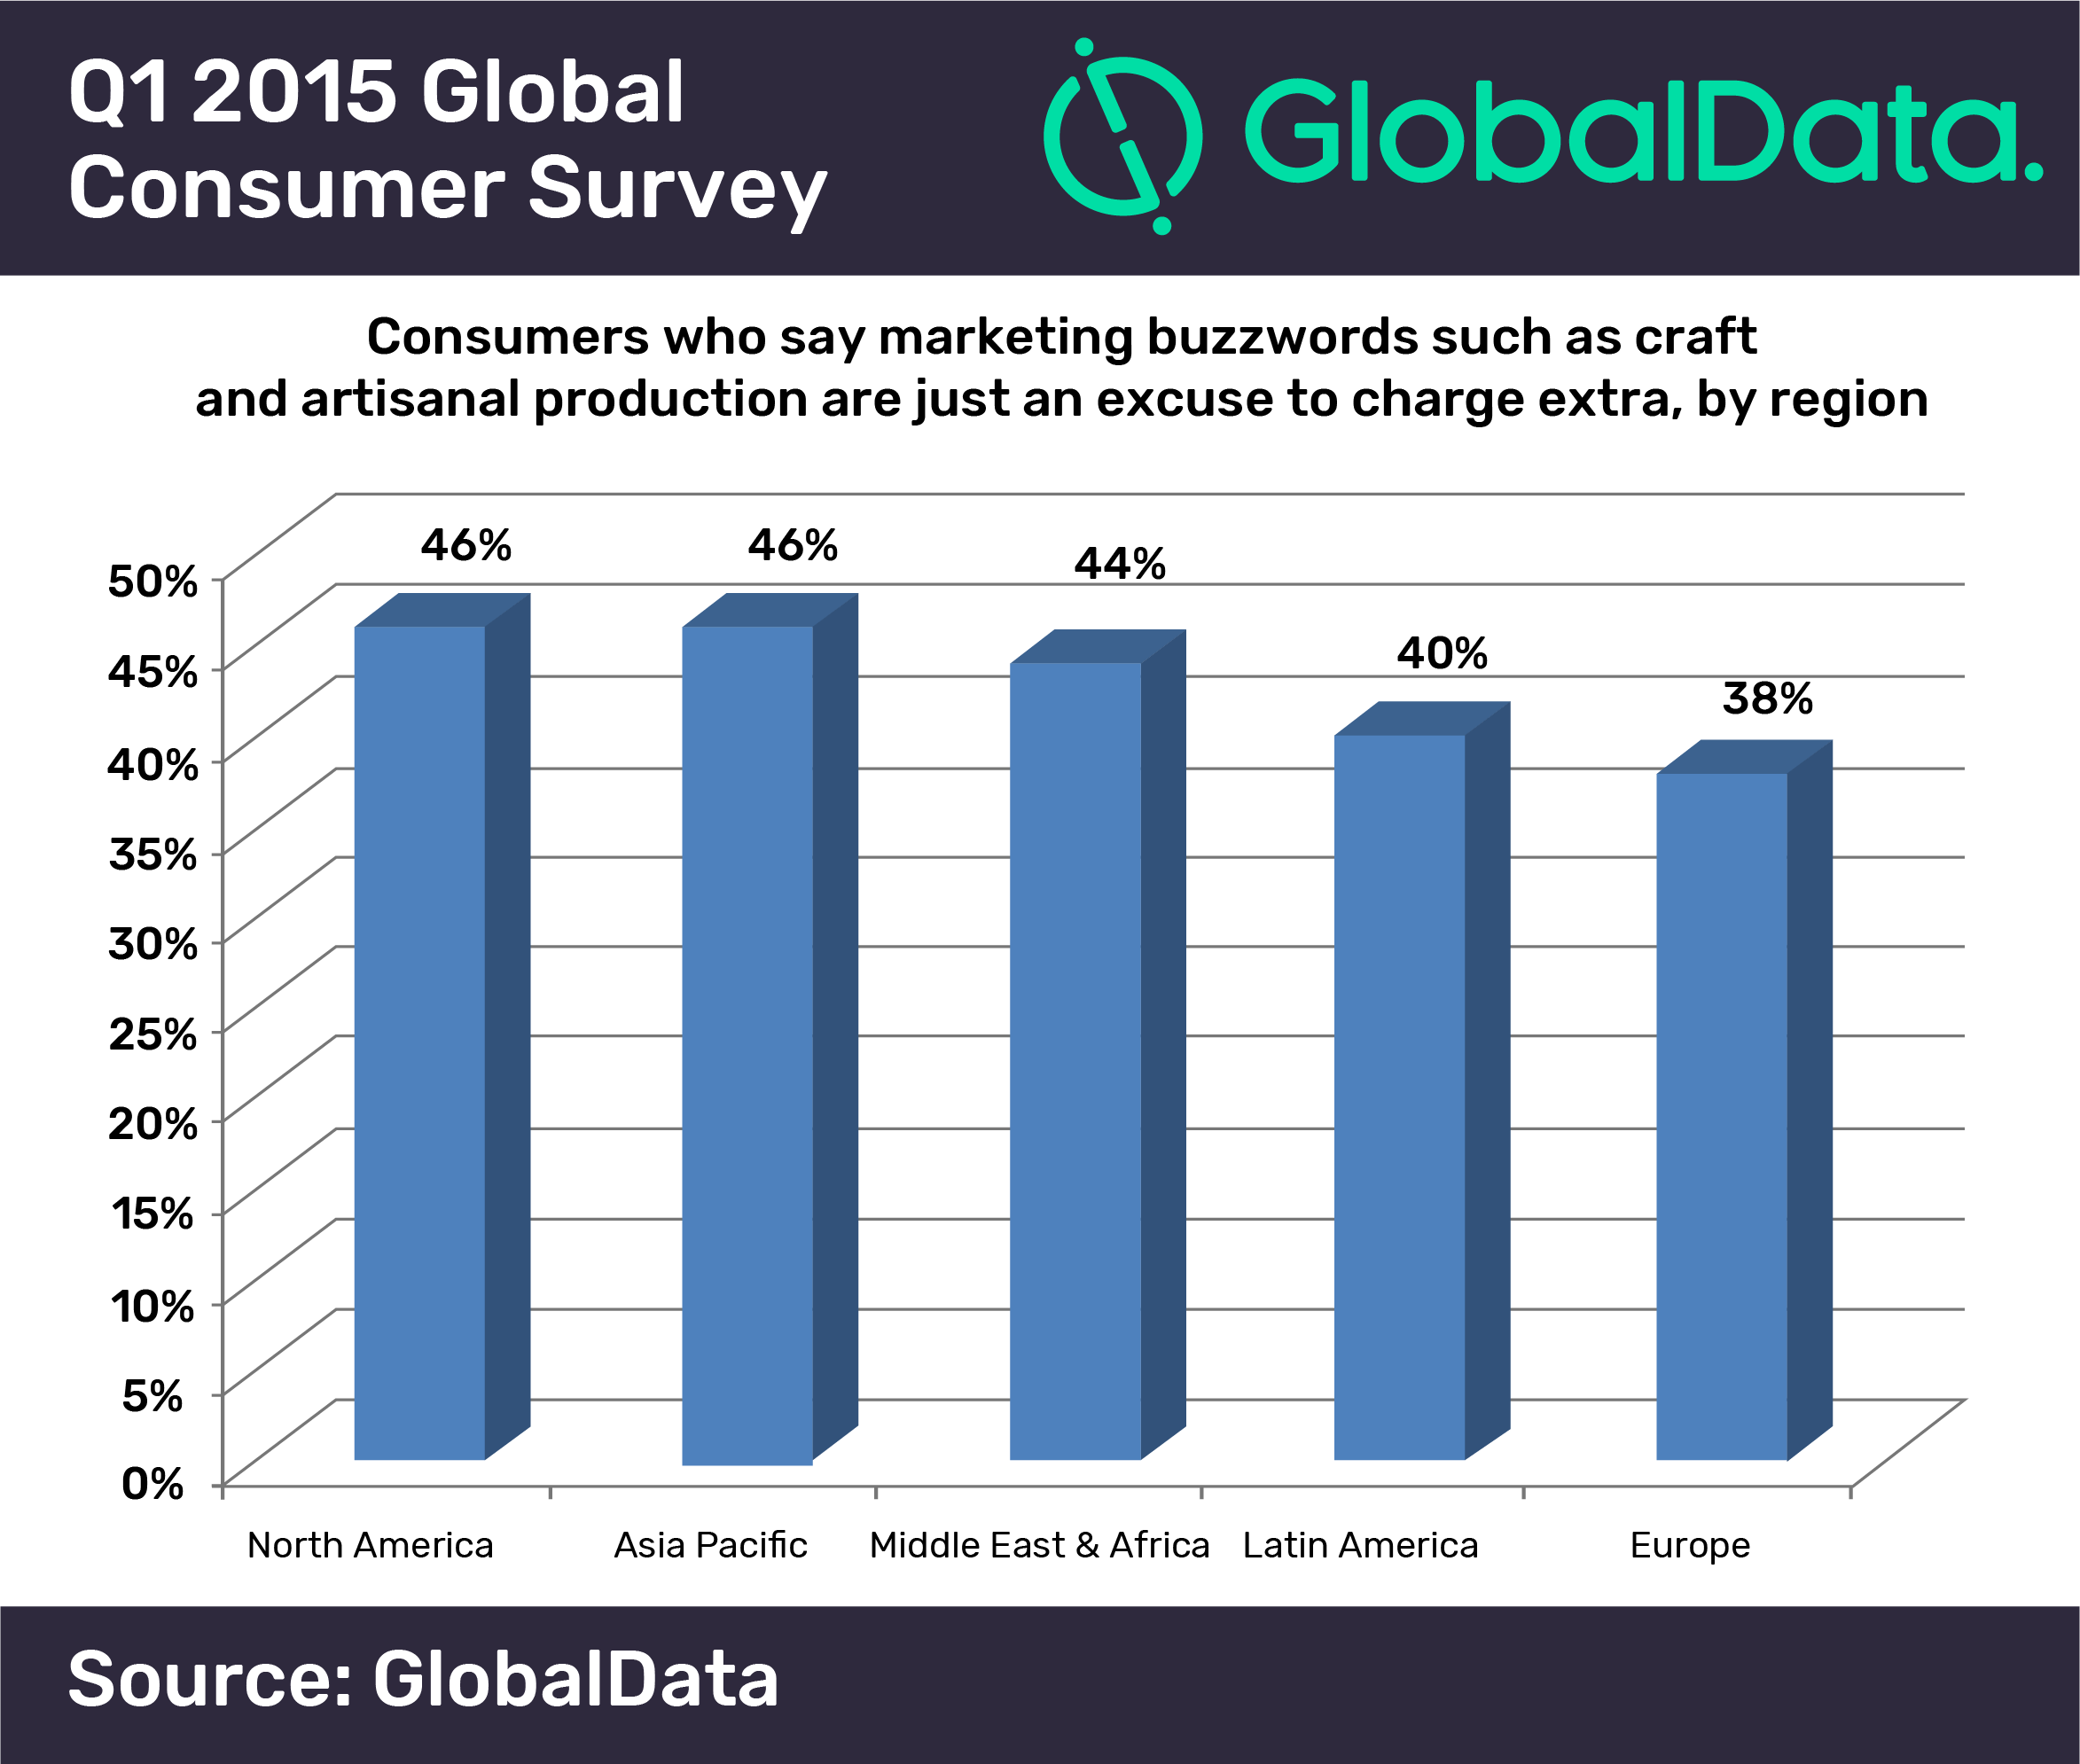
Tom Vierhile, Director of Innovation Insights at GlobalData, said, “Craft beer may have become too mainstream for its own good and overuse of the word ‘craft’ could lead to a consumer backlash. Consumers do remain open to new consumption experiences and are also making healthier choices. We could easily see the industry pivot toward this innovation pillar in the months and years to come.”
Indeed, APAC consumers are much more likely than global consumers overall to focus on health claims when making alcoholic beverage choices. 51 percent of APAC consumers say they find health claims to be influential when choosing which alcoholic drinks to enjoy versus just 38 percent of consumers globally, according to GlobalData.
APAC consumers are also much more likely to say they plan on cutting down on alcohol consumption for health reasons than consumers globally. 53 percent of consumers in the APAC region say they agree that they plan on cutting down on alcohol consumption for health reasons compared to just 37 percent of consumers globally, per GlobalData.
Vierhile concludes: “Consumers, especially younger consumers, are increasingly drawn to more healthful food and drink options, and this will influence beer and cider innovation over time. Consumers still want to treat themselves, and we think there are plenty of opportunities for products that target special occasions or are intended to be served with specific meals. To boost sales in a struggling global market, beer and cider makers may have to explore a wider range of innovation opportunities ranging from non-alcoholic products to beer or cider products that offer better portion control and a more unique experience.”
Japanese Foodservice
Driven by an increasing number of transactions, the Japanese foodservice profit sector is expected to grow 2.9 percent year on year and reach a market value of USD$284.4bn over the period 2015-2020, according to data and analytics company GlobalData.
GlobalData in its report, ‘Japan – The Future of Foodservice to 2020‘, attributes the increased transactions across channels to growing tendency of consumers to snack throughout the day, as 69 percent of Japanese consumers claim to snack between mealtimes.
On the other hand, the profit sector outlet growth as a whole is expected to remain stagnant during the period.
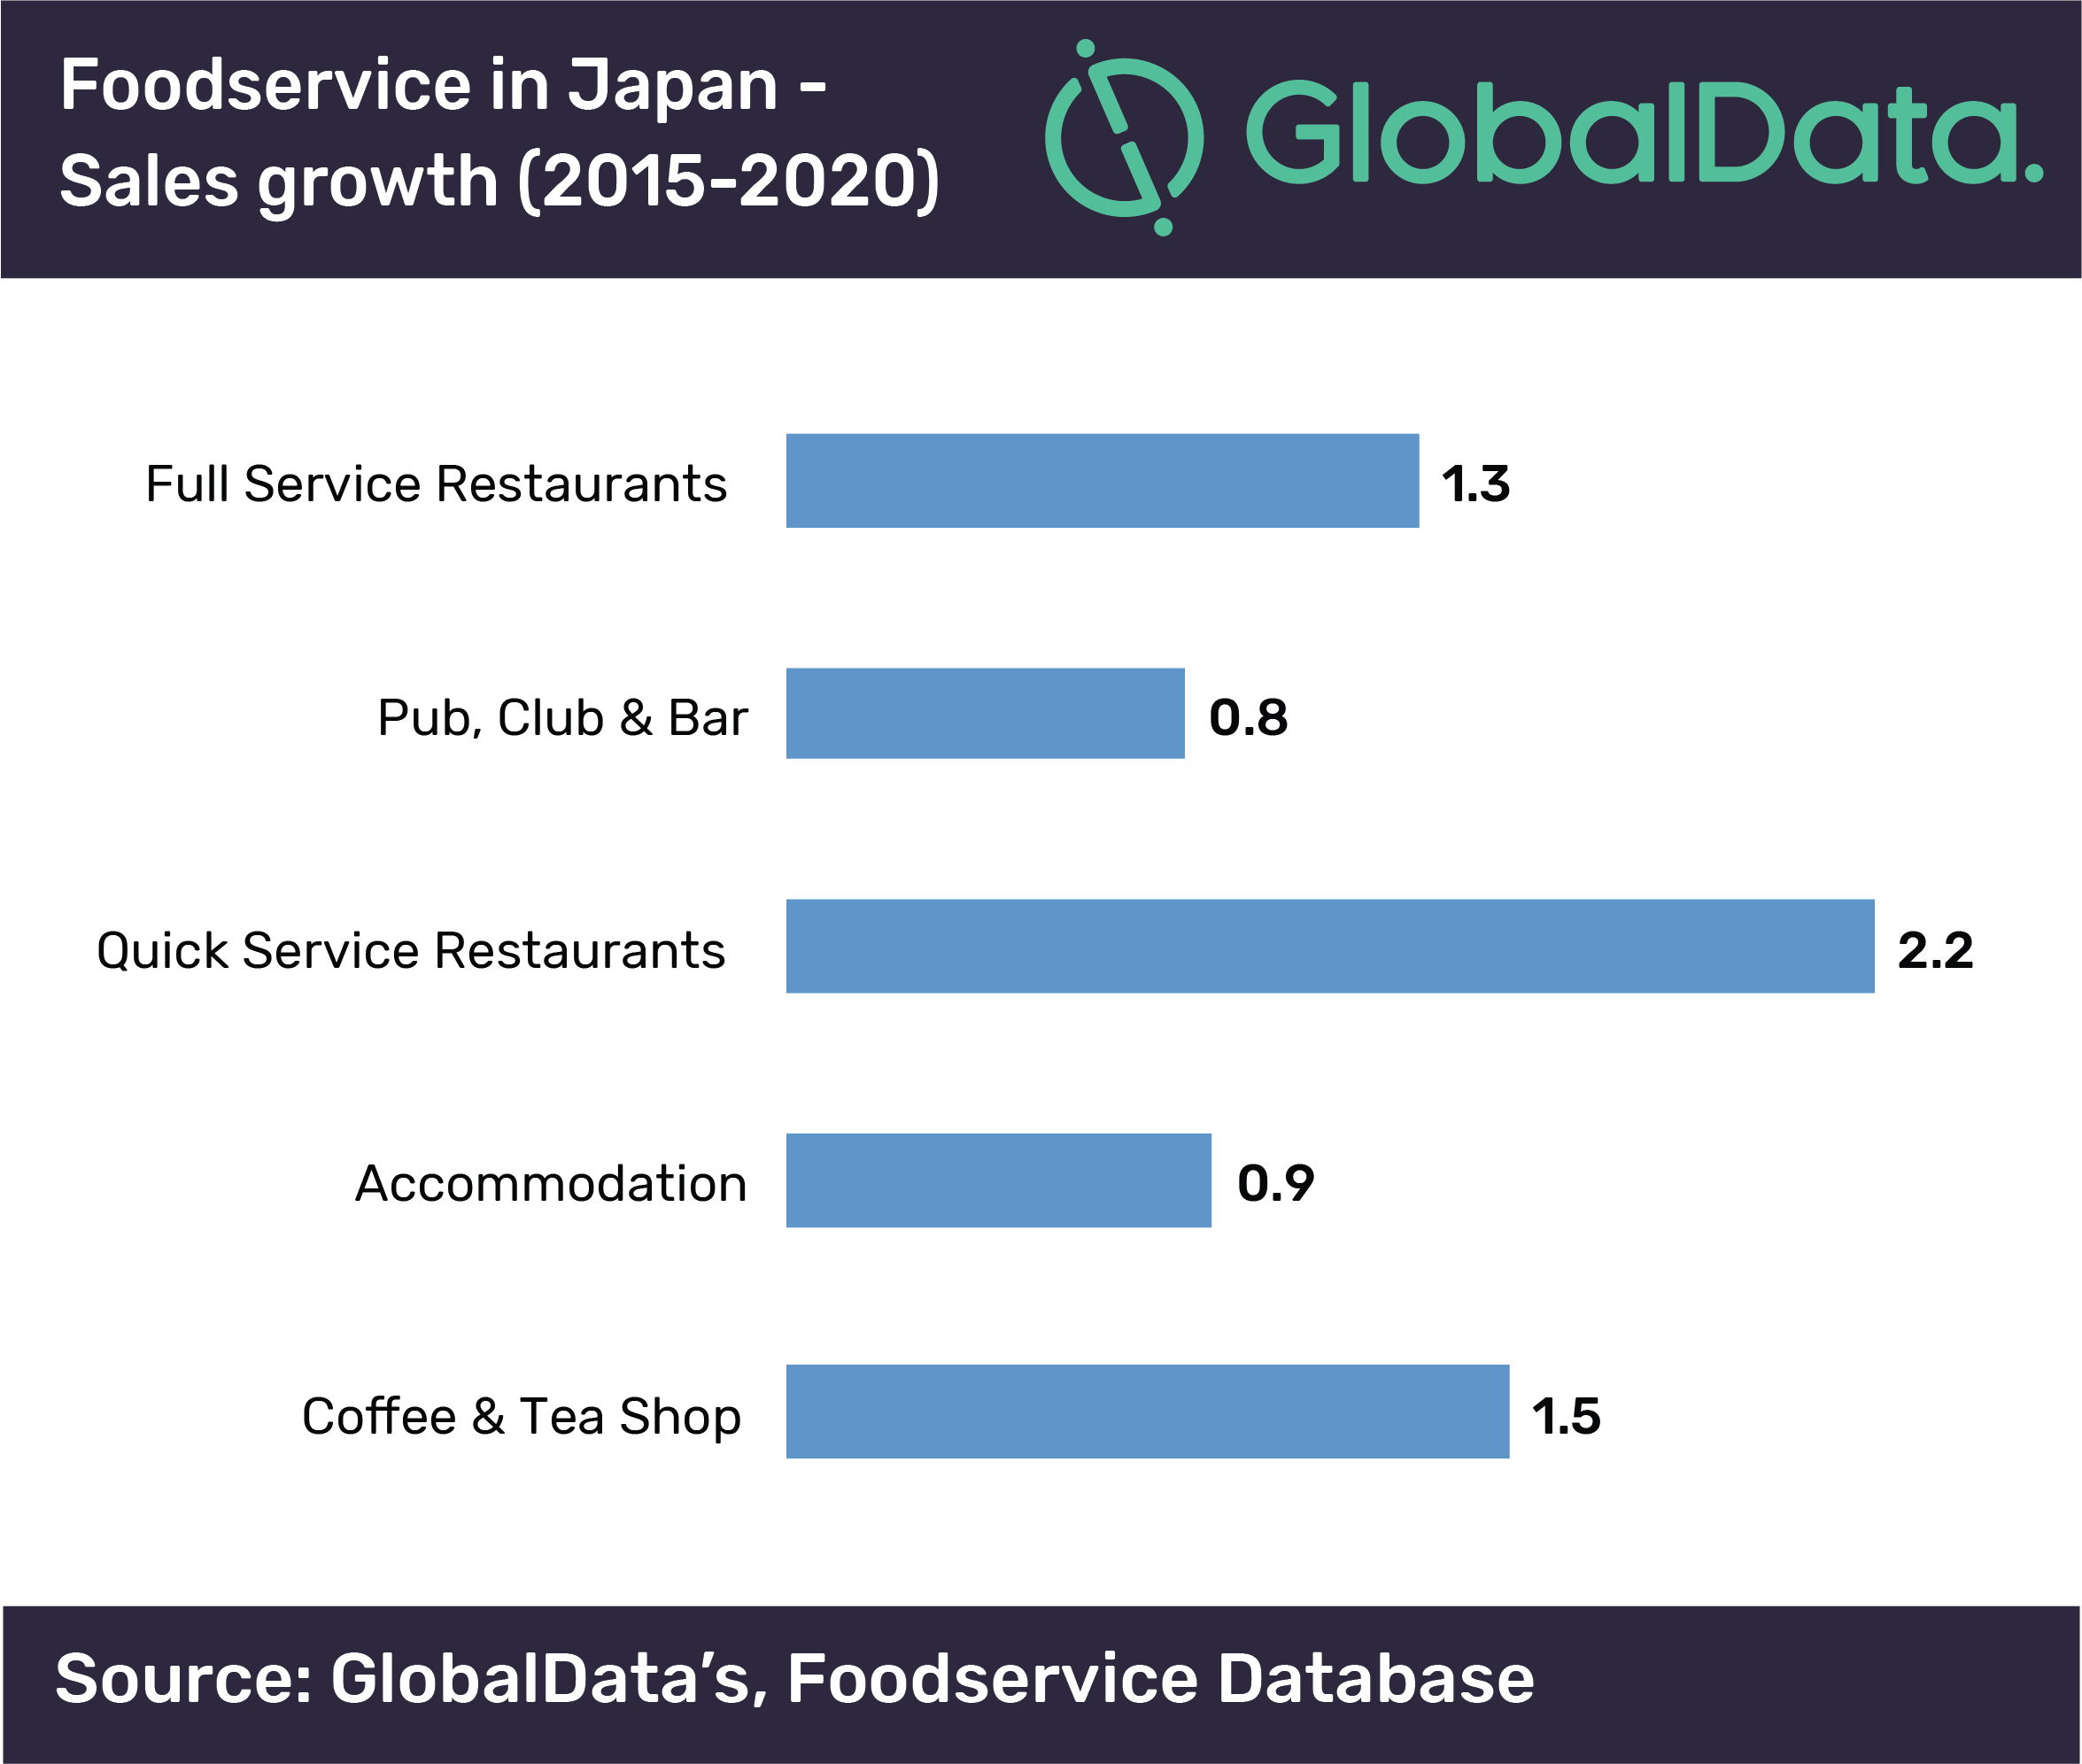
Japan is the second-largest foodservice market in Asia after China based on 2015 consumer spending. Within the profit sector, full service restaurants (FSR) was the largest channel contributing more than one-third of sales, followed by ‘pubs, clubs and bars’, retail, and quick service restaurants (QSR), respectively. The coffee and tea shop channel was relatively small in terms of overall revenue, accounting for only 4 percent of total sector revenue in 2015.
The Japanese foodservice market is evolving; with channels that were formerly distinct from one another increasingly offering products and formats that overlap channel boundaries. One key example is, to facilitate a greater variety of visit occasions QSR operators are offering alcohol with snacks specifically created to accompany alcohol.
The FSR channel is forecast to remain static, both in terms of outlet growth and growth in transaction values, as operators compete for fewer and more price sensitive consumers.
Kambu Ninad, Foodservice Analyst at GlobalData, commented, “Traditional FSR will continue to be threatened by modern day consumer lifestyles, with many people having difficulty finding the time or inclination to experience FSR meal occasions by themselves or with families. Casual operators should offer both quality and convenience to compete directly with more rapidly growing QSR.”
Despite a marginal decline in outlets between 2015 and 2020, the QSR channel is set to achieve the biggest value growth in the profit sector during the forecast period. Owing to the potential, McDonald’s and Burger King have laid aggressive plans to open new outlets in coming year/s to tap into the opportunity in an otherwise bleak foodservice industry.
The QSR channel has a high penetration of chained operators. In addition to convenience based factors, a significant proportion of consumers visiting the channel cited brand familiarity as a key driver for their choice of outlet. A relatively low proportion of consumers cited value concerns as a reason for their choice in the channel.
Ninad concludes: “This shows how increased competition in the market will remove the poorest performing outlets, whilst the best performing outlets will gain considerably. Chain outlets create an ideal situation for time-poor consumers who would rather know the offering that is available beforehand. As convenience drives QSR visits, operators should use digital technology to foster loyalty and make visits quicker and easier.”
Younger Consumers are the Most Calorie Conscious
Over one-third (35 percent) of global consumers are actively trying to reduce their consumption of calories. Millennials are showing the greatest interest and are more open to the positive health benefits associated with reducing calories, according to GlobalData.
GlobalData’s Q4 2016 global consumer survey highlights that motivation to reduce intake appears to fall as age increases, with younger age cohorts displaying the greatest interest in cutting calories. In fact, 36 percent of millennials are trying to reduce calorie intake, compared with only 29 percent of the silent generation. Consequently, evidence suggests that younger consumers are more receptive towards calorie reduction and its positive health benefits.
This carries importance as new research from Cambridge University UK suggests that placing calorie counts on menus in food outlets can reduce portion sizes. The results of this research suggest that when provided with calorie information, intake was reduced by one-eighth (12 percent).
Charles Sissens, Consumer Analyst at GlobalData, commented, “These findings could shape the way food outlets and food/drink packaging operate, with many adopting a more authoritarian approach; packaged food/drink products and indeed restaurants and cafés could increase the presence of calorie labelling, thus indirectly coercing shoppers and diners to choose healthier options and contribute towards the global effort to reduce calorie intake.”
Gen Z Keeps it Real
Generation Z, those born 1997 to present, has the potential to take demand for “real” unadulterated food to new heights, finds a new report from The NPD Group. Raised by Gen X parents, Gen Zs have higher consumption rates of organic foods and beverages than any other group, and they were taught at a young age the value of food in terms of function and nutrition and not just how it tastes.
Aged about 20 years and younger and representing 27 percent of the U.S. population, Gen Zs are assumed by many to be an extension of the Millennial generation, but there are differences that require grocers and food manufacturers to fine-tune their messages. Gen Zs are similar to Millennials in that they demand authenticity, freshness, and purity in the products they use, but even more than Millennials, Gen Z consumers say clean eating improves their quality of life and fresh foods play a large role in this lifestyle. This post-Millennial generation is already following through with this sentiment in their actions – Gen Z accounts for some of the heaviest use of organic and non-GMO foods, according to the NPD report, Make It Happen for Gen Z.
Gen Zs also differ from Millennials in their attitudes towards large, multi-national brands. When Millennials became adults and began grocery shopping there was a noticeable shift in favor of smaller, niche, local brands. Prevailing sentiments among Gen Zs, however, represent a shift in this thinking. In many ways Gen Z consumers think of themselves as having a personal brand with a story and values by which to live. They seek brands that support their story, and they are willing to use them regardless of a brand’s size.
“Food marketers should understand that this generation grew up knowing that food is much more than sustenance; food represents culture and therefore is an expression of who they are,” said David Portalatin, NPD food Industry advisor and author of Eating Patterns in America. “This generation was raised to be real and true to themselves and they expect the same from their foods and beverages.”
Challenges of Kids F&B Market
The kids’ food and beverage market is a tricky business and requires a special approach to both innovation and marketing because industry players must sate the needs of both parents (as the purchaser) and kids (as the user), according to Kids Food & Beverage Market in the U.S., 9th Edition, a report by market research firm Packaged Facts.
The uniqueness of this market is that there’s no distinct way to differentiate kids’ food from regular food products. Of course, marketers may use fun shapes, crazy colors, or character merchandising to appeal to kids; however, this doesn’t make a product exclusive to kids. Indeed, marketers may choose to target kids yet the product may still be enjoyed by adults—or vice versa. This grey area provides incentive for marketers to innovate new product lines that can be adapted to kids’ needs and desires or more broadly as a family-friendly food or beverage. Indeed, the kids’ food and beverage market offers significant promise to any player looking to expand their audience.
Connecting Kids Food Market to Growth Opportunities
To begin with, it’s pertinent to understand key factors that help define the size of the market and potential for growth. In 2018, the child population is 73.8 million strong, accounting for 22.4 percent of the total U.S. population. With little change in the number of children expected through 2020, industry players must engage kids earlier and retain relationships through the teen years to realize full market potential. The most effective marketers will leverage honed strategies to increase the connection with the core family market without alienating the childless household.
Understanding how the changing family dynamic impacts the market for kids’ food and beverage is also imperative. Specifically, Millennials now represent a large constituent of the parent demographic, and these consumers have a different approach to parenting than previous generations. These consumers have a definitive perspective on what is important in products and brands they buy. Growth of the multicultural population also bears weight on the family demographic and requires marketers leverage strategies in order to appeal to varied traditional and cultural values.
Economic conditions emerge as a factor to growth and demand for kids’ food and beverage. In fact, the core shopper of kids’ food and beverage have one of the highest median household incomes, and when coupled with increasing consumer confidence, there is significant opportunity for category growth.
As with any food and beverage market, health and wellness trends emerge as an important market factor. Industry players are doing their part through new product development of healthier kid-friendly food and beverage, but there’s clearly room for more players to find a seat at this table. The stealth health movement is a good example of how industry purveyors are developing products to help parents increase kids’ fruit and veggie intake while still retaining kid appeal.
What Matters to Parents When Food Shopping
Collectively, these factors create context as to the size and potential of the kids’ food and beverage market; however, it’s important for makers and marketers to better understand what influences parents’ decisions on what they feed their children. In terms of product attributes, fresh food/beverage and products on special sale/promotion are among the most valued product qualities by parents. Parents also seek out food and beverages that are all-natural, non-GMO, no/low sugar and have no artificial ingredients. Marketers must clearly tout such attributes as parents are very likely to consider information on product labels. Still, kids emerge as a key influencer over parents’ choices, with 55 percent of parents saying their kids’ preferences and requests are especially important to them. Further, nearly all (91 percent) of parents say they buy a new food or beverage that their kids ask for at least some of the time, with 20 percent indicating they almost always do so. This provides incentive for marketers to continue to target the end user in promotional efforts.
A Lucrative Market Worth Navigating
By exploring usage trends, marketing strategies and product innovation across a range of retail food and beverage categories, the degree to which these market factors and parental attitudes/behaviors are at play becomes evident. The takeaway is that the kids’ food and beverage market offers a lucrative opportunity to all players who wish to navigate the tricky business of appealing to particular parents…and fickle kids.
Kosher for Passover
Orthodox Union Kosher, the world’s largest and most widely-recognized kosher certification agency, reported an increase in not only the number of Kosher for Passover products available but also the sheer variety of what you can buy today. And it’s not just about traditional staples like matzo, brisket and potato kugel; shoppers who observe are buying everything from coconut oil, cauliflower rice and marinara sauce to coffee, vodka and wine.
Aisles of local grocery stores are filed with OU-certified products. The company certifies over one million products annually. Industry reports have indicated that the Kosher food market is growing rapidly. This is especially true for Passover, with sales amounting to 40 percent, or $1.8 billion, of the Kosher food market, and over 55,000 different Kosher for Passover foods available.
Shoppers are also looking for more than this holiday, as many stores offer kosher for Passover pet food and other household and personal care items like deodorant, shampoo, toothpaste, food wraps, tablecloths and more.
“We have seen the number and type of products available today nearly double since 2012,” said Rabbi Menachem Genack, Chief Operating Officer, Orthodox Union Kosher Division. “The Kosher market, even beyond Passover is growing exponentially as those who observe expand and modernize their palettes and the desire for clean eating continues.”
The rigorous kosher certification gives both observant and non-observant consumers piece of mind that the food they are buying was produced with quality and purity in mind. To help shoppers know what is, and isn’t, kosher, OU offers a Passover guide and app, designed for easy use while shopping.
Easter Spending Expectations
Easter spending is expected to total $18.2 billion this year, almost on par from a record $18.4 billion in 2017 but still the second-highest level on record, according to the annual survey released today by the National Retail Federation and Prosper Insights & Analytics. A total of 81 percent of Americans will celebrate the holiday and spend an average of $150 per person, down from last year’s previous record of $152.
“Despite a modest drop, the Easter forecast is still very positive and nearly as high as last year’s record,” said NRF President and CEO Matthew Shay. “Consumer spending remains healthy both for this holiday and this spring, and that paints an optimistic picture for the U.S. economy in the year ahead.”
According to the survey, consumers will spend $5.7 billion on food (purchased by 87 percent of shoppers), $3.2 billion on clothing (48 percent), $2.9 billion on gifts (61 percent), $2.6 billion on candy (89 percent), $1.3 billion on flowers (39 percent), $1.1 billion on decorations (42 percent) and $780 million on greeting cards (46 percent).
In preparation for the Easter holiday, 59 percent of consumers will shop at discount stores, 46 percent will visit department stores, 28 percent will make purchases online, 25 percent will go to a specialty store and 25 percent will go to a small business or local store. Among smartphone users, 30 percent will research products or compare prices on their devices while 19 percent will use their phones to make a purchase.
“With more than three-quarters of consumers saying they will celebrate Easter this year, the holiday continues to be a traditional staple for Americans,” Prosper Insights Executive Vice President of Strategy Phil Rist said. “We continue to see consumers across ages, genders, regions and disposable incomes participate in this holiday.”
Consumers intend to celebrate Easter in several ways: 60 percent will visit family and friends, 58 percent will cook a holiday meal, 51 percent will go to church and 17 percent will go to a restaurant. The Easter Bunny is expected to have a busy holiday season: 35 percent of consumers will participate in an Easter egg hunt and 16 percent will open gifts. In addition to traditional holiday events, some consumers will pursue more leisurely activities: 45 percent will watch TV, 11 percent will shop online, 9 percent will shop in a store and 8 percent will go to a movie.
The survey, which asked 7,737 consumers about their Easter plans, was conducted March 2-14 and has a margin of error of plus or minus 1.1 percentage points.
Easter Treat Trends
When it comes to chocolate eggs, bunnies and other treats, it seems there has never been so much choice for chocolate lovers around the world. According to Mintel Global New Products Database (GNPD), there has been a delicious 23 percent rise in Easter chocolate launches over the past year* providing a plethora of chocolate choice for Easter egg hunts across the globe. The countries leading the way in Easter chocolate innovation include Brazil, which accounted for 11 percent of global Easter chocolate product launches in 2017, followed by the UK, South Africa, Germany (each with a 10 percent share) and France (9 percent).
Reflecting the importance of seasonal products as a whole, in 2017, almost a quarter (23 percent) of global chocolate launches were positioned as seasonal, such as Christmas, Easter, Valentine’s Day and Halloween.
Overall, the US and Germany lead in terms of total chocolate new product development (NPD), each accounting for 8 percent of new product launches in 2017. This is followed by France (7 percent), the UK (5 percent) and Brazil (4 percent).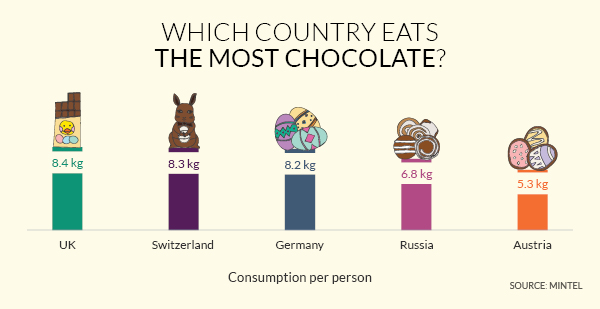
Marcia Mogelonsky, Director of Insight, Mintel Food and Drink, said, “Easter represents one of those ‘permissible indulgence’ moments where consumers enjoy giving and receiving chocolate treats. The holiday also marks a time for increased innovation in confectionery as consumers seek new and novel products. In the UK, for example, Easter eggs flavoured with beer or stout, which were the rage in past years, have given way to new alternatives such as gin-and-tonic flavoured eggs. In Germany, the introduction of vegan Easter bunnies and eggs reflects the growing popularity of a plant-based diet in that country.”
Brits top of the chocs
Across the globe, it seems no one loves chocolate quite as much as the Brits. The average Brit devoured 8.4 kg worth of chocolate in 2017. Hot on the heels of the Brits, Switzerland consumed 8.3kg, closely followed by Germany at 8.2kg. Within the top 10 chocolate per capita consumers, Russia experienced the biggest increase at 2.2 percent; meanwhile, Austria reported the sharpest decline at -1.9 percent.
Consumers ditch calories in favour of a permissible bite
While the lure of chocolate remains strong, it seems many consumers are enjoying it with an element of self control. According to Mintel GNPD, global launches of chocolate products described as “bites” have grown 50 percent over the past five years; with “thins” not far behind, increasing 48 percent over the same period.
But just as bite-sized formats are increasing in popularity, consumers are losing their appetite for “light” versions of confectionery (such as low-sugar or low-fat varieties). Launches of products described as “light” fell by 22 percent between 2013 and 2017.
“The growth of bite-sized chocolate points to the ongoing trend of permissible indulgence. Pre-measured, 100 calorie packs of chocolate or other treats have fallen from favour as consumers move away from diets that focus on strict calorie counts. Offering consumers a ‘bite’ or a ‘thin’ piece of chocolate provides an easier way to measure intake, and one that allows for a bit of wiggle room,” added Mogelonsky.
Strong interest in vegan chocolate confectionery
Mintel research highlights considerable potential for vegan chocolate across Europe. More than half of chocolate eaters in Spain (55 percent), France (53 percent ) and Poland (53 percent) are interested in vegan chocolate, with their counterparts in Italy (48 percent) and Germany (44 percent) lagging only slightly behind. Vegan confectionery is also slowly being introduced into the UK: in 2017, 8 percent of chocolate launches in the UK were vegan.
“There’s currently a focus on plant-based eating in the chocolate sector. Manufacturers have responded to the growing interest in plant-based diets by replacing dairy milk with nut- or grain-derived milks in milk chocolate products. In some markets, this may be responding to a potential, but not yet articulated need,” Marcia concludes.
Jelly Bean Facts
In honor of National Jelly Bean Day on April 22, Jelly Belly Candy Company spotlights some of its most fascinating pieces of trivia from the last four decades.
Seven to 14 Days
It takes between seven to 14 days to make a Jelly Belly jelly bean.
15 Billion
There were 15 billion Jelly Belly jelly beans eaten last year.
1,680 Per Second
Jelly Belly can make 1,680 Jelly Belly beans per second.
100+ Flavors
Jelly Belly Candy Company offers 100+ jelly bean flavors.
5.5 Times
If you laid all those Jelly Belly beans eaten last year end to end, they would circle the earth more than five times.
President Ronald Reagan
Jelly Belly’s most well-known fan was President Ronald Reagan, who started eating the company’s original jelly beans in the 1960s.
First in Space
Jelly Belly beans were the first jelly beans in space, sent on the 1983 Challenger mission by President Reagan as a surprise for the astronauts.
Five Billion
There are five billion Jelly Belly beans eaten at Easter.
Top Three
The top three Jelly Belly jelly bean flavors in America are Very Cherry, Buttered Popcorn and Licorice.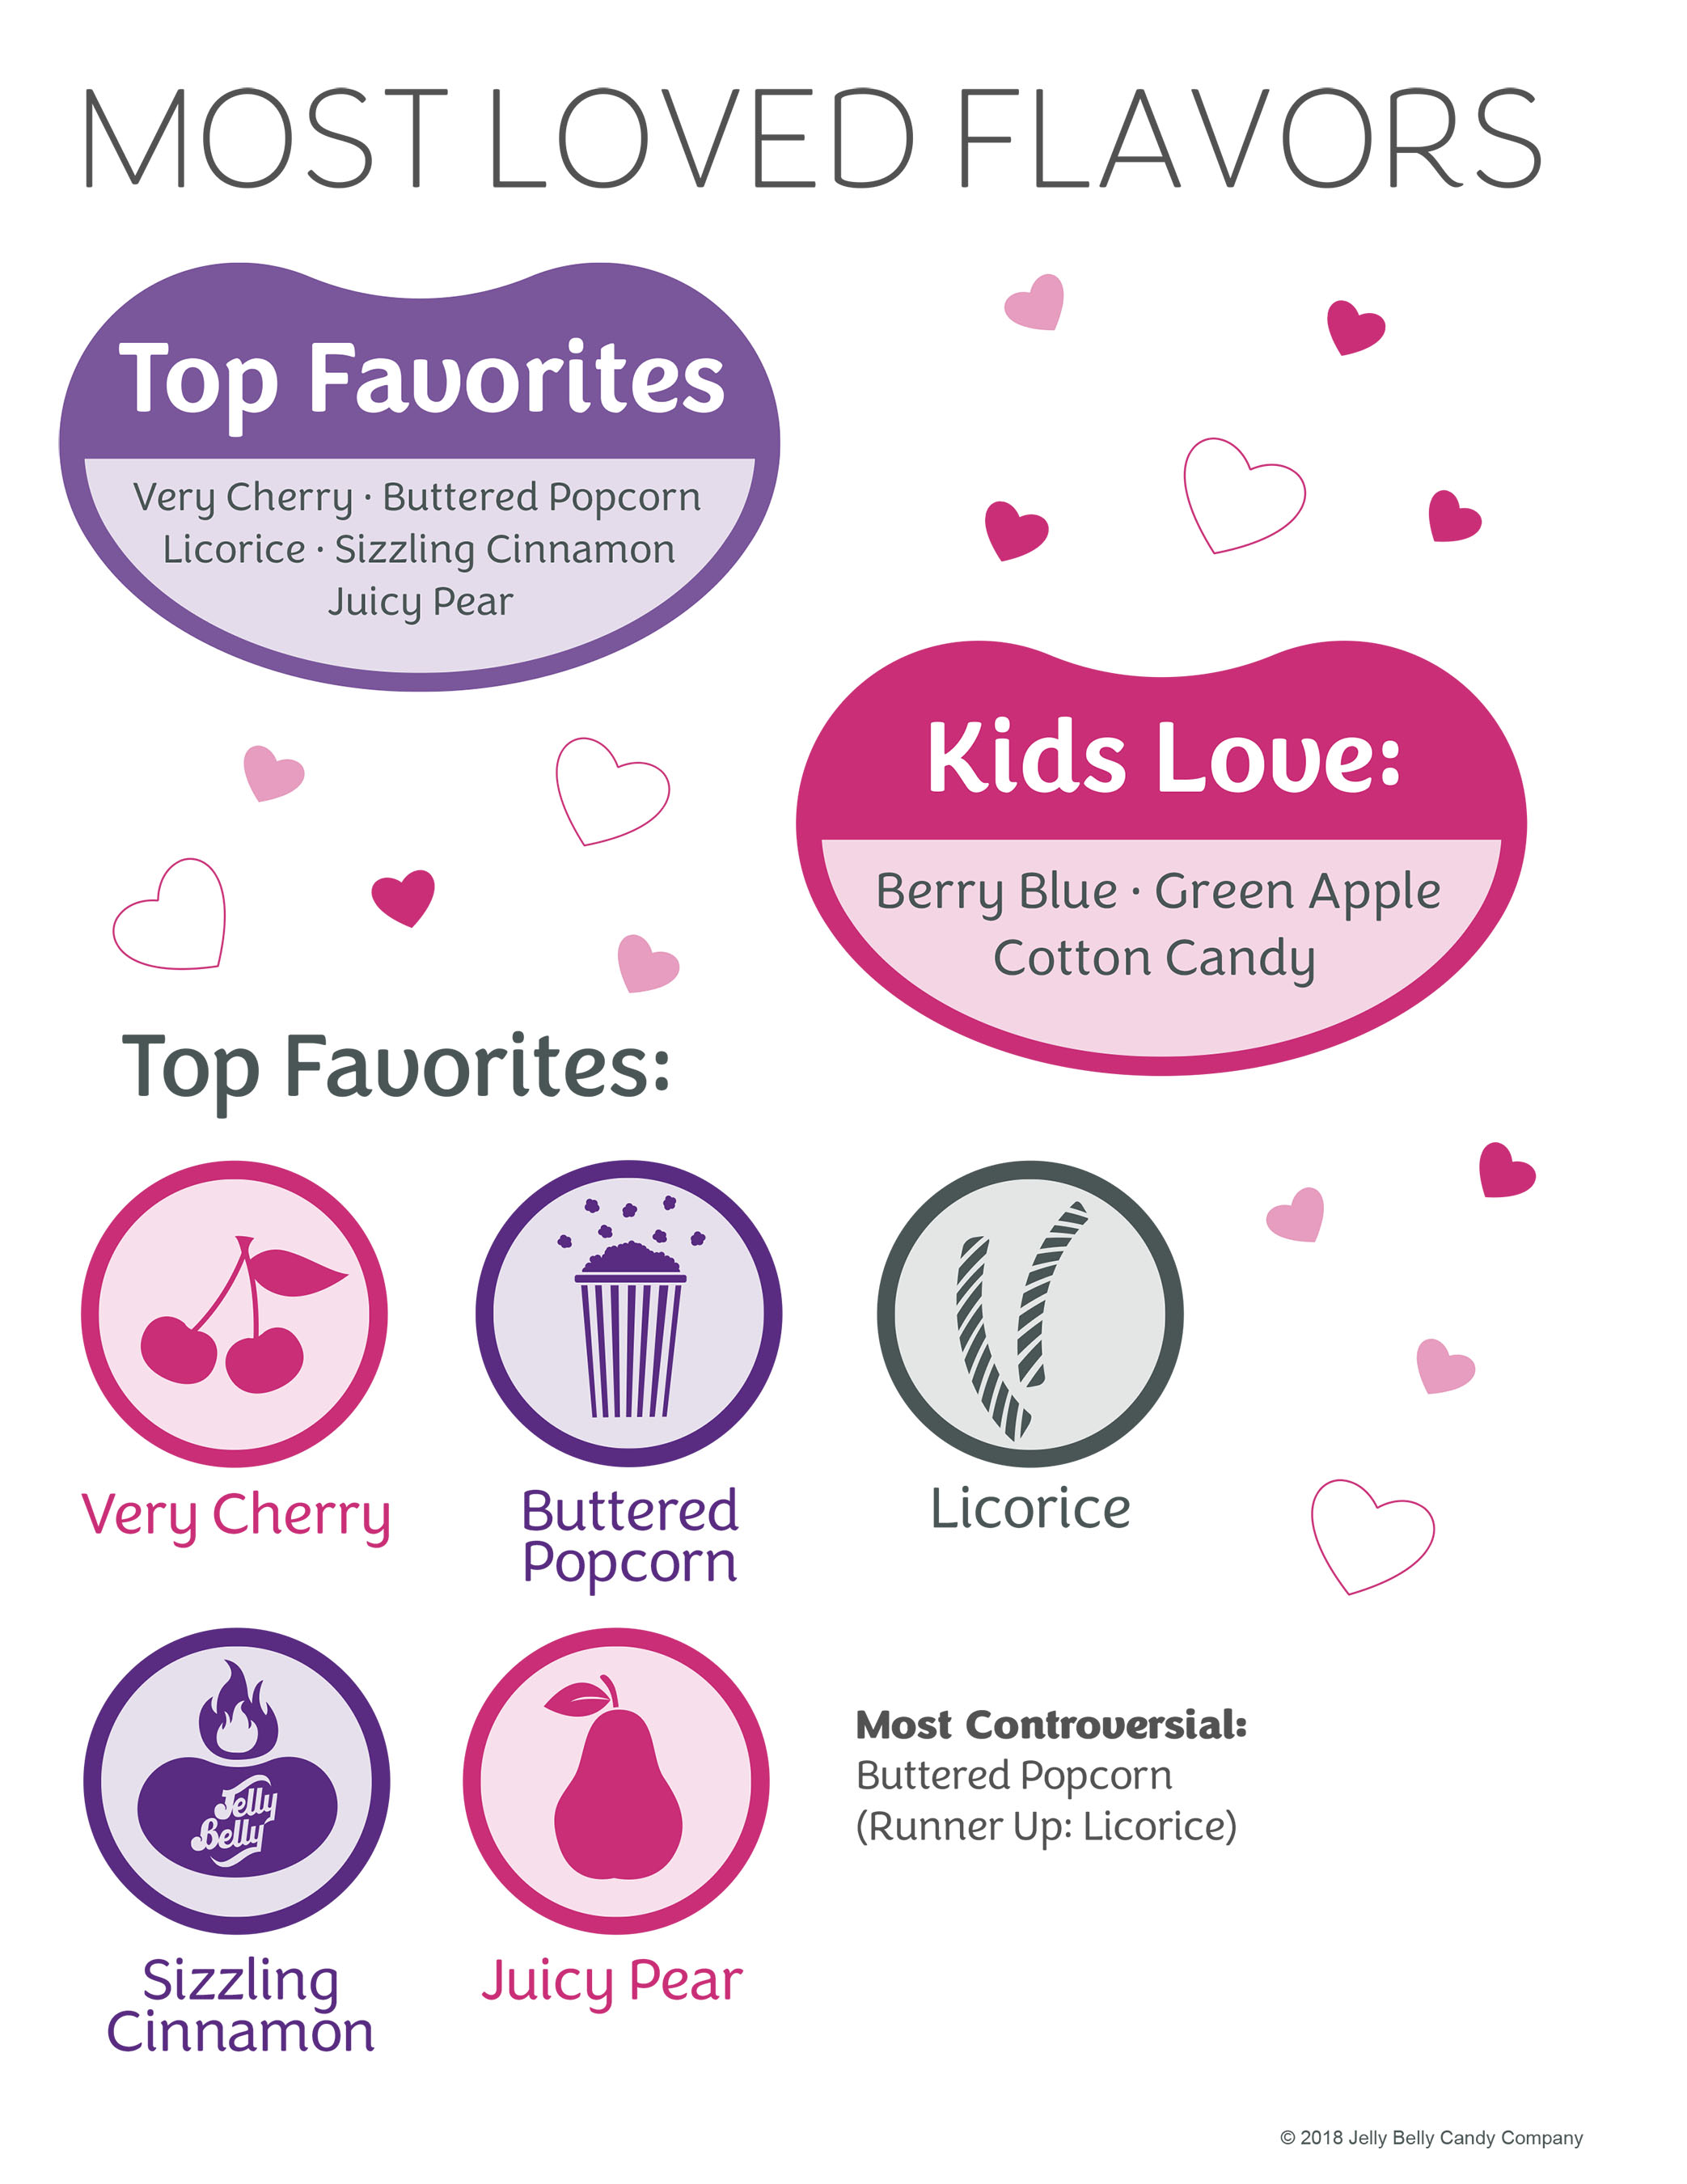
Four Calories
Number of calories in one Jelly Belly jelly bean.
80+ Countries
You will find Jelly Belly jelly beans in more than 80 countries.
What’s in your Basket?
More than 90 percent of Easter baskets this year will include chocolate or candy, according to a nationwide survey by the National Confectioners Association. The chocolate and candy companies behind some of America’s favorite Easter treats have pledged a five-year commitment with the Partnership for a Healthier America, known as the Always A Treat Initiative, and will be doing their part to support consumers as they manage their sugar intake this season.
“People tell us all the time that chocolate and candy help make celebrations like Easter even more enjoyable for them and their families,” said John Downs, president & CEO of the National Confectioners Association. “This Easter, we will continue our work to help consumers manage their sugar intake and ensure that they feel empowered to make informed choices. Confectioners big and small have been extraordinarily innovative when it comes to developing the flavors, varieties and pack sizes that consumers want at Easter and year round.”
Downs added that most people in the U.S. enjoy candy two to three times per week, averaging about 40 calories and about one teaspoon of added sugar per day.
Some of this year’s additional survey findings:
Parents have a plan when it comes to Easter treats
90 percent of parents will discuss the importance of balance as it relates to the fun and enjoyment of chocolate and candy around Easter. With 2/3 of American parents planning to make Easter baskets this year, 85 percent say that individual packs and fun size packages will influence the type of Easter treats they purchase.
Easter is one of the most popular times of the year to share chocolate and candy
Ninety percent of Americans plan to share chocolate or candy with friends and family at Easter.
Americans prefer seasonal classics
When it comes to Easter treats, 55 percent of Americans say chocolate eggs and bunnies are their favorite, while jelly beans and candy-coated eggs are nearly tied for second.
America’s leading chocolate and candy companies participating in the Always A Treat Initiative have pledged to provide consumers with more information, options and support as they enjoy their favorite treats. By 2022, half of their individually wrapped products will be available in sizes that contain 200 calories or less per pack, and 90 percent of their best-selling treats will have calorie information printed right on the front of the pack. The companies participating include Ferrara Candy Company, Ferrero, Ghirardelli, Lindt, Mars Wrigley Confectionery, Nestlé USA and Russell Stover.
AR for F&B
Augmented reality (AR), which blends the real and virtual world together, has emerged as one of the most exciting technologies in the intelligent packaging space for several food and drinks brands. However, despite the initial novelty of AR packaging, it is unlikely that a lot brands will incorporate it into their products, according to data and analytics company GlobalData.
AR packaging is a marketing technique in which an interactive element will be incorporated in packaging to stand out from competitors and drive sales. Yili Weikezi, a milk drink in China, had recently introduced a unique take to packaging within the milk industry. Partnered with popular singer Han Lu, the packaging incorporates a digital voiceprint which consumers can scan with a smart phone to play audio messages creating a more immersive experience.
The technology allows brands to deliver an immersive experience to consumers through a potentially low investment. The majority of the cost revolves around the initial app development and graphic designs. It does not entail additional materials, avoids any major package or production redesigns and can be incorporated into any existing products.
However, consumers would lose interest in AR packaging relatively quickly, particularly if it was readily available all of the time. It would need to be continually refreshed and even then the novelty would likely wear off. Similarly, if a lot of brands have AR packaging the benefit of being able to stand out from the competition is reduced.
In addition, the effects of AR are not easily measured and can be quite subjective. According to GlobalData’s 2016 Q3 survey, 41 percent of consumers globally said that they are rarely/never influenced by ‘digitally advanced/smart’ aspects of food products.
Ryan Choi, Consumer Analyst at GlobalData, said, “If consumers do not want to engage this way, it may not be worth the hassle for brands as the costs could outweigh the benefits. AR packaging works well for short term promotional campaigns either for one brand or in partnerships with others. Nevertheless, AR packaging offers brands a marketing tool, allowing for a highly innovative and immersive experience – and this will define the success of AR packaging campaigns during the short term they are used.”
Dairy Alternative Market
Global Dairy Alternative Beverages Market is segmented on the basis of type as Coconut, Soy, Almond, Cashew, Oat, Hemp, Rice, and others. Among all the types, the Soy segment is taking up the largest share.
Milk that is usually obtained out of nuts, seeds cereals, and grains are known as dairy alternative beverages. These types of beverages are also found in a wide variety of flavors. However, they are generally said to be pricey in nature in comparison to the conventional milk. People who normally taken in these dairy alternative beverages may comprise folks who are vegetarian, dairy intolerant, and individuals having milk allergies. When compared with routine dairy beverages, the cholesterol and fat content level is much lower in them. Most of the customers have started opting for it as the health concerns are on rise. Due to their attached benefits, these products are gradually gaining huge popularity in the food and beverages sector.
The key factors that are playing a key role in raising the global market share may include the industrialization, urbanization, rise in the investments by the leading manufacturers, rising cases of lactose intolerance and allergies, huge preferences towards vegan, particularly plant-based food, increasing lactose intolerance among greater population, burgeoning demands for a wide variety of novel dairy-free applications among the customers, augmented awareness regarding health, growing concerns on obesity, and rising applications and prerequisites among food and beverages sector.
Fresh Food Access
New York is the best city for fresh-food access, with 75 percent of its residents living within a five-minute walk of a grocery store or year-round farmers market, followed by Philadelphia (64 percent) and Miami (57 percent). This is according to a new report by Redfin, which analyzed Walk ScoreⓇ data for 48 major U.S. cities, excluding San Francisco and Los Angeles, for which there was not reliable data.
“While visiting my grandfather’s hometown in South Carolina last summer, the only grocery store there had burned down and residents had to travel 20 minutes to the next town to get fresh food,” said Redfin chief economist Nela Richardson. “Many in the community didn’t have transportation or were elderly. Neighbors organized carpools just to make sure people had access to food. This is obviously an extreme example, but it illustrates the importance of this basic amenity that many people take for granted.”
Boston, Miami and Baltimore showed the biggest improvements in access to fresh food since 2014, when Walk Score last reported a comparable ranking.
“Wegmans and Market Basket are two grocery store chains that have been expanding and opening up new shops throughout the city of Boston over the past couple years to meet the growing demand,” said Redfin Boston agent David Pollack. “Many homebuyers put a premium on homes that are in close proximity to supermarkets with fresh produce, in-store cafes and hot food services.”
Redfin’s analysis also identified “food deserts,” cities where few residents have a grocery store or year-round farmers market within a five-minute walk. Oklahoma City topped this list, with just 6 percent of its residents living within a stone’s throw from fresh food, followed by Colorado Springs (6 percent) and Indianapolis (7 percent). Of the food deserts we identify below, Tucsonand Wichita had the biggest increases in shares of residents with fresh food access since 2014.
“Oklahoma City has been slower than other cities to adapt to having fresh food, gyms and outdoor activities within walking distance,” said local Redfin agent Linda Huynh. “But keep in mind, our city is the eighth largest in the U.S. by land, with just 1.5 million residents. Things are really spread out and mostly accessible by car only.”
Food Crises Report
The Global Report on Food Crises indicates that major risks of famine were averted in 2017 in the four countries that were declared at risk in early 2017: Yemen, Somalia, South Sudan and North Nigeria. However, it also highlights the severity and the complexity of food crises around the world.
Neven Mimica, Commissioner for International Cooperation and Development, who presented the report today in Rome, said: “In 2017, the Global Report on Food Crises alerted us about the risk of famines in a number of partner countries. Thanks to local and international efforts, including in the most critical hotspots, we were able to avert major famines. But let us be clear: we still have huge challenges ahead of us, and the EU will continue to work relentlessly for food security around the world. When future generations look back on this time in history, I want to say that we were not only able to diagnose the problem, but we were also able to prescribe the right solutions.”
Tibor Navracsics, Commissioner for Education, Culture, Youth and Sport, responsible for the Joint Research Centre, added: “Food crises remain one of the most pressing catastrophes worldwide. In Africa alone, over a hundred million people are facing food insecurity with some on the brink of famine. Unfortunately, there is no simple solution. The scientific rigour applied by the Joint Research Centre in compiling the annual report on food crises will help us diagnose the problems correctly and propose the best policies.”
Christos Stylianides, Commissioner for Humanitarian Aid and Crisis Management, said: “World hunger is on the rise again. The EU is one of the world’s leading donors in humanitarian food assistance. We are now strengthening a coordinated response, covering humanitarian and development aspects, to face the increasing complexity of crises. It is only by working together that we can become the architects of a future without hunger”.
The report shows that, in 2017, almost 124 million people faced levels of acute food insecurity or worse. The report finds that in the future, food crises are likely to become more acute, persistent and complex. Among the main root causes for severe food insecurity, it cites conflict, extreme climatic events and excessive prices of staple foods – these factors are often acting together.
To tackle the root causes of these pressing challenges, the EU is working to implement a long term strategy, taking into account humanitarian aid, development assistance and peace building support in an integrated way – and thereby increasing the resilience of people and communities in partner countries.
To implement this long term strategy, the European Union supports measures to improve food and nutrition security and sustainable agriculture in over 60 partner countries, providing approximately €8,5 billion of funding between 2014 and 2020. For the four major food crises in 2017 in particular, the European Union contributed over €750 million to joint humanitarian and development support, and EU Member States additionally provided over €1 billion.
Canadian Meat Consumption
A new analysis of Statistics Canada data shows Canadians are consuming moderate amounts of meat. On average, Canadians consume 41 grams of cooked fresh meat, such as beef, pork, lamb and veal, a day – that’s about half the size of the palm of your hand. They also consume prepared poultry and prepared red meat in modest amounts – 28 grams a day, which is roughly two slices of deli turkey or ham.
“Canadians are consuming red and prepared meat well within Canada’s Food Guide recommendations, and are knowledgeable about the essential nutrients that meat provides,” says Chris White, President of the Canadian Meat Council. “Many might be surprised to know that meat consumption in Canada is similar to that found in Mediterranean countries, places where diets are widely recognized as being amongst the healthiest worldwide,” he added.
Additional Statistics Canada data collected through 24-hour dietary recalls shows that Canadians are consuming less than one Food Guide serving of red meat and prepared meat/poultry a day. An Ipsos poll conducted in September 2017 of 1,000-plus Canadians complements these findings. According to the poll 72 percent of respondents reported to eat three or less servings of meat a week. Encouragingly, 3 out of 4 respondents understand the important role that red meat plays in getting essential nutrients for health.
“Canadians understand that meat is nutrient dense and plays a key role in balanced diets and even has benefits when added to diets that are largely plant-based by helping the body absorb nutrients, like iron and zinc,” said Mary Ann Binnie, a nutrition expert with the Canadian Meat Council.
Health Canada notes women are at risk of inadequate intakes of iron, zinc and vitamin B12: essential nutrients found in red meat. The analysis from Statistics Canada highlights that a significant number of women consume less than the recommended number of servings for meat and alternatives.
“I encourage Canadians to cook with whole, naturally nutrient-rich foods and eat together as often as possible. For a healthy plate, fill it with half vegetables and fruit, one-quarter protein and one-quarter whole grains. Over the course of the week, aim for lots of variety too,” said Carol Harrison, a Canadian Registered Dietitian and founder of Yummy Lunch Club.
Shopping Behavioral Trends
The best way to anticipate and adapt is to use today’s shopper behavior to predict tomorrow’s sales performance, according to a new IRI® Point of View, “Unspoken Shopper Behavior Predicts the Path to Growth.”
“Today’s customer journeys are fragmented across digital and physical touchpoints, making it difficult for CPG companies and retailers to understand how to influence purchase decisions,” said Fernando Salido, executive vice president of IRI Shopper Analytics. “Fortunately, just as technology has enabled new shopping experiences, it has also enabled new analytical opportunities for marketers and retailers. Data can be one of the most effective tools to drive growth, as long as the right data are used in the right way.”
In the report, IRI researchers identified two key indicators of future sales performance:
- Share of Wallet: Share of wallet is the ultimate growth performance indicator in a competitive marketplace, and predicts dollar market share 13 weeks in advance of actual results. Identifying and monitoring the drivers of share of wallet with the greatest impact by category allows marketers to make on-the-fly adjustments that strengthen current and future market performance.
- Digital Consumer Sentiment: Insights from social media activity can be used to understand consumer mindset and influence future buying behaviors. Product mentions in blogs can lead to e-commerce sales growth and microblogs, and social media platforms, which are generally consumed on a mobile device, can drive brick-and-mortar activity.
“Modern marketers and retailers are armed with data that can uncover what, when, where and why shoppers are buying, and even how these purchases make them feel,” said Sridhar Pankanti, principal of IRI Shopper Analytics. “The key to using this data to gain a lasting competitive advantage is finding actionable insights and taking a proactive approach.”
IRI offers a three-part, insights-based strategy for CPG manufacturers and retailers to develop marketing strategies that drive sustained marketplace growth:
- Understand which shopper behaviors are predictors of market performance: Shopper behavior matters. Retailers must invest to identify the behaviors and sentiments that activate their most important customers. These could be common behavioral measures, such as penetration and trips, or unique attitudinal measures, like consumer sentiments that are shared online.
- Monitor trends in shopper measures and associated shifts in retailer market performance: Invest in new technologies and platforms that enable rapid collection, cleaning and synthesizing of the vast and disparate data that is readily available. Constantly measure and monitor trends to identify emerging opportunities and threats. Understand how your banner is performing and keep a close eye on competitor performance. Taking your eye off the ball for even a moment may mean losing a multimillion-dollar opportunity to drive sales. Monitor leakage across brick-and-mortar and online outlets.
- Activate against the most effective shopper measures to drive market performance: Fight to protect and grow share of mind and share of wallet, particularly in categories that drive traffic and/or categories and attributes that appeal to the market’s highest-value customers. Develop strategies to influence buy moments, by tapping into the power of blogs and microblogs, personalizing offers and rewarding brand loyalty.
To download the report, visit: click here.
Easter Time Travel Delays
AirHelp, revealed that more than 11,300 flights were disrupted during Easter weekend last year. Passengers who traveled to the EU between Good Friday and Easter Monday last year may be entitled to claim approximately $5,300,000 in compensation for flight disruptions.
During the 2017 Easter season, Good Friday, April 14, 2017, and Easter Monday, April 17, 2017, saw the largest airport crowds, unsurprisingly falling directly before and after the holiday weekend. More than 11,300 flights experienced disruptions, and these were the top 10 most disrupted routes during the 2017 holiday weekend:
- Los Angeles International Airport (LAX) to San Francisco International Airport (SFO)
- New York LaGuardia Airport (LGA) to Toronto Pearson International Airport (YYZ)
- San Francisco International Airport (SFO) to Los Angeles International Airport (LAX)
- Seattle-Tacoma International Airport (SEA) to San Francisco International Airport (SFO)
- Newark Liberty International Airport (EWR) to San Francisco International Airport (SFO)
- Denver International Airport (DEN) to San Francisco International Airport (SFO)
- Chicago O’Hare International Airport (ORD) to Toronto Pearson International Airport (YYZ)
- Phoenix Sky Harbor International Airport (PHX) to Los Angeles International Airport (LAX)
- Las Vegas McCarran International Airport (LAS) to San Francisco International Airport (SFO)
- New York John F. Kennedy International Airport (JFK) to San Francisco International Airport (SFO)
Based on last year’s data, and with Easter and Passover falling on the same weekend in 2018, AirHelp shares insider tips on how to travel seamlessly during this busy weekend.
Think about selecting an off-peak travel day when booking flights. Traveling to and from your destination on Thursday, March 29, 2018 or Tuesday, April 3, 2018 can help passengers avoid large crowds at the airport, potentially reducing wait time in line for security, helping consumers save money by finding cheaper ticket fares, and minimizing the likelihood of flight disruptions.
Consider looking into several neighboring airports when booking flights, as some smaller airports may have cheaper ticket fares and better ratings for on-time performance. Many large U.S. cities have more than one major airport within several miles. Booking flights out of less popular airports may save passengers time and money while traveling.
Know your rights for flight disruptions, as you could be eligible to claim compensation. If you are flying within the U.S. and you are denied boarding due to an overbooked flight, you may be eligible to claim 400 percent of the one-way fare to your destination in compensation, of a value up to $1,350. Also, for flight cancellations or lengthy delays, if you’re flying to the EU on an EU airline, or departing from an EU airport, you may be eligible to claim up to $700 per person in compensation under European law EC 261.
If you experience a flight delay when flying out of or within the EU, keep your boarding pass and all of your receipts in case the delay causes you to spend extra money. If your delay causes you to miss out on a prepaid reservation or incur unanticipated costs, you may be able to claim reimbursement.
Download the free AirHelp app before your trip to check for real-time updates about compensation eligibility, and map all of your previous flights. This new tool enables you to create a colorful map of all of your previous trips as you wait to board, and provides you with live updates about compensation eligibility as it’s scanning your flights automatically.
Leave extra time for traveling to and from the airport. Since many people are traveling to see family and friends, anticipate traffic near the airport. Schedule extra time for driving, and be sure to leave ample time to get through lines at security.
“Flight disruptions affect a lot of people during holiday weekends like Easter, and unfortunately, since 92 percent of U.S. passengers don’t understand their rights, airlines take advantage of uninformed consumers” comments Henrik Zillmer, CEO of AirHelp. “We urge passengers to read up on their rights for disruptions, luggage issues, and overbooked flights to ensure that they are not missing out on compensation they may become legally entitled to claim if they experience disruptions while traveling during Easter weekend.”
Digital Marketing and Small Businesses
Nearly half (47 percent) of small businesses in the US spent less than $10,000 on digital marketing in 2017, according to a recent survey by Clutch, a B2B research, ratings, and reviews firm. Social media (54 percent), website (51 percent), and email marketing (36 percent) were key areas of investment.
Augmented and virtual reality (AR/VR) represent a small but promising digital marketing channel, with 10 percent of small businesses already early adopters in the space, according to the survey.
Many small businesses may not budget much for digital marketing because they have so few employees and limited resources to invest. More than half (57 percent) of businesses surveyed reported annual revenue of less than $1 million.
In addition, in-house digital marketing teams may not be “teams” at all: 30 percent of small businesses (the largest group) only have one employee working on digital marketing. This finding suggests that in-house digital marketers may lack the time and resources they need to market efficiently.
Small Businesses Plan to Prioritize Websites, Social Media, and Email Marketing
Small businesses’ priorities for digital marketing this year include renewed investments in their websites, social media, and email marketing. Over half of small businesses surveyed will improve their websites (54 percent) and engage consumers through social media (51 percent), while 36 percent will direct more resources to email marketing in 2018.
Content Marketing Lags, Despite Cost-Effective Results
Fewer than 1 in 4 small businesses plan to invest in content marketing in 2018, but experts caution that failing to perform content marketing is a mistake for small businesses.
Creating content – such as blog posts, whitepapers, and videos – is a highly cost-effective way to build brand loyalty and boost a business’ ranking in search results.
Keith Gutierrez, vice president of marketing at Modgility, reminds small businesses that in developing a content marketing strategy, quality is more important than quantity.
“[Content] just needs to be great, quality stuff you can’t find anywhere else,” Gutierrez said.
Small businesses already have what they need to start creating content: They should consider their unique advice and data, and then package that information into useful content.
Virtual/Augmented Reality Marketing Sees an Investment Bump
In an effort to keep up with new technology, some companies (12 percent) will increase their investment in augmented and virtual reality (AR/VR) marketing.
AR/VR marketing is especially effective for products that benefit from in-person tours such as real estate and travel booking.
Derrick Bozkurt, a Colorado realtor at House in Motion, uses VR marketing to create virtual house tours. The technology lets Bozkurt’s clients know exactly what kind of home they’re considering.
Clutch’s 2018 Small Business Social Media Survey included 351 small business owners or managers from across the U.S. with fewer than 500 employees.
Reputation Management Investing
Nearly 40 percent of businesses will increase their investment in online reputation management (ORM) this year, according to a new survey from Clutch, a B2B research, ratings, and reviews company. Businesses’ plans to allot more time and money to ORM are a result of the popularity of social media and third-party reviews sites, which impact businesses’ control over their online reputation.
Clutch surveyed 224 digital marketers in the US and found that more than half of businesses (54 percent) consider ORM “very necessary” to success. As a result, 34 percent said they allocated more resources to ORM in 2018, and an additional 43 percent said they plan to hire a professional public relations or ORM agency in 2018.
Businesses already invest a significant amount of time observing their online reputation, Clutch found. More than 40 percent of digital marketers (42 percent) monitor their companies’ brand online daily, while 21 percent monitor their online reputation hourly.
According to public relations experts, businesses frequently monitor how their brand is portrayed online because they know even one negative media mention can quickly damage the public’s perception of their company.
“When people search for brands online, they tend to search for stamps of credibility,” explained Simon Wadsworth, managing partner at Igniyte, an online reputation management agency in the UK. “If potential customers find anything negative, that could end up being a significant amount of leads the business won’t get from people who are put off from using the service.”
Social media also has shifted the ORM landscape because it gives consumers free-reign to share their opinions and experiences quickly and frequently: 46 percent of businesses look to social media most often to monitor their online reputation.
By using professional agencies that have expertise in online reputation management, businesses can minimize losing new customers who may be dissuaded from purchasing their product or service.
Woman Owners More Likely to Use Social Media
A woman-owned small business is more likely to use social media, according to a new survey from Clutch, a leading B2B research and reviews firm.
Among women-owned businesses, 74 percent use social media, compared to 66 percent of men-owned businesses.
The findings came as no surprise to experts, who said women overall are more likely to use social media. Given that trend, female small business owners more easily can bring their business onto social media.
“Women are generally better conversationalists than men,” said Jeff Gibbard, chief social strategist at digital agency I’m From the Future. “They tend to be more expressive and more emotive. It’s no surprise to me why more women business owners use social media.”
Women often communicate better than men, which translates to the online world where they are more likely to use social media effectively.
Millennial-Owned Small Businesses Lead Social Media Use
There is also a generational divide among small businesses’ social media use. The survey finds that 79 percent of millennial-owned small businesses use social media compared to 65 percent of small businesses owned by older generations.
Millennials, like women, frequently use social media for their personal lives. Their social media skills easily carry over into their businesses – unlike older generations, experts say.
“The older people didn’t grow up with social media, so many don’t understand how to use it for their business,” said Shawn Alain, president of social media agency Viral in Nature. “They went through a significant part of their life without even the internet, and they remember what it was like not to have a smartphone or email.”
Millennials are also more likely to use Instagram and Snapchat than older generations, but Generation Xers and Baby Boomers are more likely to use LinkedIn.
Most Small Businesses Use Facebook
Facebook remains the most popular social media channel for small businesses, no matter the gender or generation of the owner – 86 percent say they use it, which is nearly twice the number of small businesses that use the second-place channel, Instagram (48 percent).
Among small business users of social media, 12 percent say they use Facebook exclusively for their social media efforts.
Overall, 71 percent of small businesses use social media, and more than half (52 percent) share content at least once per day. Images and infographics (54 percent) are the most popular content types that businesses post to social media.
Clutch’s 2018 Small Business Social Media Survey included 351 small business owners or managers from across the U.S. with fewer than 500 employees.