
According to a Recent Study/Survey … End-of-January 2018 Edition
36 Min Read By MRM Staff
This edition of Modern Restaurant Management (MRM) magazine’s “According to …” research roundup includes “super” Super Bowl research, dynamic shifts in brand loyalty and engagement as well as the joy of pizza baking in the oven.
Big Wins for Restaurants on Game Day
orderTalk, Inc. released last year’s Game Day stats that show online ordering has become a favorite pastime on America’s biggest day in football.
On the Big Game in 2017, restaurants using orderTalk’s digital ordering software reported online ordering sales increases well above other non-event days.
- Catering sales won big with a 400 percent increase in online sales transactions and a 300 percent increase in the quantity of food items sold online
- Pizza chains saw a 21 percent increase in online sales transactions with a 20 percent increase in the quantity of food items sold online
- Sandwich chains saw a 3 percent increase in online sales
“Online ordering software analytics such as these demonstrate just how mainstream online ordering has become,” said Patrick Eldon, CEO, orderTalk. “It also highlights that restaurants can increase their online and catering sales drastically by ensuring that they are well-prepared for high-volume days such as these. A well-designed and efficient online ordering system will engage customers and ensure their loyalty.”
Wing-Onomics
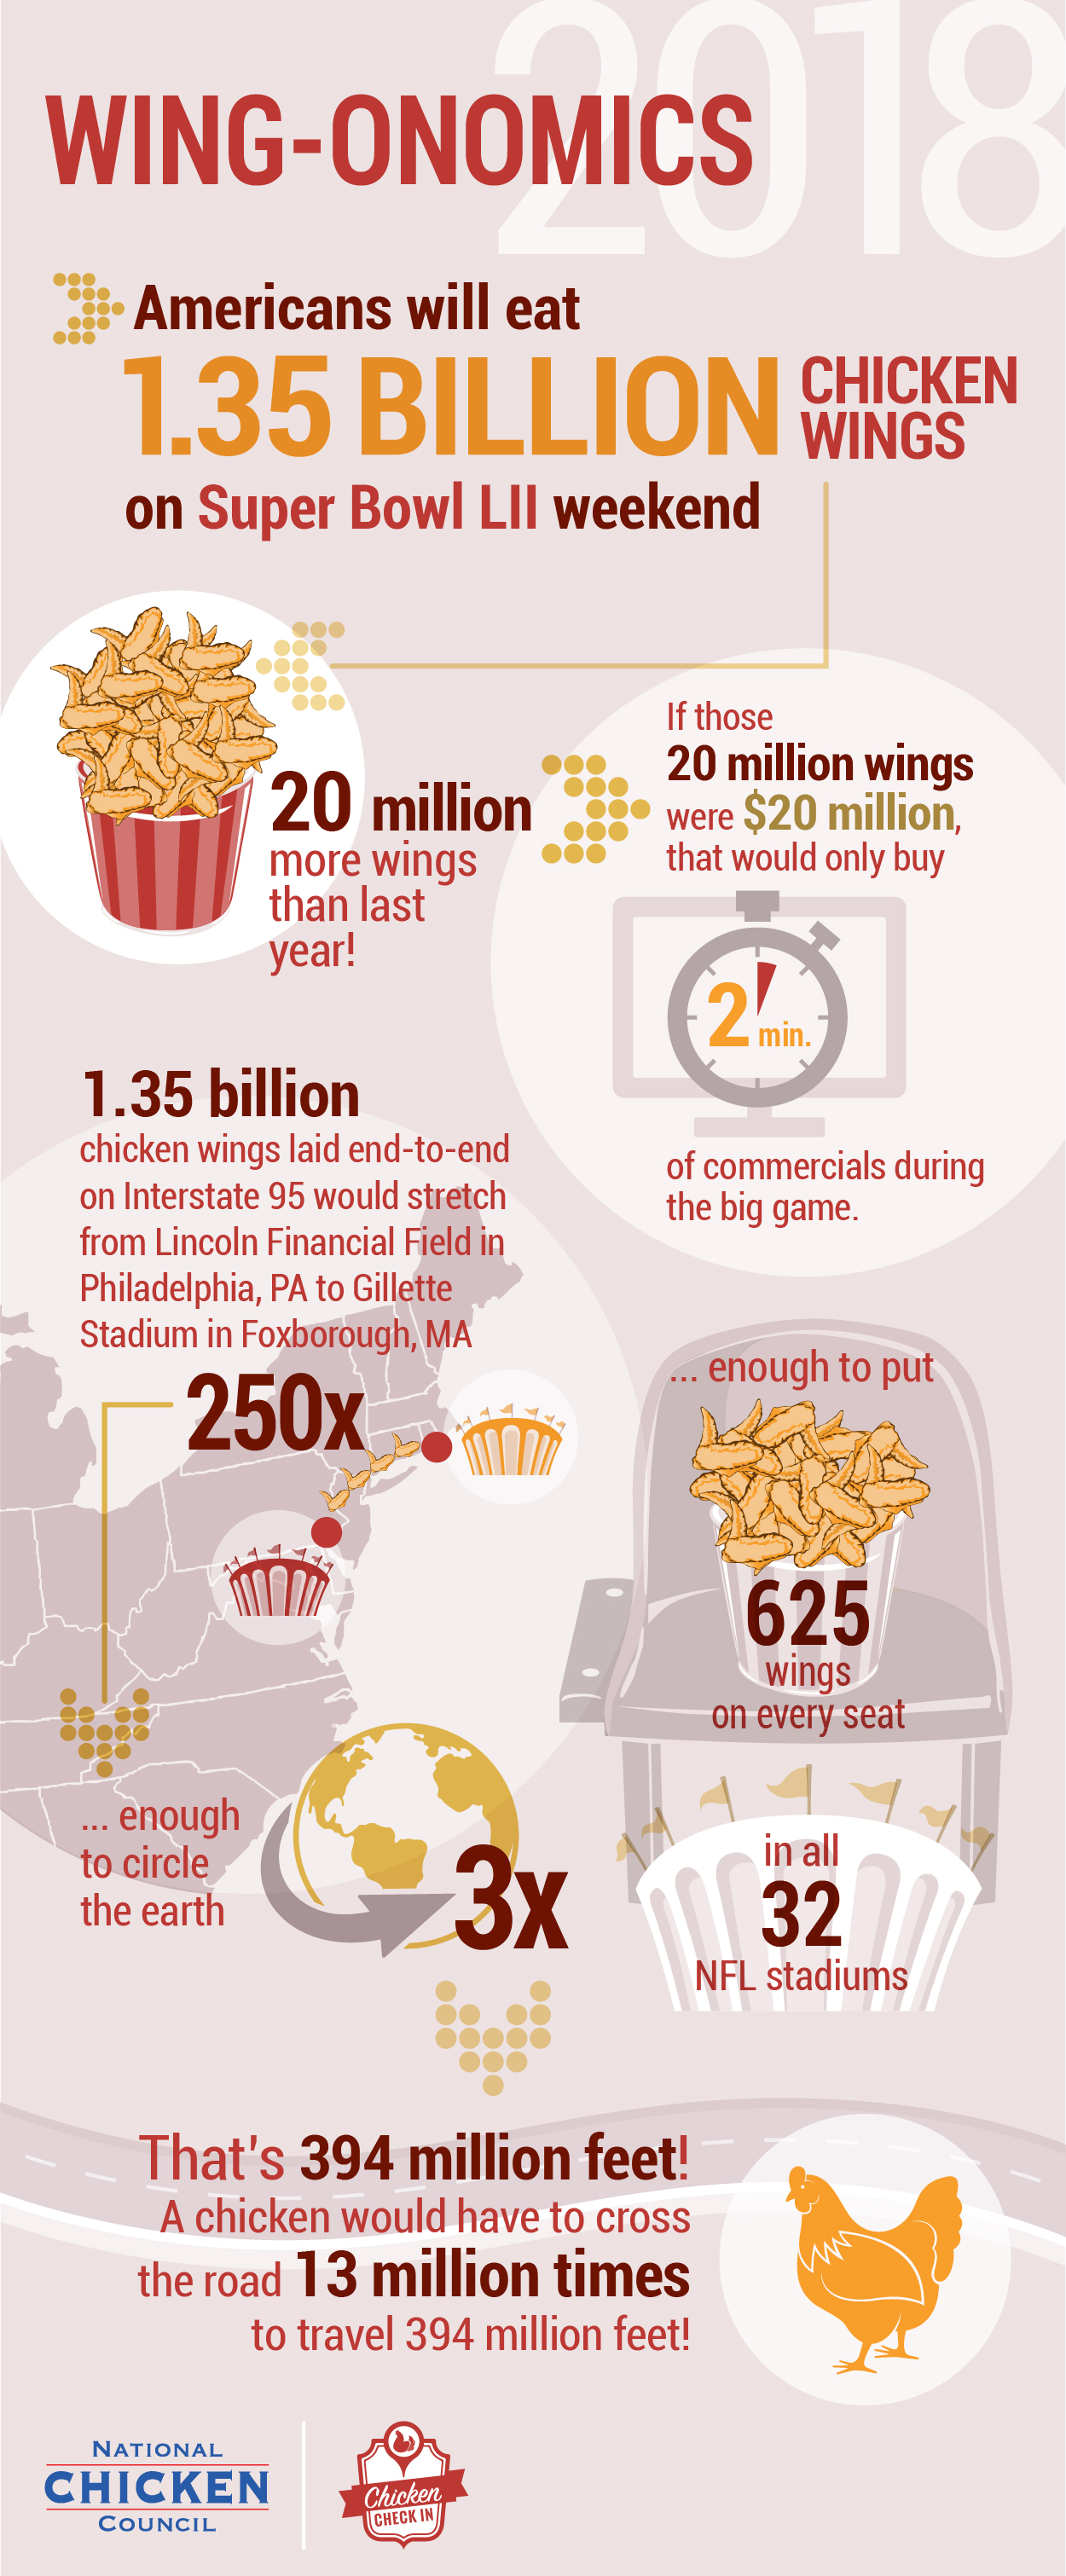
The National Chicken Council today released its annual Chicken Wing Report, which projects Americans’ consumption of the unofficial menu staple of Super Bowl Sunday – the chicken wing. NCC’s 2018 report projects that fans will eat 1.35 billion wings during Super Bowl weekend, an all-time high, as the Philadelphia Eagles and New England Patriots battle for the Lombardi Trophy. That figure is up 1.5 percent, or 20 million wings, from 2017.
“There will be no wing shortage,” said National Chicken Council spokesperson Tom Super. “Whether you’re a fan of the left wing or the right wing, there’s no debate about America’s favorite Super Bowl food. Although we do anticipate an uptick in chicken cheesesteaks.”
To visualize how many wings that is…
- If 1.35 billion wings were laid end to end along Interstate 95, they would stretch from Lincoln Financial Field in Philadelphia to Gillette Stadium in Foxboro, Mass. almost 250 times.
- That is enough wings to put 625 wings on every seat in all 32 NFL stadiums.
- 1.35 billion wings is enough to circle the Earth three times.
- That’s 394 million feet of chicken wings – enough that a chicken could cross the road 13 million times.
- Americans will eat 20 million more wings this year. If wings were dollars, that would only buy us two minutes of commercials during the big game.
Fans choose sides
More than half (59 percent) of U.S. adults who eat chicken wings say they typically like to eat their wings with ranch dressing, according to a new National Chicken Council poll conducted online in January 2017 by Harris Poll.* The survey asked which dipping sauces or snacks chicken wing eaters typically like to eat with their wings. They could choose more than one option.
Ranch is once again the #1 side or sauce typically eaten with wings and its popularity has been growing steadily, up from 51 percent in 2014** and 56 percent in 2015.*** Only one-third (33 percent) like to eat their wings with blue cheese dressing.
The full rankings are: #1 Ranch (59 percent), #2 (tie) Buffalo/Hot Sauce (48 percent), #2 (tie) BBQ Sauce (48 percent), #4 Honey Mustard (35 percent), #5 Blue Cheese (33 percent), #6 Teriyaki Sauce (23 percent), #7 Sriracha (15 percent) and Nothing/”I eat them naked” (8 percent).
Wing eaters flock to bone-in wings
NCC asked wing eaters if they prefer to eat traditional, bone-in wings or boneless wings, and bone-in wings are widening the gap against their boneless cousin. According to the survey, 60 percent of wing eaters prefer traditional, bone-in wings while 40 percent chose boneless. In 2015, the spread was 54 percent vs. 46 percent, respectively. Boneless wings are typically white, boneless chicken breasts cut into strips, breaded or floured and tossed with Buffalo sauce.
This data parallels with recent research by The NPD Group, which found 64 percent of chicken wings served in restaurants are bone-in. Servings for the bone-in wings rose by 6 percent in 2017, while boneless wings declined at a similar rate.
Good Food Restaurant Scorecard
The Good Food Institute (GFI) released its inaugural Good Food Restaurant Scorecard, evaluating Nation’s Restaurant News’ top 100 restaurant chains in the United States on the breadth and depth of their plant-based menu options and how they promote plant-based eating.
Plant-based entrées are one of the fastest growing segments in retail and foodservice. According to Nielsen, retail sales of plant-based alternatives to animal-based meat and dairy grew 8.1 percent year over year in the period ending August 12, 2017. Nielsen also found that:
- 39 percent of Americans are trying to incorporate more plant-based foods in their diets
- 38 percent of consumers associate plant-based protein with positive health effects
- 23 percent of consumers want more plant-based proteins on store shelves
To track how this shift is playing out in the foodservice sector, The Good Food Institute analyzed the top 100 chains’ online and in-store menus from June-August 2017. Points were given based on the number of plant-based entrées, as well as how those entrées are marketed. In this first analysis, which will be conducted annually going forward, only 48 of the 100 companies offered plant-based entrées.
“Based on our analysis of the top 100 restaurant chains, the most striking takeaway is that most restaurants are missing out on an enormous business opportunity as more and more consumers seek out plant-based entrées,” notes GFI Director of Corporate Engagement Alison Rabschnuk. “Brands like Yard House, TGI Friday’s, and Wawa have made aggressive moves to attract and retain these plant-positive diners. Just this month, TGI Fridays rolled out the Beyond Burger to 450 restaurants in their fastest test-to-table menu change ever.”
According to Rabschnuk, “Research done by Nielsen suggests a major consumer shift towards plant-based foods, which are seen as more healthy and environmentally friendly. While consumers – particularly Millennials – have been moving quickly to embrace new plant-based restaurants and products, some restaurant brands have been slow to capitalize on the opportunity. A major objective of the Good Food Restaurant Scorecard is to highlight these opportunities for those chains currently not cashing in on this trend and to work with them to meet this growing demand.”
The scorecard, details about the survey, more information about this growing trend toward plant-strong eating, and a comprehensive database of restaurant-ready plant-based protein products can be found online at goodfoodscorecard.org.
Focus on New and High-Performing Menu Items
With restaurant traffic stuck between a one percent increase and flat for several years now, U.S. restaurant chains are turning to value deals, new menu items, or optimizing menus to focus on high performing items in order to drive more customer traffic, according to The NPD Group, a leading global information company. Total U.S. restaurant traffic ended 2017 flat and had it not been for a one percent increase in quick service restaurant visits, an increase primarily driven by chains, traffic would have declined, reports NPD, which continually tracks the foodservice industry.
Evidence that consumers are in fact looking for deals is that visits based on a deal offer, which represent 25 percent of all restaurant traffic, grew for the third consecutive year in 2017, up two percent from 2016. Non-deal visits, which represent 75 percent of all traffic, were down 1 percent in 2016 and 2017, finds NPD’s foodservice market research.
Historically, quick service restaurants (QSRs) have grown their business by offering lower priced eats in the form of combo meals and value menus. Over the past few years, lower priced offerings have not been promoted as frequently, but many restaurant chains are thinking that it’s time again to focus on value deals. The world’s largest restaurant chain launched a value menu in January, which offers items for $1, $2, and $3, and other chains will most likely follow suit in offering value deals this year.
New menu items are another way to get the attention of consumers, says NPD, and major chains welcomed in 2018 with a variety of menu introductions.
“New items will drive traffic because there is a large group of consumers who are curious and want to try something new,” said Bonnie Riggs, NPD restaurant industry analyst. “They’ll try it once and if it’s really good, they’ll be back for more.”
In addition to new menu items, chains are optimizing their menus by eliminating less popular items and focusing on the higher performing menu items. This is not only an operational efficiency for the chain, says Riggs, it also makes it easier for them to better market the popular items on their menu.
“It’s clear that major restaurant chain operators are pulling out all of the stops to get consumers to visit this year,” she says. “They’re doing all of the things that historically have caught the attention of consumers and driven traffic and they’re hoping that it works again this year.”
Insider Indie Restaurant Survey
RestaurantOwner.com has released the report of their 2018 Independent Restaurant Outlook Survey. The report summarizes input gathered from over 880 independent restaurant owners and operators regarding their 2017 financial performance as well as their 2018 expectations.
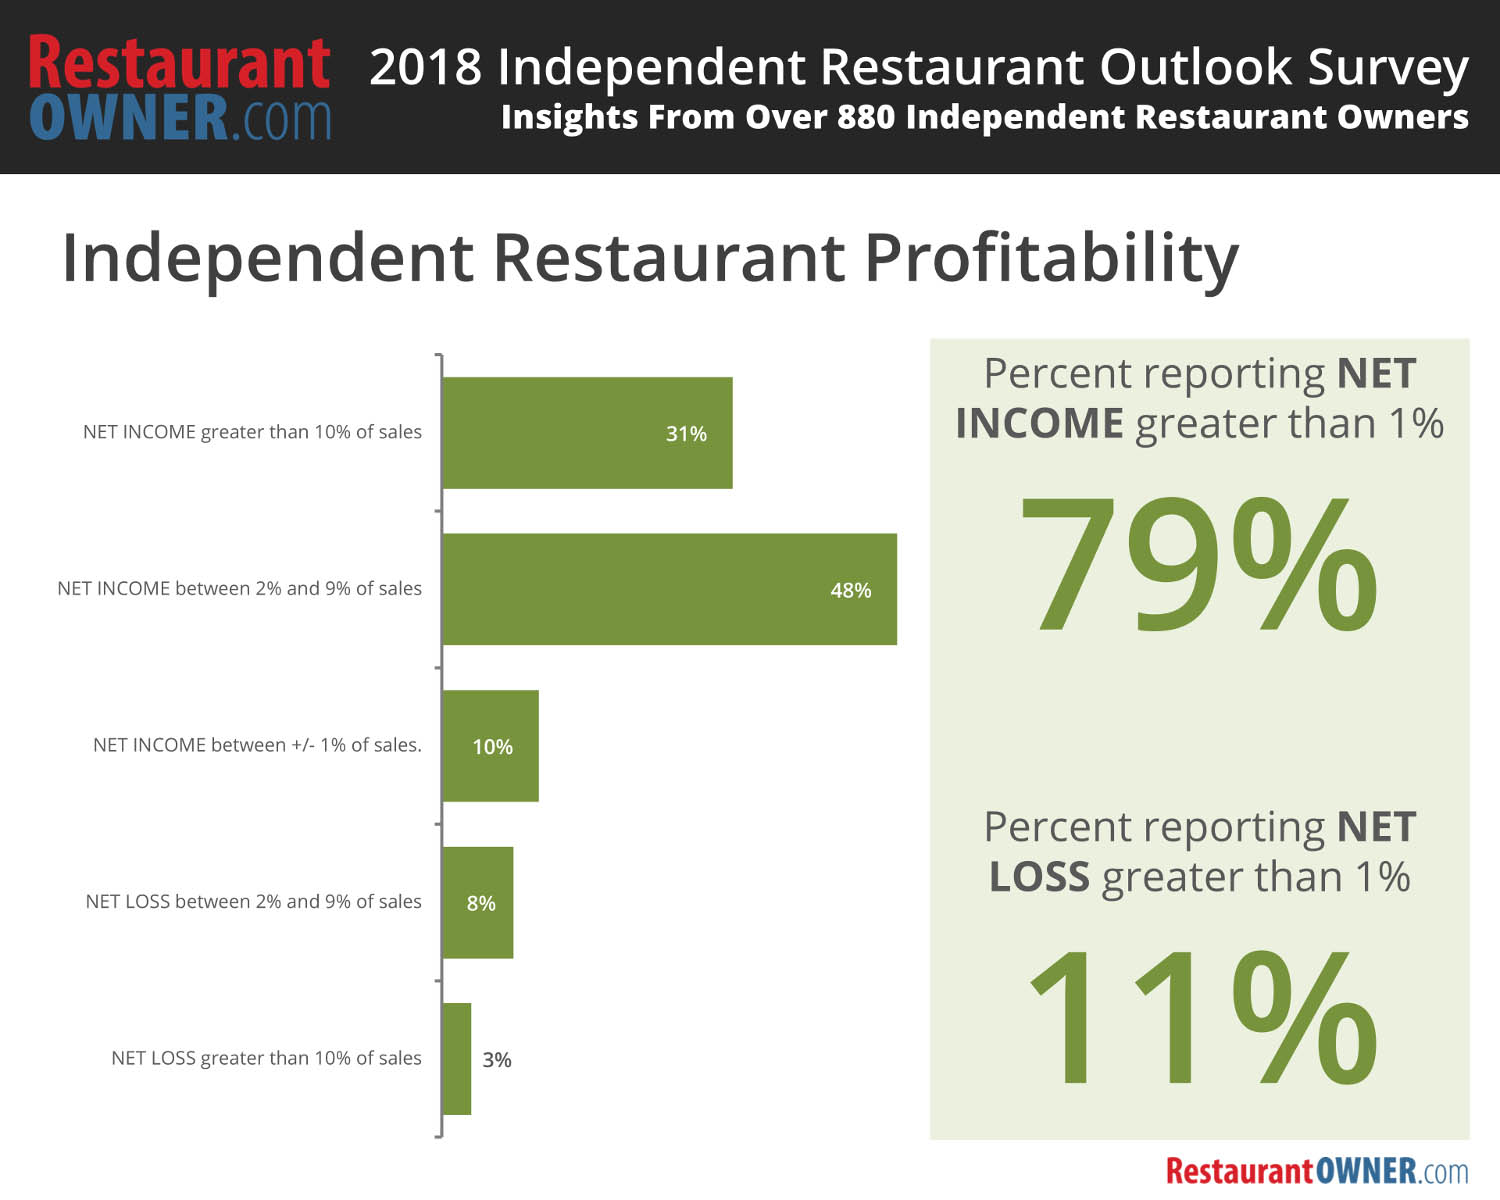
2017 was a profitable year for independent restaurants. 79 percent of the 882 responding independent restaurant owners or operators reported a net income greater than 1 percent of sales in 2017, of which, 31 percent reported a net income greater than 10 percent. Of those that were not profitable, approximately 10 percent broke even, while 11 percent reported a net loss greater than 1 percent of sales.
Profitability is on the rise as many independent restaurants performed better in 2017 than the previous year. 62 percent of respondents reported that their net income in 2017 outpaced their 2016 net income. Only 16 percent reported no change, and 22 percent reported lower net income in 2017 compared to 2016, indicating an overall upward trend in performance.
Independent restaurant operators are optimistic about 2018, and their optimism is trending upward. 65 percent of respondents indicated they are more optimistic about 2018 than they were about 2017. This is up from last year’s survey results where only 56 percent of respondents felt more optimistic about 2017 compared to 2016.
For operators who are optimistic, over half (68 percent) attributed their optimism to improved business practices or systems. Over half (61 percent) of those who are not optimistic attributed it to challenging labors costs.
Independent restaurant operator goals reflect their optimism for 2018. Most (82 percent) identified four or more goals, indicating a desire to improve and grow in the new year. Over 50 percent of respondents reported they intend to focus on improving profitability, business practices, guest experience, or staff training, or that they are going to reduce their costs in 2018.
Shifts in Loyalty
Political polarization and viral social movements like #grabyourwallet, #MeToo, and #TimesUp have dramatically changed the face of brand engagement and consumer loyalty, according to the Brand Keys 23rd annual Customer Loyalty
This is the first time since the Index was initiated nearly 25 years ago where basic tenets of consumer loyalty and engagement have been turned upside-down.
Engagement Index® (CLEI), conducted by the New York-based brand engagement and customer loyalty research consultancy (brandkeys.com).
“This is the first time since the Index was initiated nearly 25 years ago where basic tenets of consumer loyalty and engagement have been turned upside-down,” said Robert Passikoff, president of Brand Keys.
Biggest Shifts in Category Dynamics and Brand Leadership
This year the Brand Keys CLEI examined 84 categories and 761 brands – from Automotive and OTC medications to Computers, Fast-Casual Dining, Tax Preparation and Online Investing, Retailing, Smartphones, Cable and Broadcast News, and Alcoholic Beverages.
How consumers view a category, and how they compare competing brands, changed dramatically in 94 percent of the measured categories. That shift resulted in brand engagement and loyalty transformation and an accompanying shift in brand leadership of 58 percent.
“We’ve never encountered such value-adjustments before,” noted Passikoff. “But then, we haven’t seen this level of political polarization and social turmoil occurring at the same time since we began taking these assessments.”
Top Five Sectors Affected
In 2018, the top five sectors that showed the largest shifts in category values and path-to- purchase dynamics were:
- Instant Messaging
- Retail
- Broadcast and Cable News
- Online Investing
- Social Networking
What Drives Category Change? Political Tribalism or Social Activism?
The top five sectors reacting most to values like Personal Responsibility, Moral Order, Family Values, Fiscal Conservatism, and Established Social Structures, all associated with Political Tribalism were:
- Broadcast and Cable News
- Online Brokerage
- Banks / Credit Cards
- Automotive
- Hotels (luxury)
The top five sectors reacting most to values associated with Social Activism, including Empathy,
Equality, Empowerment, Individualism, and Pride, were:
- Retail (all sectors)
- Restaurants (all sectors)
- Social Networking
- Smartphones
- Consumer Packaged Goods
Entirely New View of What Consumers See as ‘Ideal’
“’Brand engagement’ is still defined by how well a brand meets the expectations consumers hold for the values that drive purchase behavior in a given category,” noted Passikoff. “But category political polarization and social activism have shaken those values to their core. If marketers think they knew what consumers’ ‘Category Ideals’ looked like before, they need to take another hard look, because consumers have an entirely new-view of what is an Ideal brand,” said Passikoff.
The Future of Successful Branding (Politically and Socially)
“Decision-making has become increasingly more emotionally-driven over the past decade,” said Passikoff. “But the addition of tribal political and activist social values has transformed the brand space into something marketers have never faced. ‘Business as usual’ won’t cut it in this brandscape.”
“We expect to see value and expectation shifts,” said Passikoff, “But we’ve never before measured anything on this scale! Fortunately, the integrated psychological nature of our research methodology allows us to identify newly resonant emotional values and to measure how they impact a given brand category. 2017 was the year that political tribalism and social activism rose to the top and will drastically change how successful branding will be done in the future.”
Brand Engagement Today. . . And Tomorrow
“The concept of brand engagement is pretty straightforward,” said Passikoff. “Consumers have an Ideal in mind for every product and service; it’s a yardstick to measure brands. Defining your category’s Ideal is where it gets tricky, as the process is not only more emotionally-based than rational, but is now confounded by newer, nuanced political and social values. And, while the recent Presidential election and its aftermath have raised levels of political debate, especially contentious issues and social activism, and has created far more value-infused and complicated paths-to-purchase for consumers.”
“The result is a massive change in what consumers want and equally massive gaps between what they want and what brands are seen as capable of delivering,” noted Passikoff. “Happily, brand engagement metrics can help identify and close that gap and help marketers stay on the path to profitability.”
2018 CLEI: #1 Brand(s) By Category
(** indicates NEW #1 brand this year)
CATEGORY BRAND
Airlines: Delta**
Allergy Medications: Allegra
App-Based Car Share: Lyft
Athletic Shoes: Reebok**
Automotive: Hyundai
Banks: Chase
Beer (Light): Miller Lite**
Beer (Regular): Coors
Bottled Water: Aquafina and Dasani**
Breakfast Bars: Nature Valley**
Car Rental: AVIS
Casual/Fast Casual Food: 5 Guys Burgers & Fries
Coffee (Out-of-Home): Dunkin’ and Starbucks
Coffee (Packaged): Dunkin’ and Green Mountain**
Computers (Laptops): Asus**
Cosmetics (Luxury): Dior**
Cosmetics (Mass): L’Oreal
Credit Cards: Discover
Deodorants Degree**
Energy Drinks: Red Bull
E-Readers: Kindle
Evening News: ABC**
Cable News: FOX
File Hosting: Dropbox**
Flat Screen TV: Samsung**
Gasoline: ExxonMobil
Headphones: Beats by Dr. Dre
Hotel (Economy): Wyndham Microtel**
Hotel (Midscale): Wingate
Hotel (Upscale): Hyatt
Hotel (Luxury): JW Marriott**
Ice Cream: Breyers**
Instant Messaging: WhatsApp**
Insurance (car): GEICO and USAA**
Insurance (home): Allstate**
Insurance (life) New York Life**
Lip Balm: Chapstick**
Major League Sports: MLB
Maj. Lg. Video Games: Minecraft**
MFP Office Copier: Konica Minolta
Morning News (Network): Good Morning America (ABC)
Morning News (Cable): FOX & Friends
Mutual Funds: Vanguard
Natural Food Stores: The Fresh Market**
Online Brokerage: Vanguard** and TDAmeritrade**
Online Music: Spotify**
Online Payments: PayPal
Online Retailers: Amazon
Online Travel Sites: Yahoo Travel**
Online Streaming Video: Netflix
Pain Relievers: Advil**
Parcel Delivery: UPS**
Pet Food (cats): Purina and Blue Buffalo**
Pet Food (dogs): Iams**
Pizza: Domino’s
Price Clubs: Costco
Printers: Epson**
Quick-Serve Restaurant: Chick-fil-A
Retail (Apparel): Zara
Retail (Dept. Store): TJ Maxx**
Retail (Discount): Dollar General**
Retail (Home Improve.): Home Depot
Retail (Sporting Goods): Big 5 Sporting Goods
Search Engine: Google
Smartphone: Samsung**
Snacks (Potato Chips): Lays
Snacks (Tortilla): Doritos
Snacks (Cheese): Cheetos
Snacks (Corn): Bugles**
Snacks (Pretzels): Rold Gold**
Snacks (Nuts): Wonderful**
Social Networking: Facebook and Instagram**
Soft Drinks (Diet): Diet Pepsi**
Soft Drinks (Regular): Pepsi**
Tablets: Apple
Tax Preparation: Turbotax**
Tequila: Casa Noble**
Ticketing Services: Ticketmaster**
Toothpaste: Colgate
Toys: Lego
Vodka: Skyy**
Whiskey: Jack Daniels** and Johnnie Walker
Wireless Phone Service: AT&T Wireless
Yogurt: Chobani
For the 2018 CLEI survey, 50,527 consumers, 16 to 65 years of age from the nine US Census Regions, self-selected the categories in which they are consumers and the brands for which they are customers. Fifty (50 percent) percent were interviewed by phone, thirty-five (35 percent) percent via face-to-face interviews (to identify and include cell phone-only households), and 15 percent online.
Top Trends in U.S. QSR
Technavio’s latest market research report on the quick service restaurants market in the US provides an analysis of the most important trends expected to impact the market outlook from 2017-2021. Technavio defines an emerging trend as a factor that has the potential to significantly impact the market and contribute to its growth or decline.
One of the key factors resulting in the growth of the quick service restaurants market in the US is growing innovation and customization in the food menu. Customers at quick service outlets prefer fresh flavors and are willing to try existing food products with new exotic flavors. The millennials are the key consumers of fast food and are inclined to taste new cuisines.
The three emerging market trends driving the quick service restaurants market in the US according to Technavio research analysts are:
- Increasing innovations in food packaging
- Growing use of mobile applications
- Increasing innovation and customization of menu
Increasing innovations in food packaging
Owing to the growing focus on sustainability, vendors have started adopting new packaging designs. Environment-friendly productions and solutions ensure a reduction in global warming. Quick service restaurant owners develop innovative and sustainable packaging solutions for branding that is assisting in increasing footfall. Vendors in the corrugated packaging industry offer a wide range of packaging solutions for hot food, particularly for takeaways. These solutions combine innovative design with fine tuning for easy handling and consumption.
According to Manjunath Reddy, a lead analyst at Technavio for food service, “Pizza chains favor corrugated packaging due to their excellent insulation property. Recent developments include innovative pizza delivery cardboard container that compartmentalizes into four sections. Technological innovations in packaging are expected to drive the demand for fast food in the future. McDonald’s and Starbucks use sustainable packaging and have increased the use of reusable and recyclable substances.”
Growing use of mobile applications
Technology is an integral growth strategy that is used by vendors to increase their market shares. Leading quick service restaurants chains integrate their services with technology to provide customer satisfaction. Numerous online and mobile third-party delivery platforms such as Postmates, UberEATS, and Amazon Restaurants function as full-service restaurants. In the US, an escalating number of consumers are embracing mobile technology for food services.
Most consumers use mobile applications for convenience. Mobile applications assist in locating nearby stores for drive-thru or takeaway. These apps also offer updated menu, offers, and discount coupons to attract customers. Online payment and assured quick service provided by vendors reduce the time and increase convenience. The point of sale (POS) technology provides hassle-free quick services to customers. These apps enable consumers to customize snacks based on the number of calories of each food item.
Increasing innovation and customization of menu
Consumers look for new flavors and a combination of foods that have bold flavors and premium alternatives. Their tastes and preferences are evolving, and they are demanding more exotic cuisines for their meals. Millennials are inclined toward innovative and exotic flavored fast food, and they seek options to customize their food based on their calorie intake per day. Considering this tendency among consumers, various foodservice operators are adding innovative food items to their menu
“The primary reason for increasing customization is the rising importance of diet, irrespective of medical condition or nourishment confinement, food allergy, or weight reduction plan. Consumers prefer customized food items, which match their taste. Many foodservice vendors provide customization options so that consumers can customize a range of ingredients including freshly baked bread and the preferred type of cheese and meats, jalapeño, bell peppers, spreads, and extra fillings,” says Manjunath.
Awards of Excellence
A variety of long time favorites and new winners are included in Sandelman’s highly coveted Awards of Excellence this year. Chick-fil-A, In-N-Out Burger, and Raising Cane’s are all repeat winners taking the top 3 places with the highest overall excellent ratings culled from 994,000 quick service restaurant occasions representing 76 U.S. media markets. Other repeat winners include Five Guys and the Habit. The remaining chains broke into the top 10 for the first time this year showing how consumers are appreciating a variety of different chain types that range from burger and chicken to pizza and sandwich.
Top Ten Quick-Service Restaurant Chains
(Ranked by Percent Rating Their Overall Experience “Excellent”)
|
1 Chick-fil-A |
64 percent |
What do these chains have in common?
Sandelman found that the top ten chains’ excellence is most correlated with taste and quality of the food and the strength of the brand. In other words, these chains excel because they have great tasting food and they’ve built trust and nurtured a personal connection with their users. While other factors like value, healthiness, or kid appeal can play a large role in the success of individual chains, taste and quality drive brand fanaticism.
Sandelman’s Quick-Track study monitors over 100 quick service restaurants on 19 aspects for food, service, worth, facilities, and brand appeal.
Culinary Trend Tracking
Throughout most of 2017 the food and beverage industry feasted on the momentum and innovation surrounding plant-based proteins. It was clear that increased consumer focus on vegan, vegetarian and flexitarian diets was influencing trends industrywide. But if 2017 was the year of plant-proteins, market research firm Packaged Facts predicts that 2018 will be the year animal-based protein makes a push to reclaim space on America’s center plate. Packaged Facts covers the market for animal-protein trends in Protein and Center Plate: Culinary Trend Tracking Series, a new report featuring more than a dozen areas of meat innovation.
Spurring the renewed focus on animal protein is increased creativity and novel approaches from food marketers and culinary visionaries.
“The rules about protein and the rules about center plate are being completely remade. As a result, neither protein nor center of the plate will ever be the same,” says David Sprinkle, research director for Packaged Facts. “In short, 2018 won’t be the year of your daddy’s steak or burger.”
Where once there were steaks and chops and chicken breasts, there are now novel nose-to-tail cuts such as culotte, short ribs, shoulder, neck and thighs—more value-conscious and comforting, but also more adaptable to cheffy culinary flourishes and global inspirations.
Burgers and meatballs keep gaining traction and consumer appeal, branching out beyond beef to introduce lamb, pork, duck and more. Sausage and charcuterie are flourishing, as chefs seek to burnish their culinary cred and use up every bit and scrap of the animal to an increasingly adventurous audience. And everywhere there is spice and innovation and novelty, from chile-laced Korean fried chicken to foie gras to worldly dumplings offering such as dim sum.
Lesser-known sustainable seafood choices such as trout and octopus are taking over where salmon and swordfish became predictable or ecologically problematic. Seafood preps favor the healthy and transparently fresh, including (as with meat) raw and tartare.
Even the familiar egg has taken off on a trajectory of its own, in familiar or exotic standalone specialties such as Benedicts and okonomiyaki, or deviled on small plates that move this workhorse protein miles beyond breakfast. Meanwhile, over easy or sunny side eggs are almost topping everything, including donuts, sandwiches, and vegetarian bowls.
2018 Food & Beverage Beat
LANE, a Finn Partners Company, released its 2018 Food & Beverage Beat. The agency’s ninth annual report reveals trends that are rising – and some that are receding – in the food and beverage industry in the year ahead. LANE tapped six experts to weigh in on issues that will resonate with consumers and the industry, from flavors that will dominate menus, to the implications of price versus value, to perceptions about beer in cans.
“The food and beverage industry is a constant source of innovation and inspiration. Chefs, proprietors and producers are constantly evolving their offerings to not only meet the changing tastes of consumers but deliver some unexpected surprises that capture the imagination and grow into the next big thing,” said Wendy Lane Stevens, managing partner at LANE. “We’re excited to share what some influential voices consider to be critical to the direction of the industry in the coming year.”
Key findings indicate continued focus on individual, environmental health
Ethnic foods provide an introduction to a wide variety of flavors, textures and preparations, and consumers will be hungering for new culinary experiences in 2018. Experts think exploration of ethnic cuisines will increase, particularly with culinary offerings from regions in the Middle East, Africa and Southeast Asia that have been relatively underrepresented. As a result, diners can expect to encounter more spice and more vegan and vegetarian options. Additionally, this exploration dovetails nicely with Americans’ desire to adopt more plant-based foods into their diets, for both health and environmental reasons. Restaurants should do their part, as some adopt efforts to “close the loop” by composting food waste to grow fresh produce for their establishments.
The seemingly growing disparity between America’s haves and have-nots should also command attention in the coming year as it relates to diet, nutrition and overall health. Panelists anticipate more discussion around price and nutritional value, as well as the trade-offs of low-cost food in terms of health issues such as obesity and diabetes. While this may be the year for Americans to head back to the kitchen to cook something good, it will be important to recognize the barriers facing those without the means to take advantage of better-for-you ingredients.
Some additional trends and issues anticipated to take center stage in 2018 include the following:
- A slight shift away from prescribed diets and toward more intuitive eating and drinking as consumers start paying closer attention to what their bodies indicate they need.
- Persistent popularity of meal planning and meal prep services as consumers continue to be pressed for time but are inspired to cook meals at home that are simple, nutritious and delicious.
- Greater attention paid to hard cider, craft beer in cans, Pacific Northwest wines and a Brazilian spirit, cachaça.
- Continued importance of technology in driving consumers to try restaurants, bars and other establishments, but balanced by an increased realization that loyalty depends on creating an individualized experience and customized feel.
LANE drew upon the expertise of half a dozen individuals with unique perspectives on the industry, who weighed in with viewpoints from the culinary, medical and media fields.
Valentine’s Day Stats
For those looking to take someone special out for a romantic meal this Valentine’s Day, OpenTable, is calling on diners to lock in their reservations this weekend based on new insights from its Valentine’s Day dining data[1].
According to 2017 Valentine’s Day dining data, OpenTable has seen that Valentine’s Day reservations are made on average 11 days in advance of the holiday. This marks Saturday, February 3rd as ‘ValenDine’s Day,’ and makes this weekend the perfect time to book Valentine’s Day reservations.
Other Valentine’s Day data insights include:
- 11:00 a.m. local time, 11 days in advance, was the most popular time to search for and book reservations for Valentine’s Day.
- Italian topped the list as the most booked cuisine followed by American / Contemporary American and Steakhouse.
- The most popular reservation time for Valentine’s Day was 7 p.m.
- Almost 50 percent of reservations were booked via mobile.
- Approximately 40 percent of reservations were booked in the week leading up to the holiday.
“Snagging a Valentine’s Day reservation ahead of time is the way to go – diners can avoid the last-minute scramble and focus their efforts on planning the rest of this special day,” said Caroline Potter, Chief Dining Officer at OpenTable. “But whether you book on ValenDine’s Day or even last minute, finding a terrific table to celebrate the occasion is just a few taps away — wherever you are.”
EcoFocus Trend Study
Evergreen Packaging®, released a report based on data from the annual EcoFocus Trend Study, which forecasts key trends that will shape the U.S. food and beverage industries in the year ahead. Now in its eighth year, the EcoFocus Trend Study examines how consumer attitudes, actions, preferences, and values are reshaping grocery purchasing decisions.
“Our partnership with EcoFocus Worldwide is driven by our deep commitment to provide our customers with insights that enable them to identify opportunities in the market that help them build their businesses,” said DeWitt Clark, Vice President of Sales and Marketing North American Packaging for Evergreen Packaging. “We are excited to share some results from this year’s study, which identified four emerging trends we believe will have a significant impact on the U.S. food and beverage industries in 2018, creating new product, brand, and communication opportunities.”
The four key trends identified by the study are as follows:
- Authenticity becomes priority.
New consumer segment called “Fresh Authentics™” emerges.
Authenticity has long been a strength for certain grocery brands and is now trending as a priority for grocery shoppers in 2018, impacting brands across all categories. Beyond health-conscious shoppers, an emerging segment of shoppers is seeking brands that they believe are authentic and products that they believe will offer an authentic experience. These shoppers – deemed “Fresh Authentics™”– embrace healthy, clean, and sustainable foods, beverages and packaging. Of the more than 4,000 grocery shoppers who participated in the study, 11 percent were defined as Fresh Authentics™, and the segment is expected to grow in size and influence. - Packaging becomes an integral part of the ingredient list.
As more shoppers are choosing authentic foods and beverages, they are gravitating toward packaging that they believe is authentic as well: clean packaging that helps retain the good taste and nutrition of foods and beverages naturally, without preservatives, and that does not leave undesirable chemicals in the products. The study found that 64 percent of grocery shoppers reported changing what they buy to reduce exposure to chemicals in food or beverage packaging. - Certifications communicate authenticity and establish trust.
Companies will earn shoppers’ trust through transparency and commitments to desirable food and beverage business practices in 2018. The study found that 46 percent of grocery shoppers reported avoiding purchasing products from companies after learning that their business practices were not environmentally responsible, up six percentage points from 2011. One way to clearly communicate authenticity and establish trust is through recognized third-party certifications. - Consumers are seeking authentic store brands from retailers.
In 2018, shoppers are seeking retailers who stand behind their corporate commitments and who can help shoppers sort through the thousands of products on the shelves to make healthy and eco-friendly choices easier and accessible. Demand for healthy, clean and sustainable choices is driving movement to trusted store brands that deliver these attributes. According to the study, 68 percent of grocery shoppers said it is ‘very important’ to shop at a grocery store that makes it easy for them to make healthy choices.
“The study results illustrate that the movement toward fresh, high-quality, natural foods and sustainable packaging is continuing to gain momentum for all grocery shoppers, and is already a lifestyle for the Fresh Authentics,” said Linda Gilbert, study author and chief executive officer of EcoFocus Worldwide. “For brands that possess these advantages, it’s more important than ever before to clearly communicate these values to stand out on the crowded grocery shelves and aid consumers in their purchasing decisions.”
The Why Behind the Buy
Birth rates are declining, the population is aging and for the first time ever, five distinct generations of shoppers are in the grocery aisles, each with their own set of characteristics and attributes that influence shopping behaviors. Research released today in the 14th edition of The Why? Behind The Buy™ from Acosta provides insight into how each generation is changing the grocery landscape and how brands and retailers should adapt.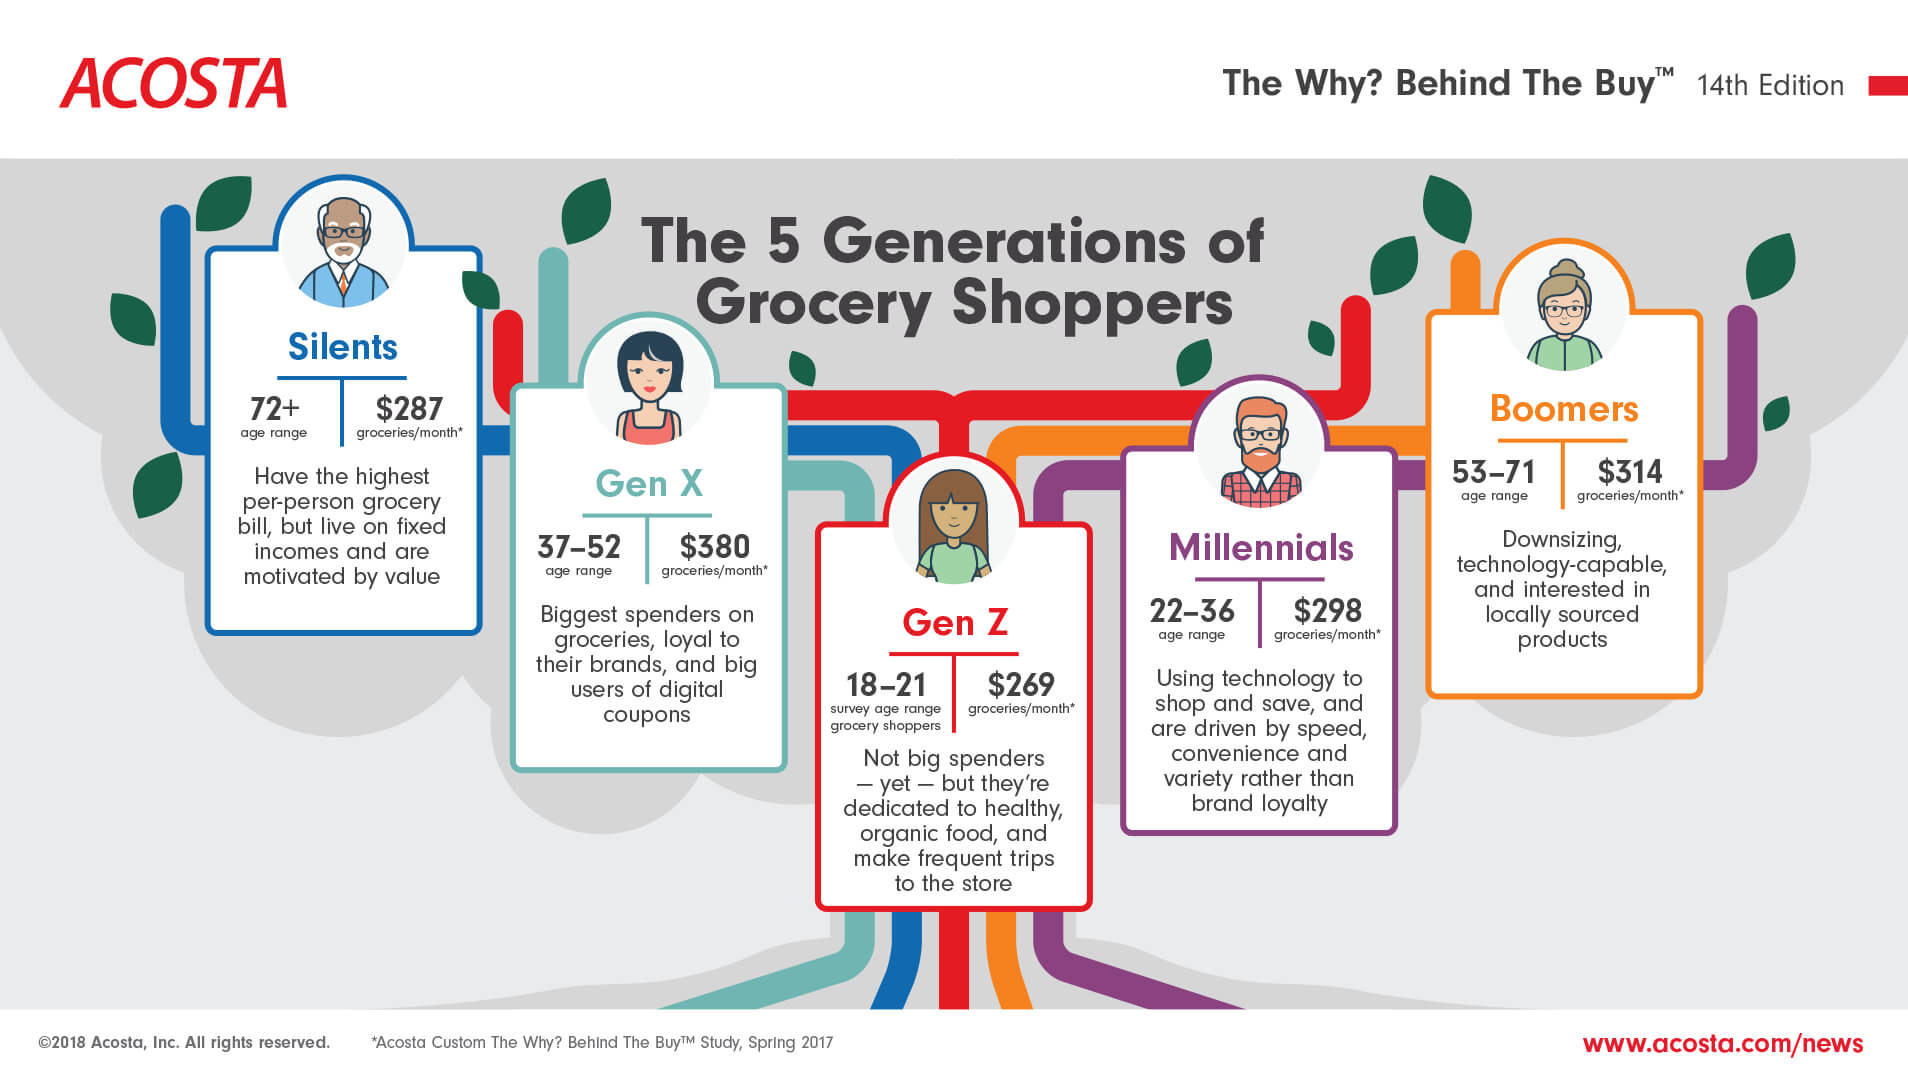
“Life stage dictates spending, putting Gen X on top for now, but Millennials will likely take over that spot within the next decade while Gen Z emerges as an influencer in grocery spending,” said Colin Stewart, Senior Vice President at Acosta. “As we kick off 2018, it is vital that brands and retailers not only understand what influences each generation’s shopping habits now, but how demand will change as generations move into different phases of life.”
Acosta’s The Why? Behind The Buy includes a comprehensive breakdown of each generation with key statistics from each life stage:
Gen Z: Emerging Influencers (Ages 12-21; Gen Z Shoppers Ages 18-21)
Not being in the working world yet, Gen Z shoppers (18-21) reported spending the least on groceries each month, averaging $269.
Gen Z has never experienced life without the internet and 42 percent of Gen Z shoppers indicated they use a digital grocery list.
Gen Z and Millennial shoppers averaged the most grocery shopping trips each month across generations, with Gen Z making 4.5 routine grocery trips a month.
Millennials: Selective Spenders (Ages 22-36)
Millennial shoppers spend an average of $298 monthly on groceries.
This generation is not yet brand loyal — 48 percent agreed they don’t care which brand they buy, and will switch when they find a better deal.
Sixty percent of Millennial shoppers use mobile apps for grocery coupons or discounts, significantly higher than any other generation.
Forty-six percent of Millennial shoppers have children under 18 in their household. Millennial parents spend an average of over $100 more per month on groceries than Millennials without children.
Gen X: Spending Big & Digital Adapters (Ages 37-52)
Gen X shoppers reported spending the most each month on groceries, averaging $380.
Many Gen X shoppers have embraced digital grocery tools — 70 percent reported redeeming a digital or mobile grocery coupon within the past month.
Two-thirds of Gen X shoppers indicated they enjoy preparing new dishes and 60 percent agreed they often check out new items in a grocery store.
Boomers: Still Driving Change (Ages 53-71)
While this generation is down-sizing, they still spend an average of $314 each month on groceries.
Boomer shoppers are brand loyal, and are buying 82 percent of the same brands that they bought in the prior year.
These shoppers are also loyal to their grocery store: 93 percent of Boomers reported shopping most often at the same grocery retailer as last year.
Silents: Spending on Groceries (Ages 72+)
Silent shoppers reported spending an average of $287 monthly on groceries, which also reflects the highest household grocery spending per person across all of the generations.
This generation also spends the least amount of their total monthly food budget on eating out.
Silent shoppers focus on value and are big redeemers of coupons, as nine in 10 reported redeeming a paper coupon for a grocery item within the past month.
The Why? Behind The Buy 14th edition was produced with research using a nationally representative random sample of U.S. shoppers via Acosta’s proprietary ShopperF1rst™ online survey methodology.
Brain Health and Nutrition
Adults age 40-plus who say they eat healthy foods most of the time are twice as likely to rate their brain health and mental sharpness as “excellent” or “very good” compared to adults who rarely eat a healthy diet (77 percent vs. 39 percent), according to a new AARP consumer survey on brain health and nutrition. But only about one-third (35 percent) of adults surveyed reported eating nutritious and well-balanced meals “most of the time (five to seven days).”
“Maintaining a healthy diet is vital for good brain health and it is unfortunate that not enough people are aware of the risks associated with poor nutrition,” said Sarah Lock, AARP Senior Vice President for Policy, and Global Council on Brain Health (GCBH) Executive Director. “The results from this survey, along with the latest GCBH report on “Brain Food,” show how certain dietary changes can provide a good foundation for improving brain health.”
Key findings from AARP’s 2017 Brain Health and Nutrition Survey:
- Significantly more adults who ate the recommended daily amount of fruits and vegetables reported better brain health than those that did not. Most adults, however, are not getting the daily recommended servings in all five food groups. Moreover, one-third did not consume the recommended amount in any food group.
- Nearly nine in 10 adults said they are likely to eat healthier if they knew it would lower the risks of cognitive decline (87 percent), heart disease (88 percent), and diabetes (88 percent).
- More than 60 percent of adults age 40 and older said that they would eat more fish, less red meat, and lower their dairy fat intake if they knew it was good for their brain health.
- Adults ages 40-54 were significantly more likely to cite barriers to healthy eating compared to adults ages 65 and older.
“The most common reasons people gave for not eating healthier included that it was too difficult, too expensive, they weren’t a “healthy foods type” of person, or their family wouldn’t like the taste,” said Lock. “Half of adults said they would be more likely to change their diet if their doctor told them to do it but only 37 percent said their doctor has spoken to them about their diet.”
New Recommendations on Nutrition’s Role in Brain Health
Long-term healthy eating habits promote good brain health, according to new consensus recommendations released separately today by the GCBH. The new report finds that a plant-based diet rich in fruits and vegetables is associated with better brain health, and eating fish and other seafood seems to benefit cognitive function. However, excessive alcohol, high levels of saturated fats, and high salt intake are all harmful to brain health. A heart-healthy diet is also a brain-healthy diet because high blood pressure, high cholesterol, and diabetes—all common conditions influenced by diet—harm both cardiovascular and cognitive health. And contrary to recent reports, GCBH recommends a healthy portion of skepticism for people who are drinking coffee, tea, and red wine expecting a brain health benefit until more evidence is developed.
Kids Food and Beverage Market
Perhaps more than any other consumer packaged goods segment, the kids food market requires marketers to take a dual approach to satisfy the needs and interests of both parents (as the purchasers) and kids (as the consumers). The influence of kids on the household grocery habits is well documented, but parents are becoming more determined to find a happy medium with products that satisfy the kids without sacrificing nutrition. And there’s a lot of money at stake, says market research publisher Packaged Facts.
Parents are becoming more determined to find a happy medium with products that satisfy the kids without sacrificing nutrition.
In the brand new report Kids Food and Beverage Market in the U.S., 9th Edition, Packaged Facts reveals that almost half (46 percent) of households with kids spend more than $150 weekly on groceries, compared to less than a quarter (22 percent) of household without kids. And as to be expected, weekly grocery expenditures only increase in accordance to the number of children in the household.
“In a competitive packaged food and beverage market, it’s important for manufacturers and marketers to better understand how to strengthen appeal among the category purchaser—the parent,” says David Sprinkle, research director for Packaged Facts. “To that end, food marketers must consider product qualities, dietary lifestyle characteristics, and diet claims to ascertain which attributes parents are most likely to seek out when buying foods and beverages.”
So what matters to parents when shopping for their kids? Packaged Facts’ research reveals that:
Fresh food and coupons are draws: Among parents, “fresh” food and beverages are the most sought after product quality, followed closely by products on special sale/promotion and store brands with lower pricing. The availability of a coupon could help parents rationalize a purchase for kids’ food and beverages products that are new and/or may not be enjoyed by the rest of the household.
There’s a focus on healthy food labels: Healthier/better-for-you claims and specialty brands with values are characteristics that emerge as more important to parents than those without children. Specifically, a third of parents seek out products from specialty brands with values they support—compared to barely 18 percent of those without kids.
GMOs a no-no, while Natural and organic are good to go: Parents are significantly more likely than average to seek out foods with specific inherent health qualities such as “all natural”, “non-GMO”, and “organic”—suggesting an overall “healthy” approach to one’s diet.
Free-from claims favored: Increasingly, many Americans are subscribing to a dietary lifestyle that eliminates gluten, dairy, allergens, and vegetarian/vegan as a way to approach health. While products that cater to these types of dietary lifestyles are not widely sought after, parents are more likely than average to do so.
Sugar-free is the way to be: While health trends are moving away from being diet-focused in favor of adopting a healthy lifestyle, some diet health food terms like no/low sugar continue to be sought after. Indeed, sugar has become the villainous ingredient many parents seek to avoid.
The Joy of Pizza
In the U.S., 74 percent of people order carryout or delivery pizza at least once a month.1 No surprise there. But what is surprising is that those people may be compromising the moods of themselves and the people around them by serving up pizza that was delivered or carried out. In an effort to determine which pizza makes for happier gatherings – delivery or fresh-baked from the oven – DIGIORNO® pizza decided to conduct a social experiment that measured the effect on the moods of partygoers. At a series of gatherings, DIGIORNO observed more joy when pizza was baking in the oven during parties than those that ordered carryout or delivery pizza.
Last year alone, nearly 80 percent of all online posts about carryout and delivery were not positive. That’s hundreds of thousands of pizza mishaps reflecting poor service, late arrival, cold pizza and wrong toppings from national chains.Since DIGIORNO pizza is fresh-baked from the oven, and doesn’t encounter the same issues as delivery, the brand tested the competition in a social experiment to find out which pizza party produced more happiness.
To conduct this experiment, DIGIORNO partnered with real people to host friends and family for a series of six pizza parties. During each gathering, the room was set up with more than 20 high-resolution hidden cameras that captured footage of guests. We compared the moods of partygoers while DIGIORNO pizza baked in the oven and when delivery was ordered from national chains.
Using facial recognition software, footage was then analyzed to identify patterns in emotion, such as smiles and frown lines, determining which pizza generated a more positive result. Measurements were based on the average change in reactions experienced before and after key pizza moments such as placing an order, arrival of delivery and the aroma of pizza filling the room. The results were clear: there was more joy observed at DIGIORNO pizza parties.
At pizza parties that baked up a DIGIORNO pizza in the oven, joy increased by an average of 27 percent. In comparison, at parties that ordered delivery, joy decreased by an average of 20 percent.
Other findings include:
Oven Ovation: When delivery pizza was ordered by phone or online, it made partygoers 24 percent less joyful – certainly not the same positive impact as placing DIGIORNO in the oven.
Baked Feels Better: Baking up a DIGIORNO pizza increased joy across gatherings, as partygoers were 17 percent more joyful when the smell of pizza filled the room and the oven timer rang. The arrival of delivery pizza at the door couldn’t compete as average joy increased only 2 percent.
Serving Up Satisfaction: Serving DIGIORNO pizza straight from the oven made our partygoers more joyful than delivery pizza served straight from a box. In fact, pizza being delivered caused a 28 percent decrease in joy.
Overall, from placing pizza in the oven to the aroma of it permeating the room, partygoers were more joyful at our gatherings that had DIGIORNO than those that relied on delivery.
“Our belief has always been that fresh-baked pizza helps people get more out of their occasions,” said Jeff Hamilton, President, Nestlé Foods Division, Nestlé USA. “This experiment was yet another chance for us to see how and why our pizza has that positive effect, especially at those same times when delivery might not.”
Drip Coffee Market Declining
According to Transparency Market Research, the global HoReCa drip coffee maker market is highly fragmented in nature. Strong presence of several players and low entry barriers are expected to make the competition highly intense in the forthcoming years. The declining growth rate of the global market is forcing companies to launch innovative products with impactful marketing strategies. Some of the key players operating in the global HoReCa drip coffee market are JURA Elektroapparate AG, Bunn-o-matic Corp, and Crem International AB.
According to the research report, the global HoReCa drip coffee maker market is expected to be worth US$352.7 mn by the end of 2025. During the forecast period of 2017 and 2025, the global market is expected to exhibit a CAGR of -0.4 percent. Regionally, the Middle East and Africa and Asia Pacific are expected show slightly positive progress in the global HoReCa drip coffee maker market during the forecast period. In terms of HoReCa type, the market is segment is into full service restaurants and quick service restaurants. Both these segments are expected to decline during the forecast period.
Drip Coffee Maker brews coffee by percolating hot water through a brew basket of coffee grounds. Coffee is captured in a decanter that may be heated by a warming plate. HoReCa drip coffee makers are being manufactured by the various large scale companies with plants, where they are packaged and supplied globally. The majority of European based manufacturers are supplying the products globally.
Despite Interest in Coffee Market Faces Challenges as Capsule Coffee Gains Momentum
Growing urbanization and development in the foodservice industry, the expansion of a number of MNC outlets/ local coffee chains are driving the market. Innovative coffee shops and tea houses are bringing late-night café culture to several countries globally. It has become a part of culture with the rising population of millennials being provided with essentials in the cafés such as wireless connectivity and serene and peaceful environment and also space to socialize. The allure of drinking a cup of coffee has become a part of everyday lifestyle or in some cases an addiction – of today’s growing number of millennial population. For youngsters, coffee shops have become a place to socialize which provides a clean, peaceful and serene environment. Coffee shops have become a part of coffee culture.
Some of the restraints that are potentially restricting the growth of HoReCa drip coffee maker market is the advent of new technologies and the consumer shift towards pod coffee and capsule coffee, which are some of the key roadblocks that have plagued the industry’s development over the years. Continuous innovations are taking place with introduction of state-of the-art technology driven coffee machines in the market. A single machine can brew different types of coffee nowadays and with superior quality and tasteful experience.
Preference for Automatic Machines Hamper Sales of Drip Coffee Maker Machines
Also at the coffee outlet’s end, the owners prefer to go for semi-automatic or fully automatic machines due to the ease of operations, lesser brewing time, and the wide variety of range which is available for the consumers as per their growing and changing demands globally. Furthermore, another prospective restraint of the HoReCa drip coffee maker market is the young population driving the market more for espresso coffee.
Yogurt Market and Innovation
In the brand new report The Yogurt Market and Yogurt Innovation, 3rd Edition, market research firm Packaged Facts estimates retail dollar sales in the U.S. yogurt industry were just shy of $9 billion in 2017. Sales increased at a compound annual growth rate (CAGR) of 2 percent between 2012 and 2017.
In recent years, U.S. consumers have embraced not only Greek yogurt, but have also taken to authentic, clean-label and organic versions, and to yogurt drinks, which are becoming more accepted with sales growing rapidly. Yogurts with new flavors and in new formats have also kept consumers interested in the category, and have helped broaden yogurt’s appeal as a breakfast item, snack, dessert, or meal replacement.
This sustained consumer interest in yogurt is forecast to spur the industry to continued sales growth looking ahead to 2022. Over the next five years Packaged Facts predicts yogurt drinks will continue to grow in popularity, with sales increasing to drive overall market gains. Meanwhile, major marketers will respond to opportunities in growth niches — particularly in plant-based, vegan non-dairy yogurt.
The Yogurt Market and Yogurt Innovation, 3rd Edition focuses on the market for yogurt sold to consumers in the United States through retail channels. The market is broken out into two categories: refrigerated yogurt (spoonable) and refrigerated yogurt drinks. Market size data are provided at the retail sales level for 2012-2017 and projections for 2018-2022.
The report covers all retail distribution channels that carry yogurt, including supermarkets and grocery stores, mass merchandisers and supercenters, warehouse clubs, specialty food stores, health/natural food stores, convenience stores, drugstores, dollar stores, and direct-sales channels such as online and mail order. Yogurt in other forms (frozen yogurt, yogurt dips, snacks, etc.) or yogurt sold in other venues such as foodservice channels, are not part of the formal scope of the market or included in sales quantification.
Power to Plants
Three out of 10 (28 percent) German consumers would like to see a wider variety of clearly labelled vegetarian and vegan confectionery, according to new research from Mintel. This number rises significantly to 46 percent of consumers aged 25 to 34.
Speaking at ProSweets Cologne 2018, Marcia Mogelonsky, Director of Insight, Mintel Food and Drink, commented on this trend during a panel on ‘the power of plants in snacks and confectionary’:
“A shift away from animal products is currently underway, as described by Mintel’s 2017 Global Food & Drink Trend ‘Power to the Plants’. After a boom in other categories, the vegan and vegetarian trend can now be seen in both chocolate and sugar confectionery. There has been a growth in non-dairy milk chocolate, while in sugar confectionery there is growing interest in vegetable-based gelatin – the ingredient that provides the ‘chew’ in chewy-textured candy. Gelatin is traditionally derived from animal collagen, so vegans, vegetarians, kosher and halal consumers are among the consumers seeking non-eat gelatin-based confectionery.”
The effect of the growing interest in vegan and vegetarian confectionery is already visible in new product development. According to Mintel Global New Products Database (GNPD), vegan confectionery product launches more than doubled globally, growing by 140 percent in the five years between 2013 and 2017. Vegetarian sweets have experienced a much smaller increase of 21 percent over the same time.
Given the high consumer interest in vegan sweets, a look at the German confectionery market reveals that consumer demand is already shaping product launch activity. Germany saw the most vegan confectionery launches globally over the past year, hosting 16 percent of global vegan confectionery launches in 2017. This is the result of significant new product development growth within this category in Germany: vegan new product launches in the sweets category have grown by 252 percent between 2013 and 2017.
Beyond the vegan trend, it seems that Germans have high expectations for their confectionary in general. Half of the German consumers (50 percent) say that there are not enough healthy sweets available, such as confectionary without artificial ingredients or with natural sweeteners. Furthermore, 51 percent of German consumers say that they would like to see a wider variety of ethical sweets, such as organic or fair trade chocolate.
Furthermore, Mintel research shows that Germans are the most likely among their European neighbours to indulge their sweet tooth: over two-thirds of German consumers (69 percent) report that they allow themselves the occasional treat. In comparison, only 56 percent of French consumers and 59 percent of Spanish consumers allow themselves a sporadic indulgence.
Global Walnut Market
Transparency Market Research observes that the competitive landscape in the global walnut market is highly fragmented due to the strong presence of several players. Furthermore, lack of entry barrier for new players is expected to further fragment the market and intensify the competition. Some of the prominent players operating in the global walnut market are Alpine Pacific Nut, Poindexter Nut Company, Guerra Nut Shelling Company, and Grower Direct Nut Co. Inc. To stay ahead of the competition companies are likely to make investments to improve their product grading facilities to meet international standards and consumer demands. Companies are also expected launch innovative walnut-based products to lure in a wider consumer base. Expanding businesses to international markets through various distribution channels will be a key expansion strategy of the companies.
According to the research report, the global walnuts market was valued at US$6,197.1 mn in 2017 and is expected to reach a valuation of US$8,534.5 mn by the end of 2025. During the forecast years of 2017 and 2025, the global market is expected to rise at a CAGR of 4.1 percent. Out of the two categories, the shelled walnuts are expected to lead the global market as the segment is slated to exhibit a CAGR of 4.4 percent during the forecast period. Geographically, Asia Pacific held a share of 54.7 percent in the global walnut market in 2017 and is expected to dominate the global market in the forthcoming years.
Widening Application of Walnuts and Rising Disposable Income of Middle Class to Spike Demand
Walnuts are being exhaustively used as an ingredient in the food industry, pharmaceutical industry, personal care and cosmetics industry which is supporting the market growth in the near future. Due to an increasing lactose intolerant population across the globe, consumer demand is shifting more from cow’s milk to nut based milk, leading to a substantial increase in the consumption of walnut milk, owing to its lactose-free characteristics.
Increasing consumer inclination towards maintaining a healthy lifestyle has led to the higher consumption of healthy food products and food ingredients. Off late, consumers have become more conscious about their food intake and diet. There has been a significant rise in the consumption of tree nuts, which include almonds, pistachios, hazelnuts, walnuts, cashew nuts, etc., over the past few years, primarily supported by a shift towards healthier eating habits and preferences among the fast-growing middle-class section of consumers, especially in developing countries.
Furthermore, government bodies and various private companies are creating more and more awareness among consumers regarding the health benefits of edible nuts, including walnuts, almonds, pistachios, and hazelnuts, which thereby, is resulting in further growth of the market. Moreover, increasing walnut demand and usage in various industrial sectors like food, pharmaceuticals, personal care and cosmetics as an ingredient are some of the important factors that are expected to drive the growth of global walnut market over the forecast period.
Poor Vertical Integration amongst Manufacturers to Hamper Market Growth
Some of the restraints that are lack of vertical integration in the manufacturers of the walnut and products plagued the industry’s development over the years. This has also led to an increase in the prices of the walnuts reaching after different processing destinations to the consumers. Furthermore, another prospective restraint of Walnuts market is the cultivation of walnuts is surrounded by specifications required for flourishing of the plant.
Vodka Challenges
The vodka category is facing a number of challenges in markets around the world, from long-term decline in traditional destinations to threats from dynamic rival spirits sectors in Western countries, a new report warns.
Released last month, the Global Vodka Insights report from just-drinks and the IWSR illustrates the complex nature of current trends in vodka, with traditional, high-volume countries continuing to decline, but higher-priced brands still displaying some growth potential.
While global vodka sales in 2016 fell 3.4 percent to 461.3m cases, standard-and-above products grew by 2 percent to 133.6m cases, reversing the declines of the year before.
The next five years are poised to mirror these trends: while declines for the overall category are set to accelerate slightly, slow growth will continue at higher price-points.
Much of the volume decline comes from Russia, the CIS countries and Eastern Europe, but the report sees worrying signs of stuttering growth in previously buoyant Western markets.
In the US, the flavoured market has been hit hard in recent years, while rivals such as whisky and Tequila are currently doing a better job of engaging with consumers – especially Millennials.
Vodka remains the largest spirits category in Europe, but growth has proven elusive since 2008, mainly thanks to contractions in the large Polish market.
Nonetheless, declines are now forecast in the UK, and the report warns that, if vodka does not “grow up”, developing new ways of showcasing its distinctive characteristics and evolving a fresh innovation agenda, it risks being left behind by trendier rivals such as gin.
Small Businesses and Social Media
More than one-third (36 percent) of small businesses do not have a website, according to the websites section of the fourth annual Small Business Survey conducted by Clutch, a B2B research firm. One in five small businesses (21 percent) selectively use social media instead of a website in an effort to engage customers.
The survey indicates that small businesses consider cost a bigger concern than the potential repercussions of not having a website.
Social media platforms such as Facebook and Instagram attract small businesses by cultivating a highly engaged user base.
However, relying solely on social media may be a risky strategy for businesses.
“Whenever you put all of your eggs into someone else’s basket, it’s risky,” said Judd Mercer, Creative Director of Elevated Third, a web development firm. “If Facebook changes their algorithm, there’s nothing you can do.”
Facebook recently announced changes that potentially increase the risk of using social media in place of a website. The social media platform plans to prioritize posts from family and friends over posts from brands.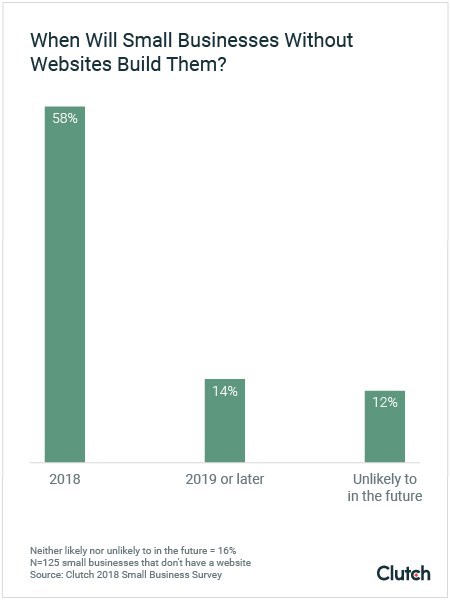
This new policy may make it more difficult for small businesses to reach their audiences through social media. As a result, websites are expected to regain importance among businesses – as long as cost is not considered an obstacle.
Among small businesses that do not currently have a website, more than half (58 percent) plan to build one in 2018.
Some Small Businesses Say Website Cost is Prohibitive, But Others Cite Costs of $500 or Less
More than a quarter (26 percent) of small businesses surveyed say cost is a key factor that prevents them from having a website. However, nearly one-third of small businesses with websites (28 percent) report spending $500 or less.
Small businesses may not be aware that some web development agencies offer packages that defray costs by dividing website construction into multiple phases or sliding rates for small businesses. “You don’t necessarily need to launch with your first-generation website,” said Vanessa Petersen, Executive Director of Strategy at ArtVersion Interactive Agency, a web design and branding agency based in Chicago. “Maybe just start small.”
Mobile-Friendly Websites Becoming Standard
Businesses that do have websites are moving en mass to mobile friendly ones, the survey found. Over 90 percent of respondents said their company websites will be optimized for viewing on mobile devices by the end of this year.
In addition to the 81 percent of company websites that are already optimized for mobile, an additional 13 percent that say they plan to optimize for mobile in 2018.
Clutch’s 2018 Small Business Survey included 351 small business owners. The small businesses surveyed have between 1 and 500 employees, with 55 percent indicating that they have 10 or fewer employees. To access the report, click here.
According to new research from Clutch and Ignite Visibility, more than 90 percent of businesses that invest in SEO also invest in social media.
The survey of 303 marketing decision-makers at U.S. businesses reveals that most tend to shape their SEO strategy based on the SEO services they prioritize and the challenges they face.
Two factors impact the direction of a business’ SEO strategy: The shifting customer journey and whether the business focuses on paid search or organic SEO services.
Organic SEO services include:
On-site optimization – web design, site infrastructure, blogging
Off-site optimization – content marketing, social media marketing
Over 40 percent of businesses that invest in SEO focus on organic services, compared to 19 percent that focus on paid search.
Businesses that focus on organic SEO are more likely to use in-house staff for general marketing, such as content marketing and social media. Over three-fourths (76 percent) of businesses that focus on organic services use in-house staff.
On the other hand, businesses that focus on paid search are more likely to hire an SEO company. More than two-thirds (68 percent) of businesses that focus on paid search hire an SEO company, compared to just 37 percent that rely on in-house staff.
Paid search complements organic SEO by providing feedback on keyword research, audience targeting, and effective ad copy, said Eythor Westman, head of paid media at Ignite Visibility.
How businesses adapt to shifts in the customer buying journey is another factor that shapes SEO strategy. The rise of mobile search drives changes to the customer buying journey.
SEO experts agree that customers use their mobile devices to learn about a company through social media and site content before converting to make a purchase.
“Now, somebody Googles a keyword. Then they click on a top ranking term like, ‘SEO company.’ They read our blog and click around social media,” said John Lincoln, CEO of Ignite Visibility. “Then, they convert three weeks later after they feel comfortable with you.”
In response, businesses prioritize SEO services that facilitate the customer journey. Along with social media (20 percent), businesses rate creating content to earn links (15 percent), and mobile search optimization (14 percent) as their top SEO priorities. For the SEO Survey, click here.
Instagram Influence
New research released by Carusele and TapInfluence uncovered some surprising results about how influencers feel about various platforms heading into 2018.
Of the 790 influencers surveyed, none answered Snapchat to the question, “What is your favorite channel to use for branded content?” Personal blogs were the favorite of 36 percent of respondents, followed closely by Instagram at 35 percent and Facebook at 12 percent. Twitter (9 percent), Pinterest (6 percent) and YouTube (1 percent) also received votes.
Even when asked to name their second favorite choice, Snapchat collected fewer than 1 percent of the responses, while Facebook ranked first at 26 percent and Instagram second at 25 percent.
“Two things are clear from this part of our survey,” said Jim Tobin, president of Carusele. “The first is that blogs aren’t going anywhere, which I think is a good thing for both brands and influencers. And second, Instagram’s moves over the last year or two have really outmaneuvered Snapchat, which had been a hot platform for creators two years ago.”
Influencers also plan to be in the space for the long haul, with 97 percent of influencers surveyed planning to continue their work “as long as I’m able.” This despite fewer than half surveyed reporting working full time in the vocation (46 percent) while 24 percent work full time elsewhere and 13 percent part time elsewhere. The balance report being full time parents or caregivers.
“Our earlier research legitimized influencer marketing as a sales driver. This new research supports the fact that it remains a viable career option for content creators,” said Promise Phelon, CEO of TapInfluence. “We also found that 91 percent of influencers say brands work with them to ensure FTC compliance most or all of the time, so the guidelines around the industry have taken hold as well.”