
According to a Recent Study/Survey … End-of-February 2018 Edition
20 Min Read By MRM Staff
This edition of Modern Restaurant Management (MRM) magazine’s “According to …” research roundup includes insights on travel bragging, underestimating the creep factor, clogged toilets and the power of protein.
The Weather Report
The month of February has shown that cold weather is here to stay, as freezing temperatures continue to hit states across the country. Data from CAKE shows that inclement weather does have an effect on restaurant revenue, even in states that are known for snow and ice storms.
- In New York, Massachusetts and Illinois average revenue per restaurant grew YOY from 2016 to 2017, but January and February were both the lowest revenue months between October – April for both years in all three states.
- In New York, Massachusetts, Illinois and Pennsylvania the average drop in revenue between December to January was $13,218.20, or, 23 percent drop in average revenue per restaurant.
For restaurant owners experiencing the negative effects of winter weather, this is a great time to think about promotions or special discounts for those that trek (safely!) through the snow to their favorite neighborhood spot, or even consider implementing “winter hours” to reduce operating costs and ensure staff can commute safely, CAKE suggests.
Great American Beer Bars
With more than 6,000 small and independent craft brewers operating throughout the country, beer lovers have a bevy of options to indulge and delight in their favorite beverage. To help enthusiasts take advantage of where to find palate-pleasing pints in every state, CraftBeer.com—the Brewers Association’s website for beer lovers—surveyed its readers for its annual list of Great American Beer Bars.
“CraftBeer.com readers have an extensive level of insight on what makes a beer bar truly stand out,” said Jess Baker, editor in chief, CraftBeer.com. “The Great American Beers Bars, selected by nearly 8,000 individual nominations cast by CraftBeer.com readers, are each stewards of quality craft beer and beer service. These outstanding beer bars, taprooms and brewpubs introduce their customers to new and exciting beer experiences, and have been integral to the success of the independent craft brewing movement.”
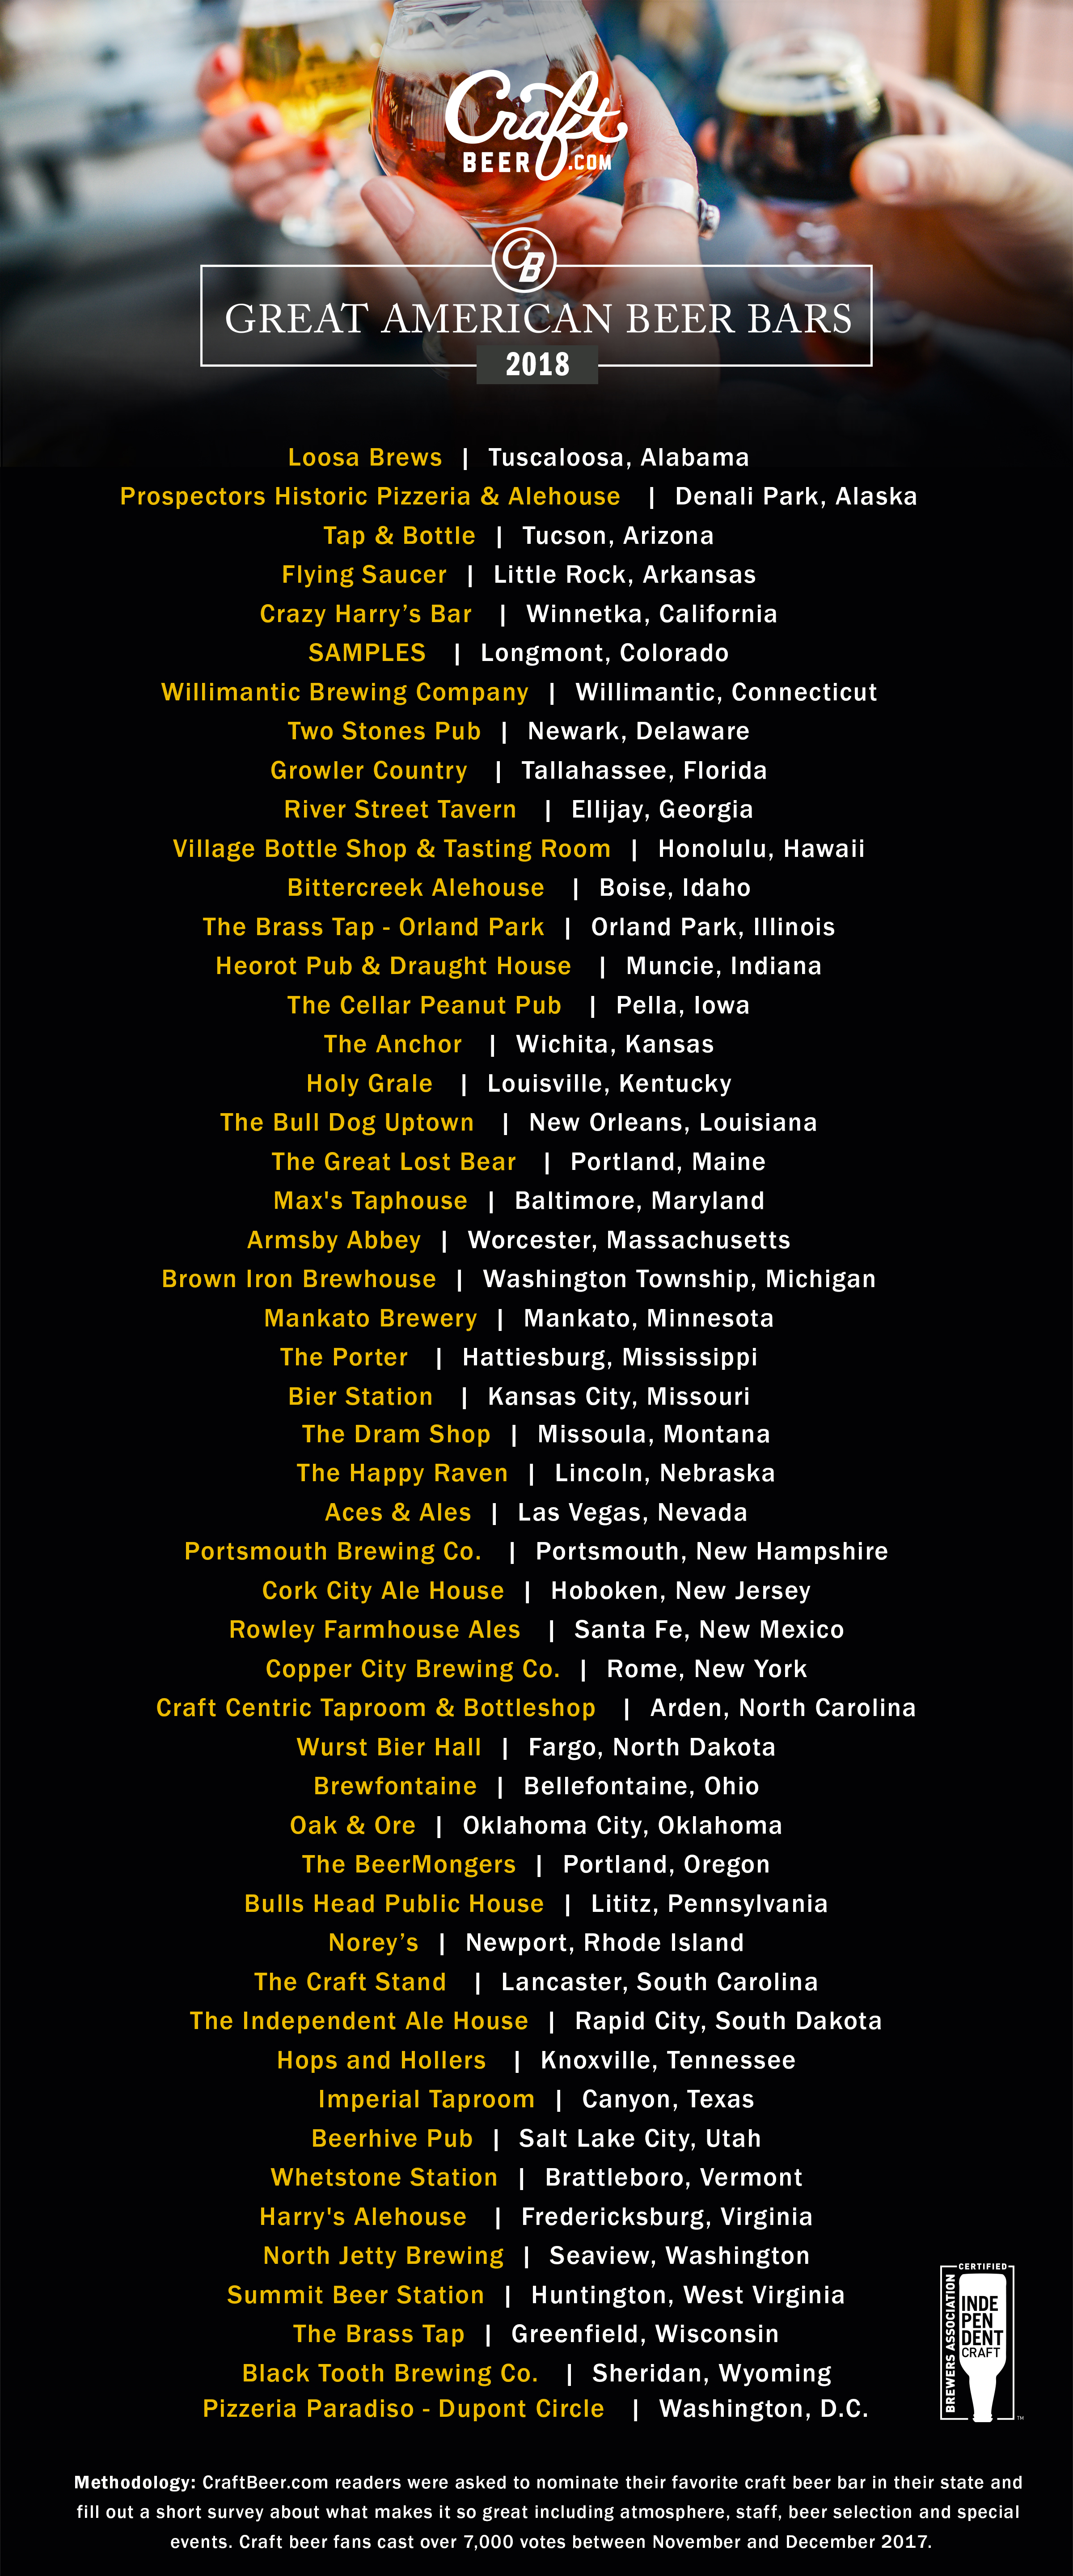
CraftBeer.com readers were asked to nominate their favorite craft beer bar in their state and fill out a short survey about what makes it so great, including atmosphere, staff, beer selection and special events. Over 7,700 votes were cast from November 2017 – January 2018. Visit CraftBeer.com to view a sortable list and each bar’s profile including photos and statistics
Food Service Profit in Australia
Buoyed by high levels of urbanization and increasing disposable incomes, Australia’s foodservice profit sector is expected to grow at a compound annual growth rate (CAGR) of 2.6 percent and reach a market value of AUD$80.8bn over the period 2016-2021, according to leading data and analytics company GlobalData.
Australia’s strong economy has made foodservice market an attractive proposition for new operators. Having not experienced a recession in over 25 years, consumer confidence is markedly robust, with consumers both able and willing to spend on non-essential food offerings.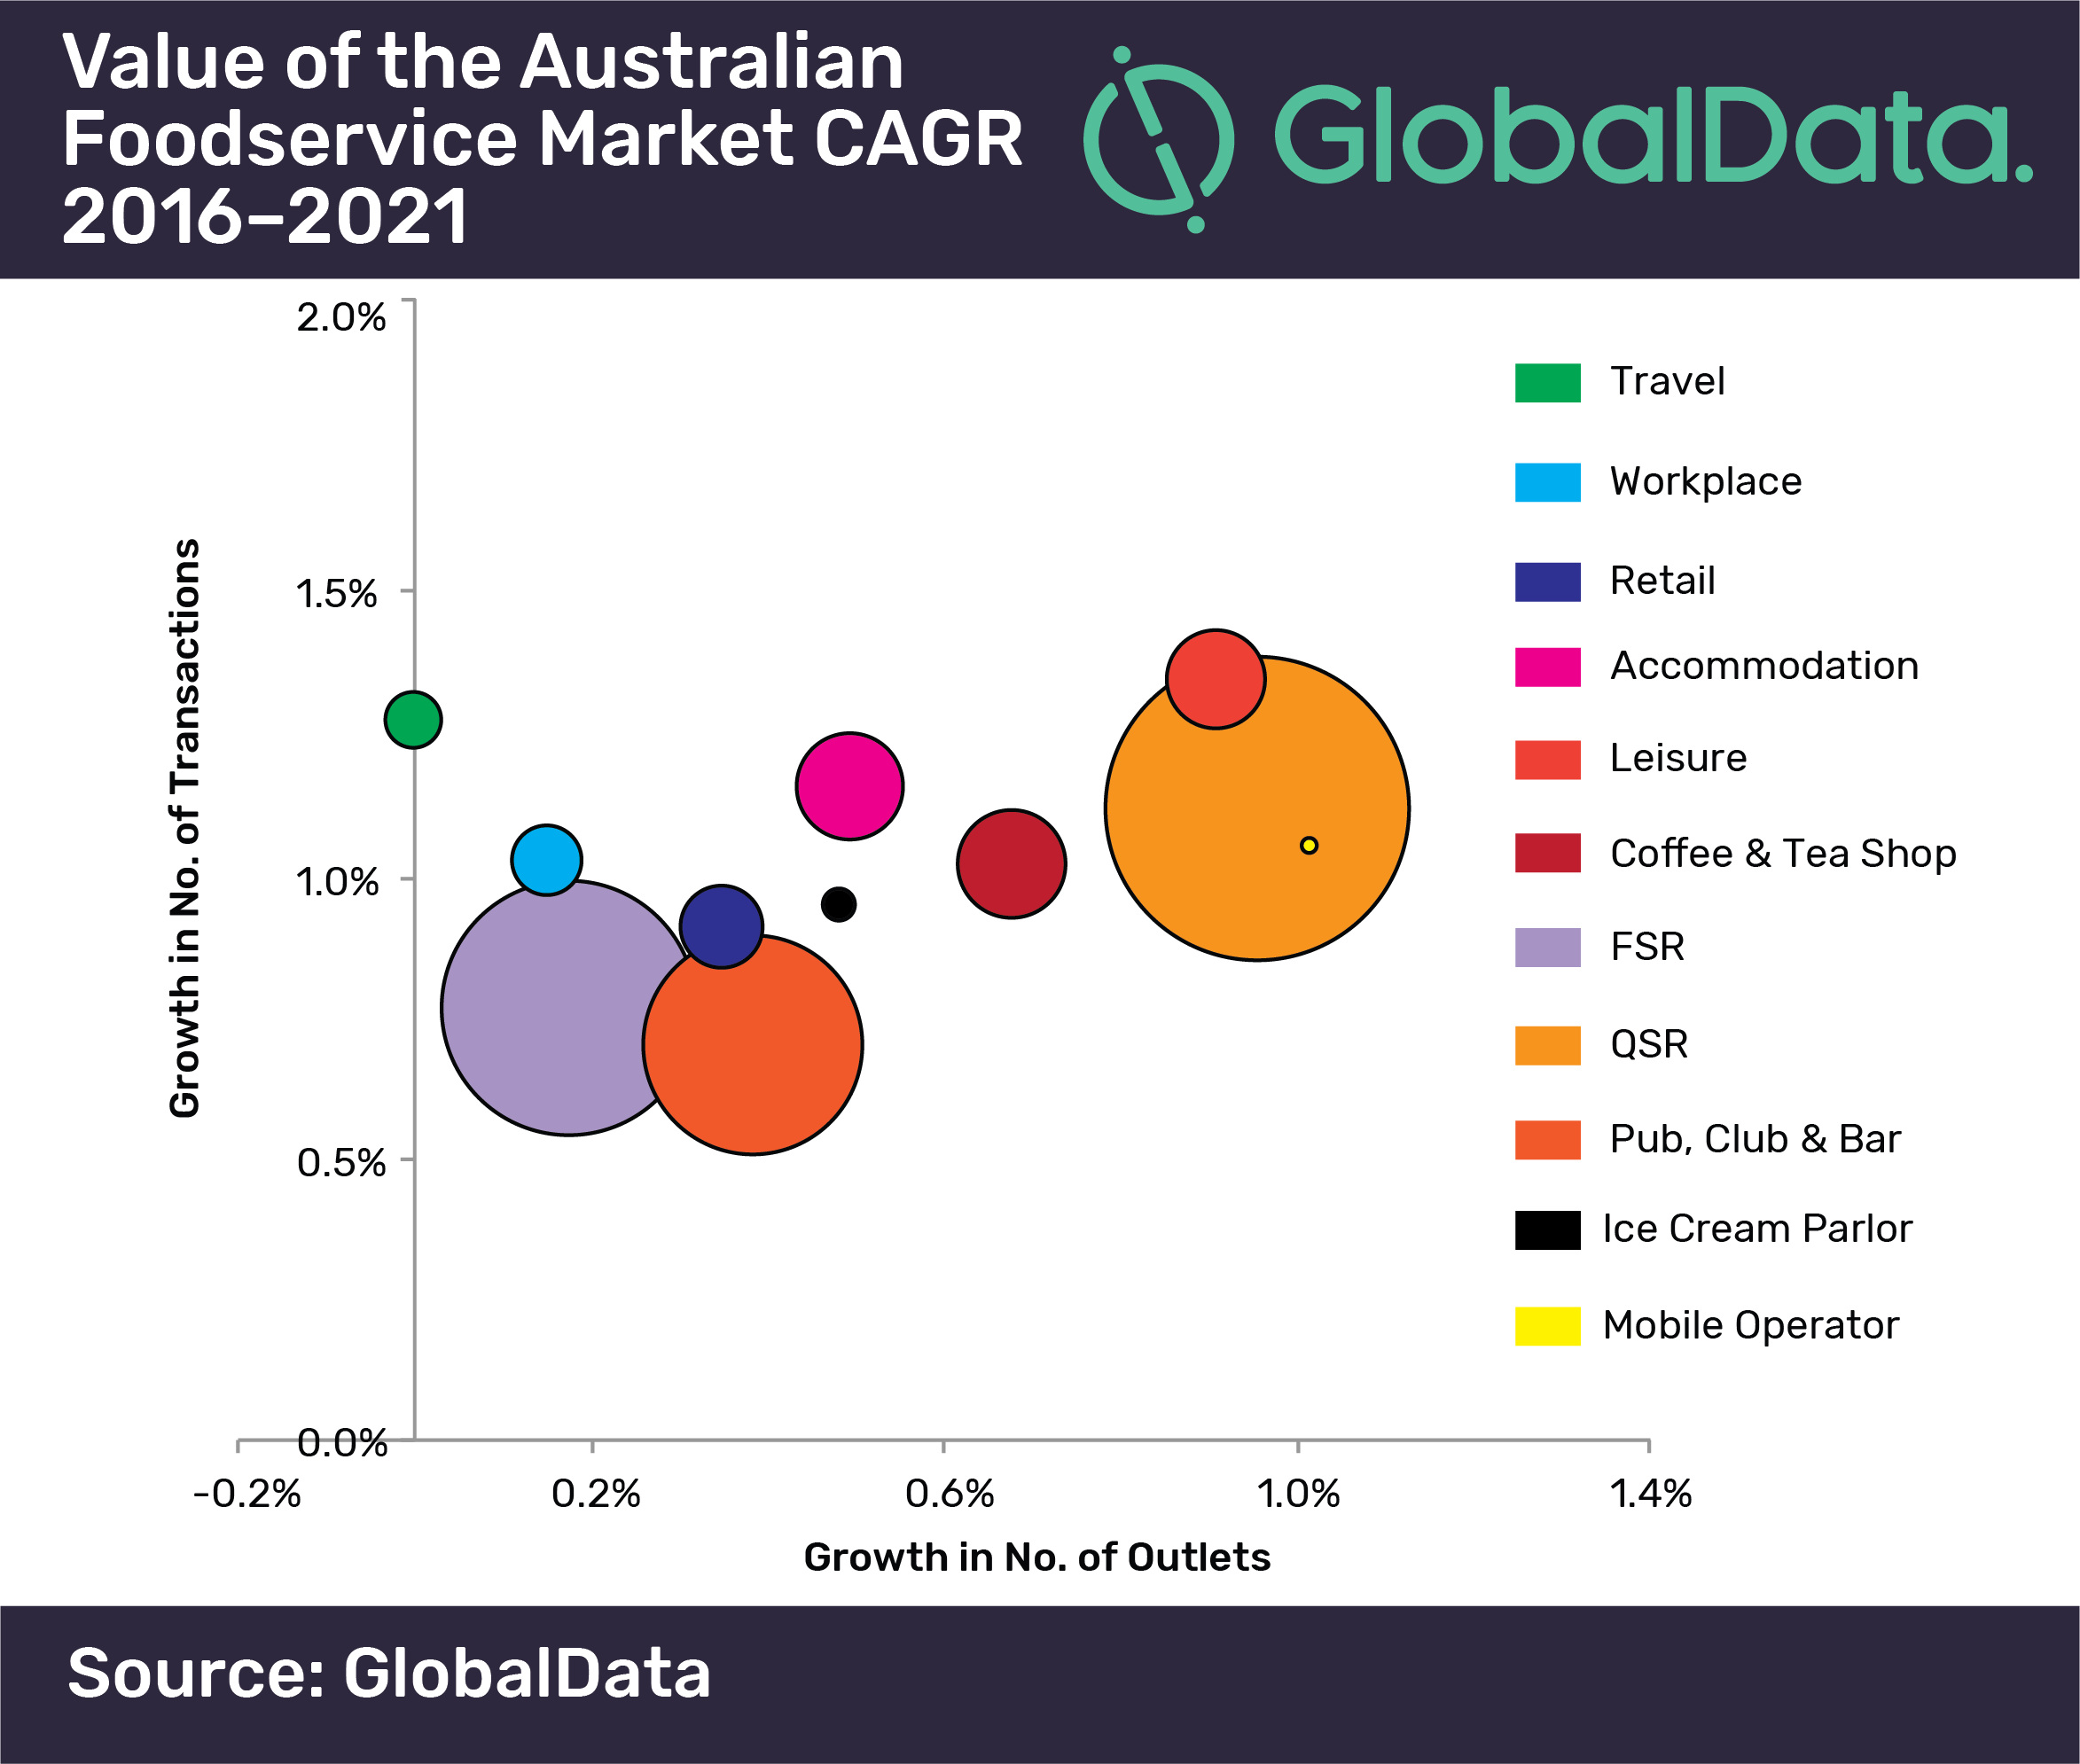
The company in its latest report, ‘Australia – The Future of Foodservice to 2021’, forecasts the value growth to continue, predominantly driven by the rising number of transactions, as opposed to outlet expansion.
Within the profit sector, quick service restaurants (QSR) was the largest channel with AUD$25.8bn value and 36.4 percent of sales in 2016, followed by full service restaurants (FSR) with AUD$17.9bn value, ‘pubs, clubs and bars’ with AUD$13.5bn value and coffee and tea shops with AUD$3.3bn.
Earlier, global chain operators used to treat the Australian foodservice market as an extension of the US/ Europe. However, it is set to undergo significant changes as global brands are expected to view the market as a ‘laboratory’ to introduce experimental and innovative products to differentiate from each other.
GlobalData reveals that a global trend towards fresh, natural and pure foods has materialized within the QSR channel. This has placed pressure on traditional QSR operators, like McDonald’s and Hungry Jacks to, in turn, improve their food offerings.
Kambu Ninad, Foodservice Analyst at GlobalData, said “It is vital for QSR operators to remember that visits to the channel remain predominately driven by the convenience offered. Established brands should not risk dramatically changing their brand message and alienating their core audience in order to chase the latest food fads.”
The advent of social media and improved connectivity has created a ‘conversation culture’ surrounding food in Australia. Consumers are willing or even keen to share their food ‘experiences’ on social media platforms such as Instagram, Facebook or Twitter.
GlobalData in its consumer survey found that 13 percent of Australians share a picture of the food/drinks they eat/drink weekly. These consumers, often young, are expected to ‘lead’ opinion shifts within their friendship groups, potentially benefiting the foodservice operators.
Modern consumers are displaying more complex and personal desires when it comes to food. Their consciousness of health in food is higher and they seek greater control over what they choose to eat. Against this backdrop, Kambu Ninad explains: “As consumer desires become more complex and personal, operators can benefit by opening up their menus and allowing ‘al la carte’ access. Overall, profit sector channels will see increasing average transaction prices fuel the majority of future value growth in the country’s foodservice market. Transactions will also rise, driven by Australia’s growing population.”
Australia’s total cost sector buying was valued at AUD$2.4bn in 2016. GlobalData forecasts the cost sector to reach AUD$2.6bn over the period 2016-2021.
The Power of Protein
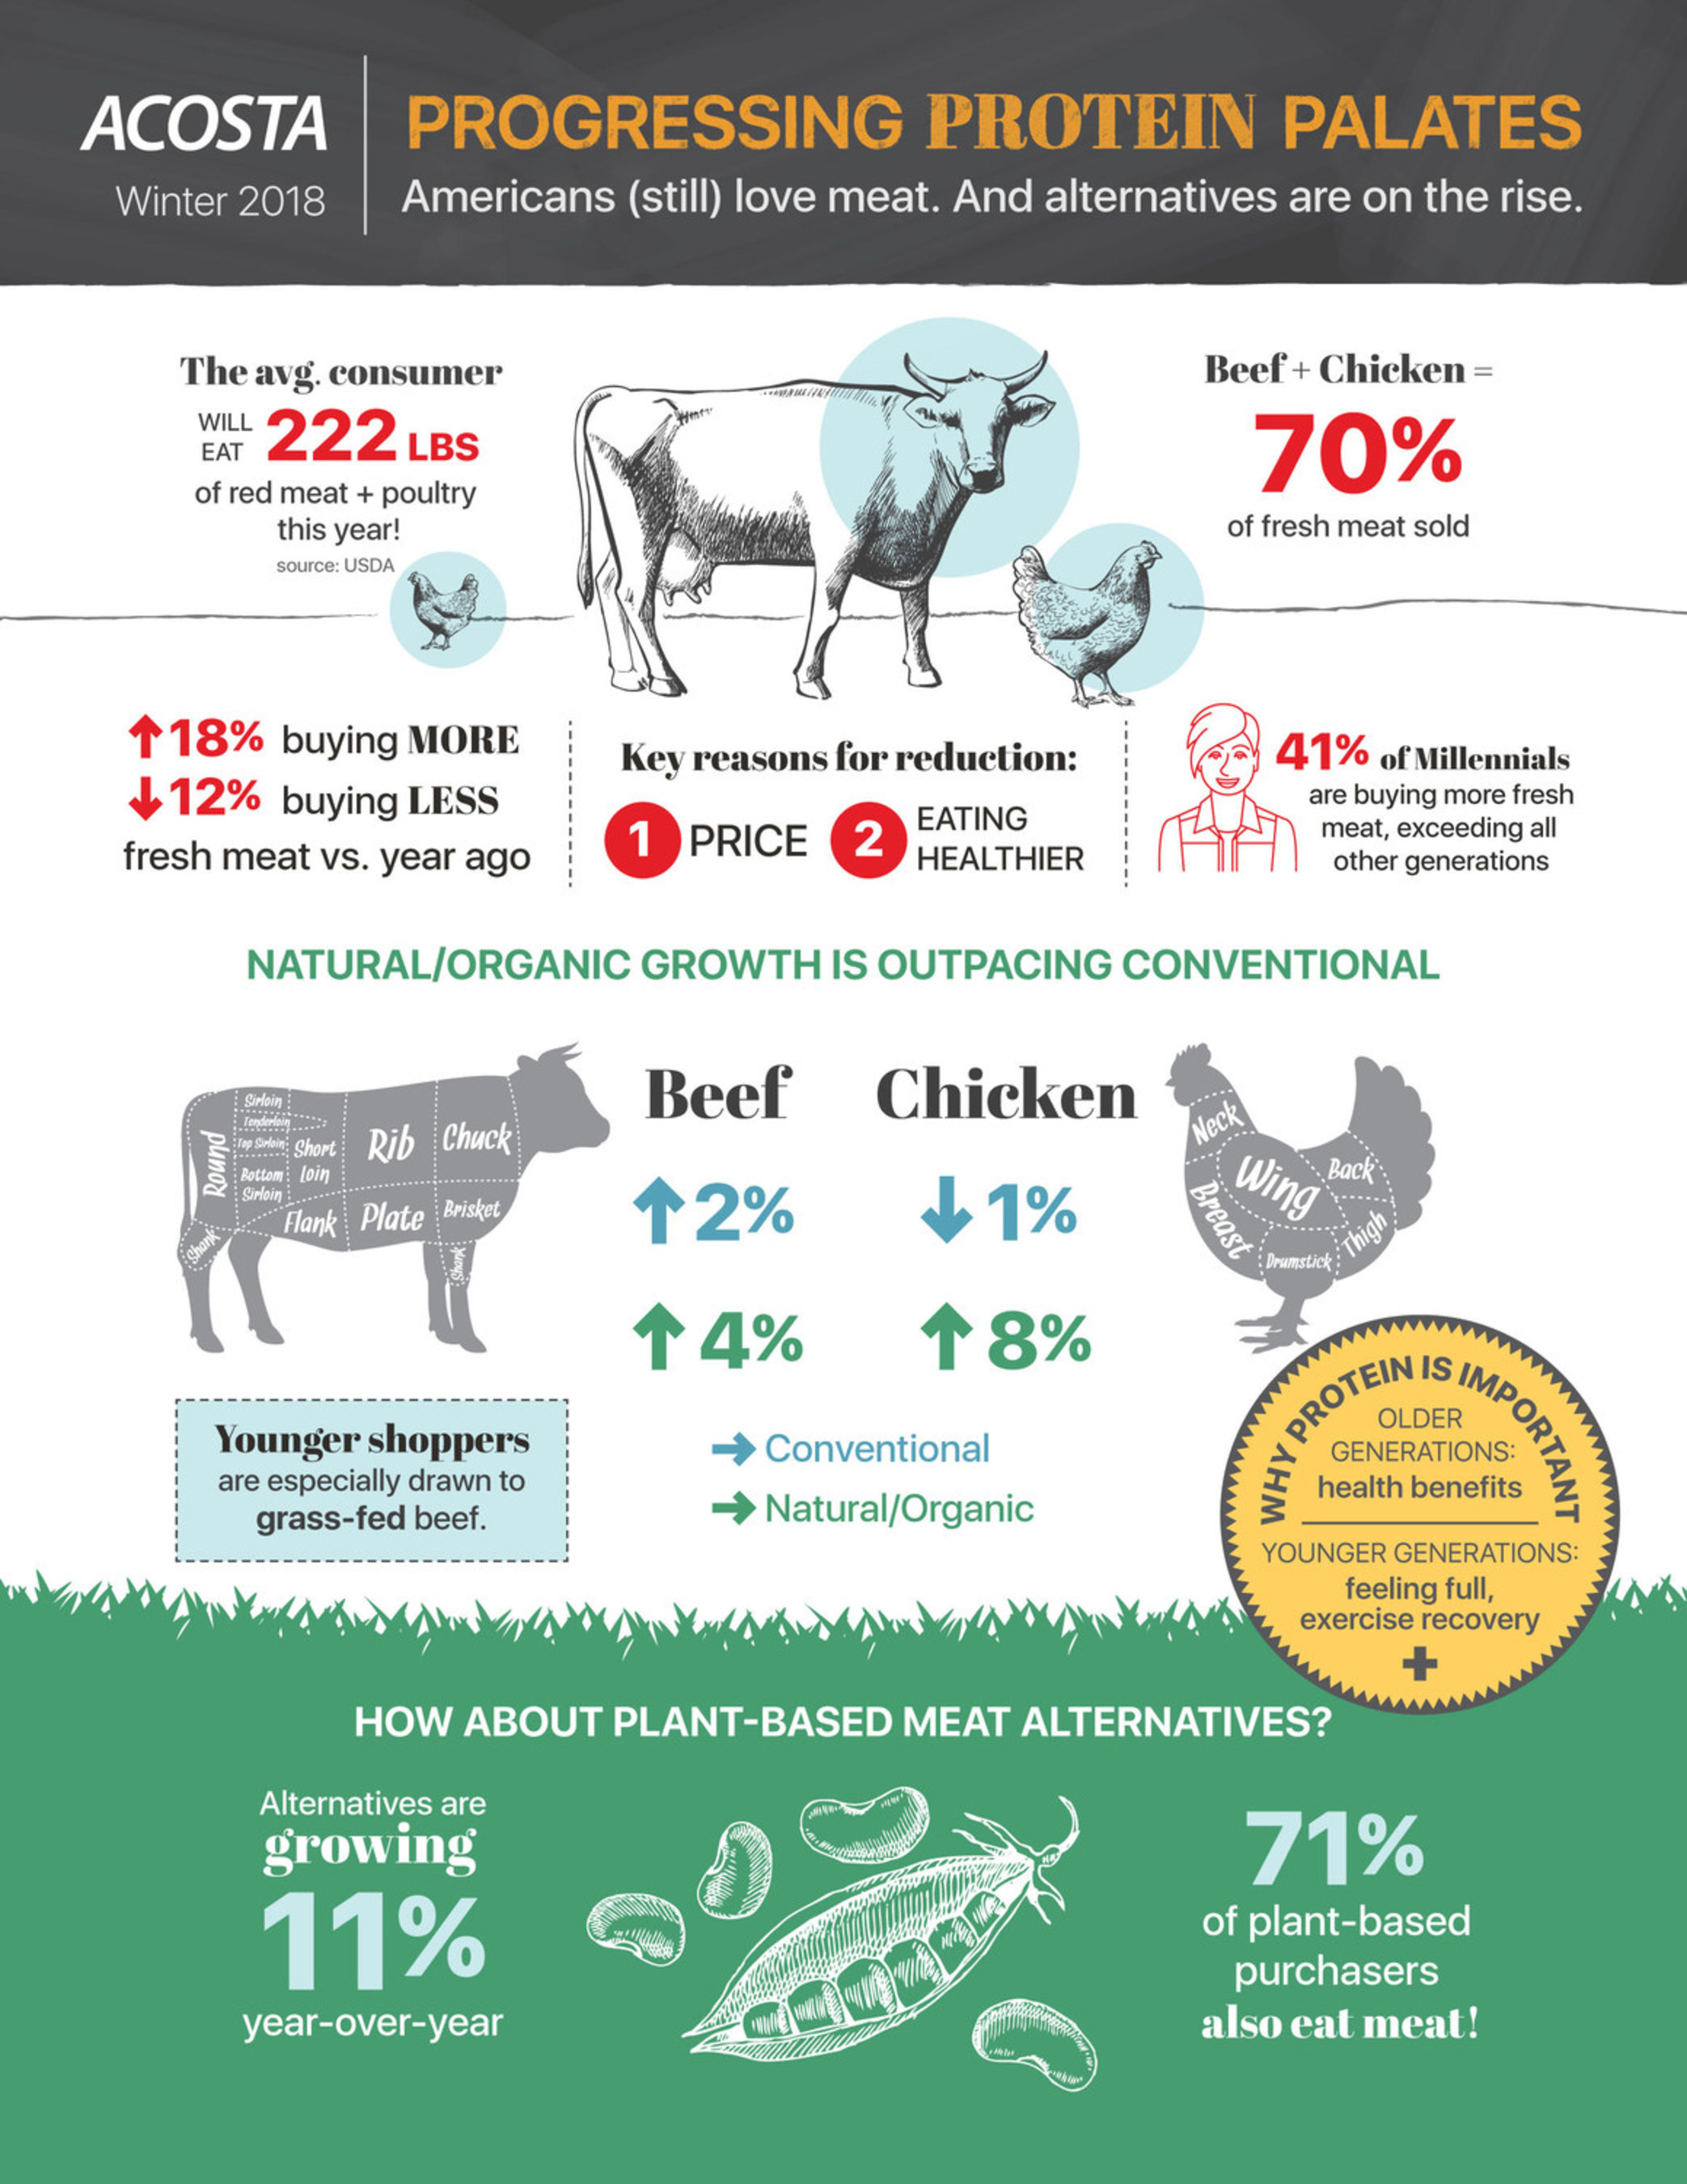
Eighty-one percent of Millennials, 74 percent of Gen X, 66 percent of Boomers and 50 percent of Silents said protein content is extremely or very influential when making grocery store purchases, according to Acosta – a full-service sales and marketing agency in the consumer packaged goods industry – and the company’s 2018 Progressing Protein Palates report. The study also revealed that generations view protein differently, with older generations more concerned with the health benefits of protein, and younger generations caring about exercise recovery and feeling full.
“Our research shows that protein continues to be a mainstay in shopping baskets, but the kind of proteins shoppers are buying is evolving,” said Colin Stewart, Senior Vice President, Insights, at Acosta. “Plant-based meat alternative sales are booming and popular with vegetarians and meat-eaters alike. Another trend we’re seeing with protein is that shoppers are paying more attention to labels and product claims, but are overwhelmed and confused about what they mean.”
Acosta’s 2018 Progressing Protein Palates report takes an in-depth look at meat and protein buying behaviors, highlighting:
Fresh Meat Trends
- Eighteen percent of shoppers are buying more fresh meat versus last year, while 12 percent are buying less, mainly due to price and striving to eat healthier – either for themselves or their family.
- Forty-one percent of Millennials are buying more fresh meat versus a year ago, more than all other generations combined.
- Beef and chicken dominate, making up 70 percent of all fresh meat sold.
- Sales of natural/organic meat are outpacing conventional options.
Plant-Based Meat Alternatives and Alternative Diets
- Shoppers are recognizing that consuming meat isn’t the only way to pack protein, with plant-based meat alternatives growing 11 percent in units year over year.
- Seventy-one percent of shoppers who purchase plant-based meat alternatives also eat meat.
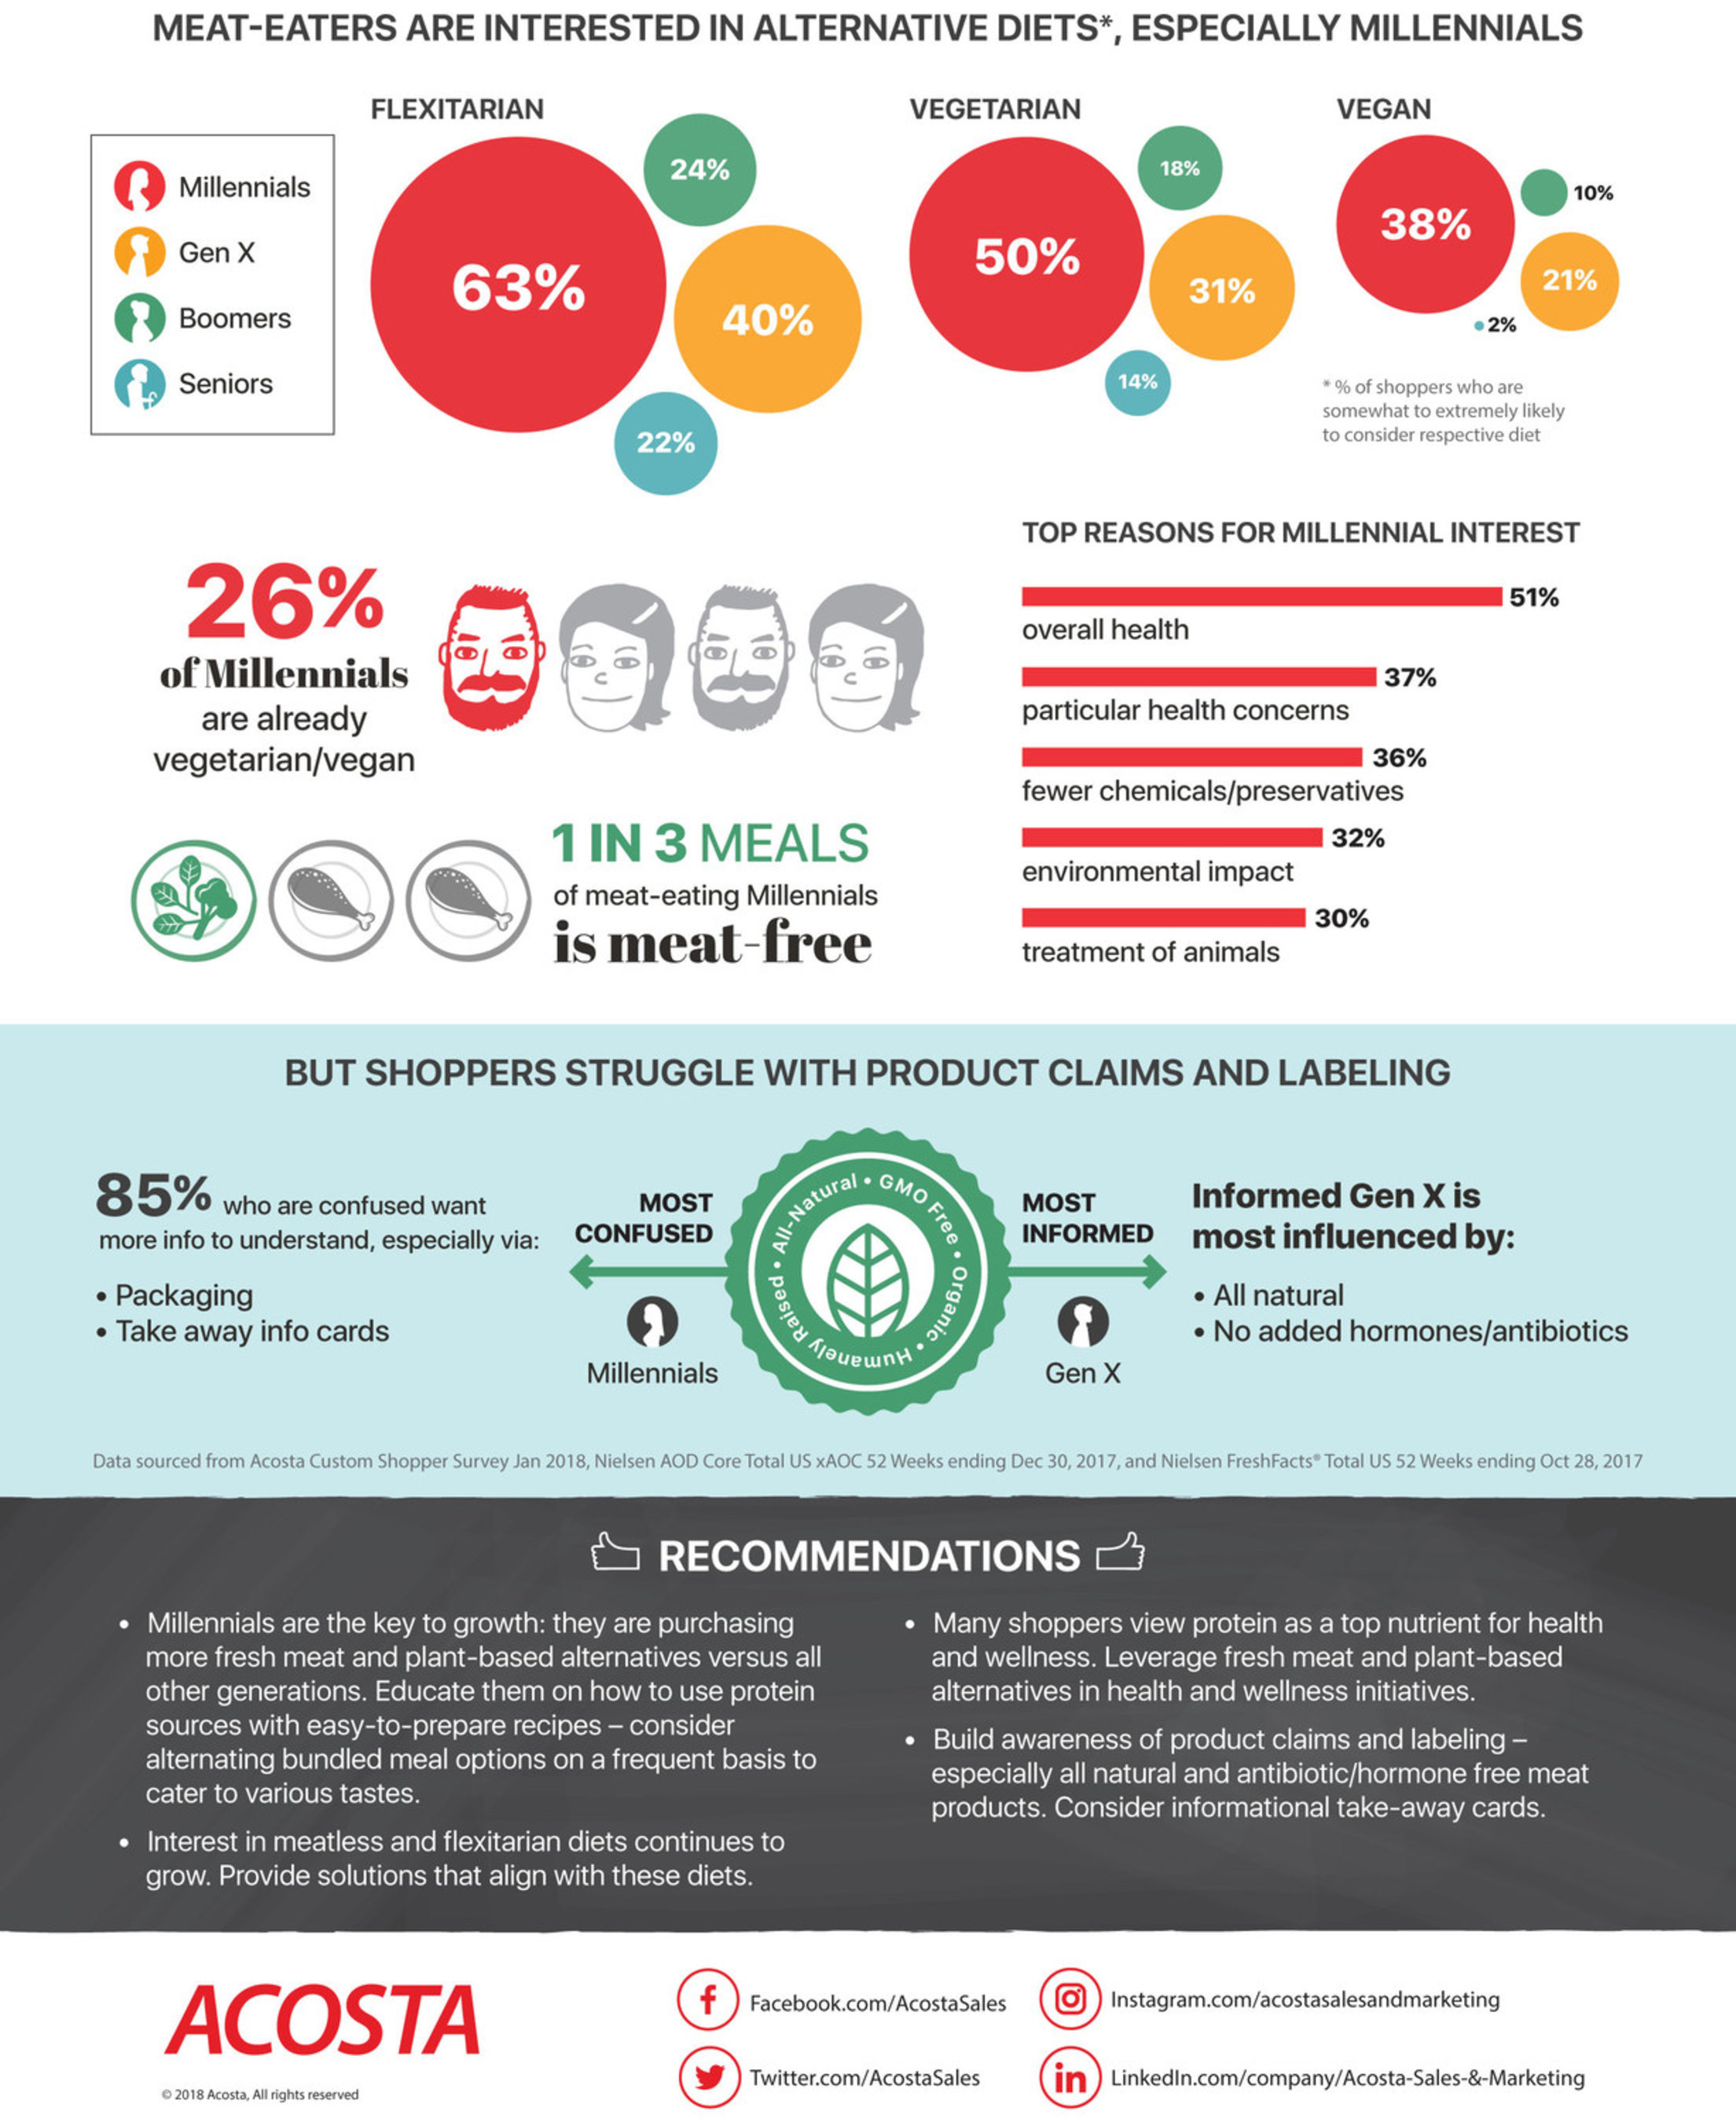
- Meat-eaters are interested in alternative diets that are either less focused on meats or do not contain meat all-together, especially Millennials. Twenty-six percent of Millennials are already vegetarian/vegan.
- Thirty-four percent of meat-eating Millennials eat four or more vegetarian dinners each week.
Label Confusion and Product Claims
- Shoppers struggle with the wide assortment of product claims, especially with those related to meat products, such as humanely-raised and free-range claims.
- Millennials ranked the highest for label confusion, with 58 percent having some level of confusion. Gen X is the most informed generation of shoppers.
- Of shoppers who feel confused/overwhelmed, 85 percent would like to have more information available to understand claims and labels.
- For Gen X shoppers that feel they are knowledgeable about various product claims, they feel most strongly about no added hormones/antibiotics and all-natural products.
“Millennials are purchasing more fresh meat and plant-based meat alternatives than any other generation, and brands and retailers need to understand they are the key to growth in the protein arena,” added Stewart. “Another clear takeaway from this study is that more awareness needs to be built around various product claims and labelling – especially for all-natural and antibiotic/hormone-free meat products.”
Acosta’s 2018 Progressing Protein Palates report was completed via an online survey of the company’s customer shopper community panel as well as multiple Nielsen research reports. To access the full report, visit www.acosta.com/news.
Chicken in Canada
Chicken is Canada’s favorite protein, according to a recent survey conducted by Leger for Chicken Farmers of Canada. 84 percent of Canadians purchase fresh chicken on a regular basis, and 90 percent place chicken among the top three meats they eat most often – consuming more Chicken than beef [72 percent], pork [52 percent] or other meats.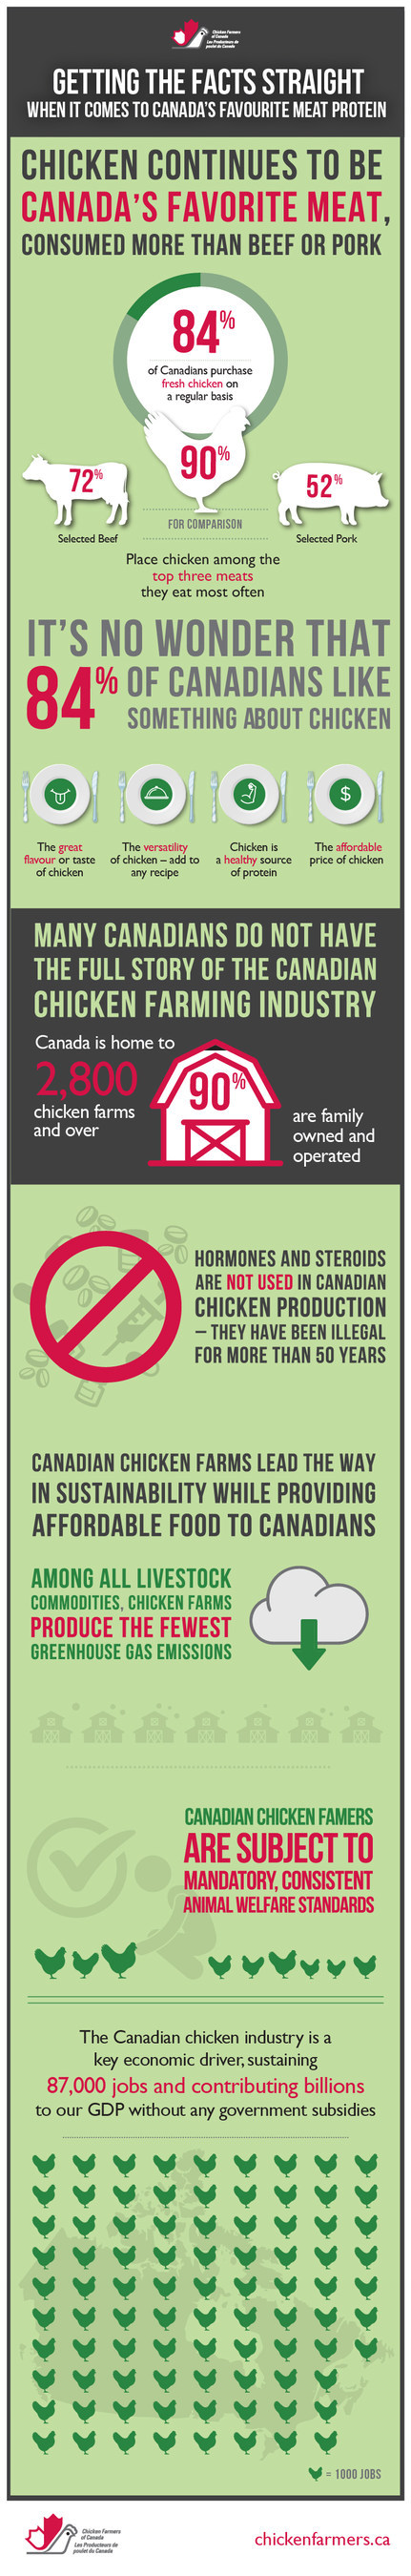
Among all respondents, 84 percent report they have something that they like about chicken. The most common reasons Canadians like chicken products include flavour/taste, the versatility of chicken, and the fact that chicken is a healthy source of protein.
Despite their love of chicken products, the survey also reveals many Canadians don’t have the full story when it comes to their knowledge of the Canadian chicken farming industry:
- Only 43 percent of respondents believe that Canadian chickens are raised without hormones or steroids, when in fact hormones and steroids have not been used in Canadian chicken production for more than 50 years.
- On average, respondents who gave an answer, believed only 45 percent of chicken farms in Canada are family owned and operated, when in reality Canada is home to 2,800 chicken farms and over 90 percent are family owned and operated.
- 57 percent of respondents correctly believe there are animal welfare standards applicable to all chicken farms across Canada. These standards are consistent, mandatory and third-party audited.
- 34 percent of Canadians believe chicken is the most sustainable meat, and this checks out: Canadian chicken farms lead in sustainability with the lowest greenhouse gas emissions among all livestock commodities.
When you have access to the facts, it’s clear: Canadian chicken farms lead the way in sustainability while providing affordable food to Canadians. The industry is a key economic driver, sustaining 87,000 jobs across the country while contributing $6.8 billion to GDP and $2.2 billion in tax revenue to all levels of government.
Survey completed by Leger: An online survey of 1,500 Canadians was completed between Nov 13 and 23, 2017, using Leger’s online panel, LegerWeb. A probability sample of the same size would yield a margin of error of +/-2.5 percent, 19 times out of 20.
Top Chili Cities
Forget what you’ve heard about chili being a Texas-only specialty. A study by one of the world’s largest chili purveyors shows that residents of cities across the country love this classic comfort food as much or more than their Long Star State counterparts.
The internal analysis, conducted by Wienerschnitzel in honor of National Chili Day on Feb. 22, named the Top 10 Chili Cities in the United States. Residents in these markets eat more chili per person than residents of other cities, have access to more restaurants known for their chili and are more likely to enter or attend a chili cookoff. These residents also more fully embrace their cities’ chili culture or openly demonstrate their love for the famous dish.
According to Doug Koegeboehn, chief marketing officer for Wienerschnitzel, the list of “Top 10 Chili Cities” includes not only expected chili capitals in the Southwest but other markets like Los Angeles, Chicago, Cincinnati and Springfield, Mo., known more for seafood, Midwest comfort food or ethnic dishes than the American classic dish.
The survey ranked Los Angeles atop the list, followed by Dallas; Phoenix; Houston; San Francisco/Oakland; Chicago; Baton Rouge, La.; Springfield, Mo.; Cincinnati; and San Antonio who is credited with first popularizing chili in the 1890s, rounded out the top 10.
“Despite being the official dish of Texas, chili has grown to become America’s dish,” said Koegeboehn. “At Wienerschnitzel, we’ve known that for years. In fact, we’d like to think that there are really only two types of people in the world: chili lovers and those who still haven’t tasted really great chili yet.”
Pizza Box Market
Transparency Market Research points out that the vendor landscape in the global pizza box market is highly fragmented. Leading players are expected to focus on export of their packaging solutions to improve market share. However, introduction of local players due to low barriers is projected to intensify the competition in the global market. Some of the key players in the global pizza box market are International Paper Company, WestRock Company, DS Smith Plc., and Georgia Pacific LLC. In the coming years, companies are likely to venture into developing sustainable packaging solutions as governments across the globe are laying emphasis on reducing carbon footprint.
The global pizza box market was worth US$2,223.0 mn in 2016. During the forecast years of 2017 and 2025, the global market is estimated to exhibit a CAGR of 4.6 percent. According to the report published by Transparency Market Research, the large boxes, which are about 15 inches and more are expected to be the key revenue contributors. Geographically, North America pizza box market is projected to surpass others with a CAGR of 3.3 percent between 2017 and 2025.
E-commerce Enables Demand for Pizza Boxes as Trend of Ordering Food Picks Pace
The global pizza box is primarily being driven by the changing lifestyles that are being dictated by consumption of fast food and packaged food items. Growing number of people in favor of pizzas have been at the very center of surging demand for pizza boxes. The market is also driven mushrooming pizza joints by the dozen. The soaring number pizza-selling chains and independent pizza outlets have also augmented the growth of the global market. Furthermore, the convenience of packaging pizza in varying sizes has also triggered a demand for pizza boxes in multiple sizes. Over the years, the shape, size, durability, and the aesthetics of a pizza box have played an integral role in shaping the positive trajectory of the global market.
The growth of the pizza box market is also attributable to the booming e-commerce industry, unstoppable adoption of smartphones, and excellent logistics services. Convenience of ordering for food from home or office has thus supported the pizza box industry, as well-designed boxes are the only way of making deliveries successful. In the coming years, advancements to improve the quality of pizza boxes are also expected to work in the favor of the global market. Changes to avert seepage of oils through the container in case of prolonged storage are expected to up the demand for pizza boxes. In the past few years, pizza boxes have been a preferred way of storing pizza as they are built with a capability to withstand high temperatures such as 50 to 70 degrees.
Increasing Awareness about Healthy Eating to Restrain Market
However, the market for pizza boxes does face a few constraints. To begin with the growing realization amongst consumers about eating and living healthy is expected to have a negative impact on the overall market. The exceptionally high cost of manufacturing corrugated pizza boxes is also expected to be one of the downsides for the overall market. Despite the restraints, the market will have a plethora of opportunities as the world will continue witnessing younger generations inclined towards eating fast food. Penetration of big pizza brands in developing parts of the world will also result in higher demand for pizza boxes.
Beverage Outlook
In the new report U.S. Beverage Market Outlook 2018, market research firm Packaged Facts provides comprehensive trend analysis of seven leading categories in retail packaged beverages, including Bottled and Enhanced Waters; Carbonated Beverages; Energy & Sports Drinks; Juices; Coffee & Ready-To-Drink Coffee; Tea & Ready-To-Drink Tea; and Dairy Beverages & Non-Dairy Milk Alternatives.
Here are four of the most essential key growth trends for the U.S. beverage market identified by Packaged Facts:
- Crossing Categories – The trend toward crossing one beverage category with another is well underway and appears likely to expand. Carbonated juice drinks, plant milk and coffee combinations, dairy-based energy drinks—the mixing has only just begun. One recent combination is a caffeinated bottled water from BiPro USA. Introduced in late 2017, BiPro Orange +Caffeine is part of the company’s protein water line, offering “the nutritional benefits of protein and caffeine while on the move!” The product features 20 grams of protein and 100mg of natural caffeine. Other ingredients include whey protein isolate and natural orange flavor.
- Savory Formulations – Savory beverages are among the categories that appear to be on the brink of a major breakthrough. Consumers looking for alternatives to sweet beverages, and ones that offer health benefits as well, as trying drinkable vinegars such as the organic Raw Apple Cider Sipping Vinegars from Vermont Village. Flavors include as Blueberries & Honey, Turmeric & Honey, Cranberries & Honey, and Ginger & Honey. Apple cider vinegar, derived from fermented apple juice, can contain probiotic bacteria that help keep the digestive system healthy. Vermont Village points out that its unpasteurized apple cider vinegar contains the “mother” referring to the cloudy, cobweb-like strands of material that contain the probiotic bacteria as well as healthy enzymes and proteins.
- Clean Label – Clean labeling is still in a relatively early stage of development as a critical factor in beverage purchasing decisions. But it is almost certain to accelerate and reach a tipping point in the very near future as an element in marketing and packaging, as well as in the production process itself, that all food manufacturers must address. Consumers, in an environment where trust is hard to come by, want more certainty than ever before that their foods are safe.
Some beverage categories, bottled water and tea, for example, tend to be more prepared to present as clean label that others. But the need to offer a clean label impacts all of the categories and will continue to be a force for change in those that have in the past relied heavily on artificial ingredients.
- Environmental Concerns – The transparency that clean labeling represents extends to the methods of production in terms of environmental friendliness and conditions that support animal welfare, factors that are of increasing importance to a growing number of consumers and also likely to reach a tipping point that makes them a must for manufacturers. Note how some plant-based beverage manufacturers, for example, are already using the smallness of their environmental footprint as a competitive factor.
Going forward, expect that regenerative agriculture—the use farming techniques that rebuild and restore soil biodiversity—will become especially important to the beverage industry. Manufacturers will join the movement to use techniques that reduce and possibly reverse damage to soil, water, and even the air. Danone, for example, announced in November 2017, that it was joining forces with the French government’s international initiative on soil health, as part of its drive to support regenerative agriculture.
Travel Bragging
Those ‘travel bragging’ posts filling up your social feeds show no sign of slowing down but now thanks to the world’s first #TravelBrag Artificial Intelligence (AI) analysis, Hotels.com® reveals what’s topping the brag charts in destinations around the world, so you can choose your next trip wisely. 
Worldwide travelers are a cultured bunch, who enjoy musing around museums (300,000 brags), old-town charm (170,000 brags) and a spot of sunshine (130,000 brags), but they can also be found in floating restaurants, erotic museums and night markets.
More than five million brags globally were analysed by an Artificial Intelligence tool. Using a combination of Tweet data that included links to Instagram posts and innovative AI technology, the tool identified and grouped brag types based on travel keywords and destination mentions to give an overview of what people show off about on social media while traveling.
Top Global Themes
- Museum
- Rooftop bar
- Old Town
- Modern Art
- Opera
- Sunshine
- Olympic Games
- Cathedral
- Gallery
- Ballet
In the U.S., New York, San Francisco, New Orleans, Miami and Las Vegas are among the global travel brag destinations with top brags from travelers at the following landmarks:
- Ritz Carlton, San Francisco
- Times Square, New York City
- Miami Beach, Miami
- Bourbon Street, New Orleans
- Union Square, San Francisco
- Mob Museum, Las Vegas
- French Quarter, New Orleans
This travel bragging trend echoes the findings from the recent Hotels.com Mobile Travel Tracker* report, which revealed that one in six travelers search social media before their trip to plan the photos they’ll take #inspo. And 56 percent of Americans admit to spending more than an hour a day on their smartphones while on vacation.
While travelers naturally brag about taking in the tourist hotspots and cultural offerings, more people than ever are sharing foodie ‘grams, shopping stories and luxe posts.
#Foodporn
You’re never more than an Insta-scroll away from #FoodPorn and the brag lists are brimming with culinary treats. Cakes in Stockholm and curry in Toronto spice up the brag lists, and New York steak and pizza both made the cut. Perhaps more surprisingly, enchiladas proved twice as popular as modern art in Mexico City, ice cream scooped 10 percent of all San Francisco brags and Jumbo Kingdom floating restaurant in Hong Kong took second place in the Hong Kong chart with more than 20,000 brags.
Shop ’til you drop
Shopping is a must-do for most travelers. Those visiting Paris brag more about the Rue Vieille du Temple, famous for its boutiques, than Le Louvre! Other top shop-spots included Bal Harbour in Miami, the Harbour City mall in Hong Kong, vintage shops in Melbourne and the stylish Cecile Copenhagen fashion brand made the Danish capital’s top 10.
Five-star luxury
When travelers check into a posh, luxury hotel they naturally want the world to know. The stunning 5-star Ritz Carlton in San Francisco topped the city’s brag list, the Four Seasons in Singapore proved brag-worthy and the Park Hyatt came in at number one in Seoul – most likely for its awe-inspiring rooftop pool.
Scott Ludwig at Hotels.com said, “Bragging about your travel experiences on social media has become the norm – if you didn’t get social kudos out of it, it didn’t happen! With travel posts being so plentiful on social media, Americans are checking out what others are bragging about to get tips for their next trip.”
“This #TravelBrag analysis shows just how diverse travelers are. Whether its enjoying rooftop cocktails in Bangkok, checking out Camden Town in London or visiting the mob museum in Vegas, social bragging is out in full force.”
Gluten-Free Attitudes
DuPont Nutrition & Health announced results of a consumer survey where consumers in four key European markets were asked about their attitudes to gluten-free bakery products. The survey results have revealed untapped potential for bakers to develop more and better-quality products with extra nutritional benefits.
While only an estimated 1 percent of the population is gluten-intolerant through celiac disease, Mintel market research reports that the percentage of consumers who buy gluten-free products is considerably higher – 11 percent in Italy and the United Kingdom, and 8 percent in France and Spain.
Bakery products are top of the gluten-free shopping list. To help bakers meet consumer demands, DuPont now has launched a new ‘gluten-free solution finder’ based on its latest application trials.
● Gluten-free consumers seek more, high-quality products
Findings from the DuPont survey indicate that healthy living is a main driver of gluten-free sales in these markets. They also show gaps in the current range of gluten-free bakery products on store shelves. Even better quality and wider availability are two key consumer demands.
“It’s clear that consumers are looking for gluten-free bakery products that match regular products in terms of taste, texture and appearance. From a health perspective, they are interested in claims such as reduced sugar and high fiber and other ingredients that give a better nutritional profile,” said Lena Hamann, strategic marketing manager, bakery EMEA.
● Preferences vary – so no solution fits all
Another important finding concerns the broad variation in consumer preferences for gluten-free bakery products from market to market. Senior application scientist Helle Wium comments on the challenges of meeting these varied marked demands.
“Bakers use a range of gluten-free alternatives to standard wheat flour to satisfy the preferences of consumers in their markets. This is why there is no such thing as a one-size-fits-all ingredient solution to solve their quality challenges,” she explained.
● Gluten-free solutions are custom-made
The survey’s findings have provided valuable insights for ongoing gluten-free trials in the DuPont bakery application center. Exploring key production parameters and ingredient combinations, the trials focus on ways to improve processing efficiency and sensory properties, including taste, texture, appearance and fresh-keeping quality.
This knowledge is behind the customized gluten-free solutions developed by DuPont for individual customer needs. It also is the foundation of the DuPont gluten-free solution finder, a tool that helps bakers identify the right ingredient combinations to meet their market needs.
The solution finder includes two new DuPont™ Danisco® ingredient blends. POWERFresh® GF is for gluten-free bread and sweet goods that stay soft and moist throughout shelf life. POWERFlex® GF locks flexibility into gluten-free tortillas, so they fold easily without tearing even after four weeks in ambient storage.
● Learn more
For more knowledge and insights from the DuPont gluten-free consumer survey and from the DuPont bakery application team, visit http://bakeryperformance.com.
Clogged Restrooms and Business Perception
A strong majority of Americans (86 percent) say a clogged public restroom toilet would negatively impact their perception of a business, according to a recent survey commissioned by Sofidel, a leading global provider of paper for hygienic and domestic use. The survey, conducted online by Harris Poll, Feb. 6-8 among 2,079 U.S. adults ages 18 and older, also found that more than three-fourths of Americans (76 percent) have experienced a clogged toilet in a public restroom.
“Clogged toilets can result in foul odors, restroom closures, disgruntled customers and increased maintenance costs for businesses,” said Fabio Vitali, Vice President AFH Marketing & Sales for Sofidel America. “It’s crucial that business owners and managers properly maintain restrooms and carefully select products that enhance guest satisfaction and the bottom line.”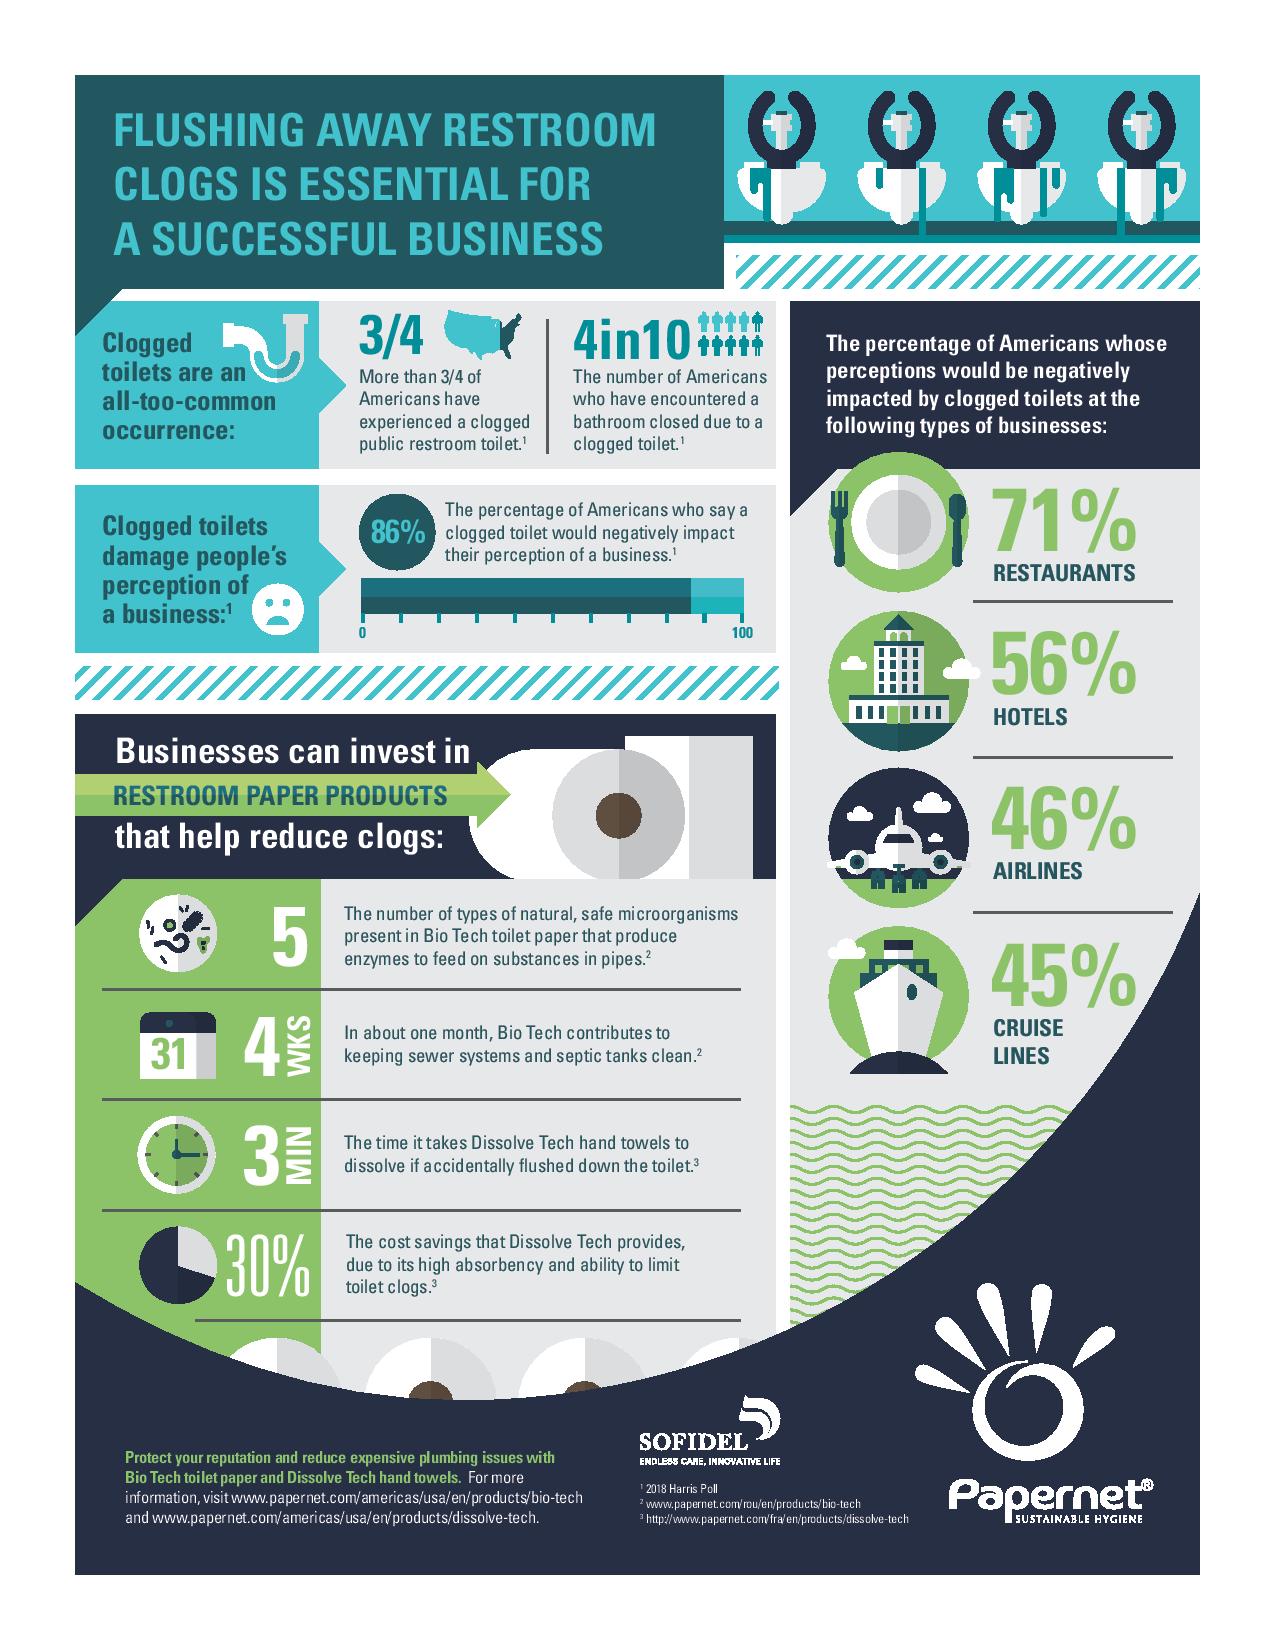
The poll revealed that:
- 4 in 10 Americans have encountered a bathroom closed due to a clogged toilet.
- 49 percent of Americans have experienced foul restroom odor due to a clogged toilet.
The survey also provided insight about what types of businesses could be most impacted by clogged toilets:
- Restaurants faced the most potential backlash, with 71 percent of Americans saying that a clogged toilet at a restaurant would negatively impact their perception of the business
- More than half (56 percent) would have a negative perception of a hotel with a clogged toilet
- Nearly half would have a negative perception of a grocery store (49 percent) or retail store (47 percent)
- Clogged toilets also negatively impact the perceptions of travelers on airplanes (46 percent) or cruise ships (45 percent)
To reduce the occurrence of restroom clogs in commercial settings, Sofidel offers Bio Tech toilet paper. Bio Tech uses Biologic Active Tissue Paper (BATP) technology to produce enzymes that help disinfect restroom pipes and limit clogs as quickly as after one month of use. Studies demonstrate that the exclusive use of Bio Tech can provide total savings of up to 40 percent compared to standard toilet paper. This survey was conducted online within the United States by Harris Poll on behalf of Sofidel from February 6-8, 2018 among 2,079 U.S. adults ages 18 and older.
Automatic Coffee Market Outlook
The vendor landscape of the global fully automatic coffee machine market features an increasingly competitive nature, with companies focusing on the development of products suitable for price-sensitive but highly promising regional markets, observes Transparency Market Research in a recent report. As the level of competition intensifies in the global fully automatic coffee machine market, thanks to the entry of several new players and the introduction of new product varieties at a rapid pace, price wars among leading players are becoming intense. To strengthen their positions, companies are likely to place more focus on the improvement of the efficiency of their value chains.
Some of the leading companies in the market are N&W Global Vending S.p.A., Wilbur Curtis Co., Bravilor Bonamat B.V., Gruppo Cimbali SpA, Group SEB, Rex-Royal AG, Crem International AB, and Franke Holding AG.
According to the report, revenue generated from the global fully automatic coffee machine market valued at roughly US$4,288.6 mn in 2017. The market is expected to expand at a CAGR of 2.8 percent over the forecast period. Global Fully Automatic Coffee Machine market are expected to be valued at approximately US$ 5,359.2 Mn by the end of 2025.
On the basis of HoReCa type, the fully automatic coffee machine market has been examined for two broad segments, namely quick service restaurants (QSRs) and full service restaurants (FSRs). Both segments are likely to expand at a healthy pace over the forecast period.
The market in Asia Pacific is likely to emerge as one of the most promising regional markets for fully automatic coffee machines owing to the rising expenditure on eating out and the rising numbers of fine dining restaurants and fast food chains in the region. Opportunities for fully automatic coffee machine market also abound in the region owing to the rising disposable incomes, increased adoption of Western consumption habits, and the high population of youngsters.
Increased Inclination of Global Population on Eating Out to Work in Favor of Market
A number of factors are spelling growth for the global fully automated coffee machine, including the rising population of millennials, rising disposable incomes, increased expenditure on eating-out, and rising per capita food consumption across the globe. Vast developments in the global foodservice industry, increase in the number of a number of local and international coffee chains, and the rising adoption of Western culture across emerging economies, thriving international tourism industry, and the rising population of youngsters are also driving the market.
Several coffee shops and tea houses based on innovative ideas and boasting alluring interiors, complete with wireless connectivity, provide serene environment for socializing. Thus cafés are becoming regular hangout places, witnessing rising footfall across all ages. As sipping coffee at cafés increasingly becomes a part of everyday life across several regions, the market for fully automatic coffee machines is estimated to benefit.
Rising Popularity of Instant Coffee to Hamper Market Growth
Some of the restraints that are expected to potentially restrict the overall growth of the global fully automatic coffee machine market is the availability of other substitutes with fast food like cold drinks and shakes and the high dependability on imports, which results in higher prices. The market is also challenged due to the advent of new technologies and the rising consumer inclination towards instant coffee consumption. While these factors continue to plague the development of the industry, the market could benefit from the introduction of state-of the-art technology driven coffee machines.
The Creep Factor in Brands
A new study from customer experience (CX) intelligence leader InMoment reveals that, despite CX maturing as an accepted, even foundational business practice, brands still have significant blind spots when it comes to truly understanding their customers.
The 2018 CX Trends Report surveyed more than 1,000 brands and 2,000 consumers in the U.S. to find out where both groups aligned or disconnected on various CX topics. The study found that nearly a third of customers (32 percent) did not have a positive memorable experience with a brand in the past year, despite only 16 percent of brands reporting that they under-delivered.
The report delved into the impact personalization strategies is having on the customer-brand relationship. A whopping 75 percent of consumers reported finding most forms of personalization at least somewhat creepy, with 40 percent of brands admitting to being creepy. And while half of customers say they’d keep shopping with a brand after a creepy experience, 22 percent report they will leave for other brands. Additionally, they’ll tell their networks — one in five will tell friends, while one in 10 will share on social media.
According to Brennan Wilkie, SVP of CX strategy at InMoment, these and other findings in the study illustrate that brands still have a lot to learn about customer expectations.
“Whether it’s how brands are using personal information or the impact of missed expectations, companies continue to underestimate their customers. Today’s consumers are savvy, they want to be included in decisions, they want transparency, and they want real value in exchange for sharing personal information or spending their money. The brands that see the new landscape as an opportunity instead of a burden and focus their efforts on building authentic relationships with customers are seeing massive benefits.”
Other key findings revealed in the report include:
- Millennials are misunderstood: Misconceptions regarding the now-largest spending block abound. Millennials are the most sensitive of all age groups regarding their personal information and really value in-person —not just digital — commerce.
- Memorable experiences are emotional experiences: Forget price and selection — strong emotions like anger and feeling special are what turn a simple experience into fuel for future behavior.
- Human capital can make or break CX: While 65 percent of customers report that staff interaction highly influenced positive sentiment, 74 percent also say poor staff experiences were the most significant contributor to a bad brand interaction.
To download the full 2018 CX Trends Report with all of the findings, click here.
Cognac’s Popularity
Cognac sales will continue their remarkable recent momentum, with gains set to persist in North America and China supported by a resurgence in Russia, says a new report
The Global Cognac & Brandy Insights report from just-drinks and the IWSR also expects consumption of premium-and-above non-Cognac brandy to increase over the next five years, although the overall market’s recent declines will persist. This part of the Cognac & brandy category is skewed by the vast brandy markets of India and the Philippines, accounting for well over 100m cases in annual sales, both of which are declining – and overshadowing more buoyant trends in South Africa and Russia.
Meanwhile, Cognac has recovered from the impact of austerity measures in China, returning to growth in the key areas of Guangdong and Fujian. Meanwhile, on the other side of the world, consumption has reached record levels in North America.
Both of these phenomena are having ripple effects: Cognac consumption is on the up across Asia and Australasia thanks to the influence of Chinese communities and visitors there, as Cognac’s association with glamorous lifestyles among African-Americans in the US is increasingly driving growth in the Caribbean and Africa.
As a result, Cognac sales are expected to continue their recent growth, topping 17m cases a year by 2021, thanks to continued momentum in the US and China, supplemented by consumption gains in Russia, South Africa, Canada, Indonesia, Nigeria and India.