
According to a Recent Study/Survey … End-of-February 2017 Edition
23 Min Read By MRM Staff
This end-of-February edition of According to … features how brand loyalty is established, top food trends in Canada, how digital transformation is driving technology investments and the enduring appeal of steakhouses. As part of our mission to be the go-to resource for on-the-go restaurant industry professionals, Modern Restaurant Management (MRM) magazine offers highlights of recent research.
Brand Loyalty Established With Fourth Visit
Research determines 90 percent likelihood that those who visit a restaurant for the fourth time will continue to visit on a regular basis.
According to research from Paytronix Systems, Inc.’s Data Insights team, restaurant brand loyalty is established on the fourth visit. Paytronix Data Insights reports that it is 90 percent likely that those who visit a restaurant for the fourth time will continue to visit on a regular basis, demonstrating brand loyalty.
As the consumer’s options continue to increase, the cost of customer acquisition for restaurant brands increases, and customer loyalty decreases. For this fourth research brief on Extracting Customer Insights from Big Data, the Paytronix Data Insights team zeroes in on the science of establishing brand loyalty. The report urges restaurants to use the data collected in their CRM systems to develop a customer nurturing campaign designed to propel the guest to their fourth visits.
“Rapid growth in the restaurant and retail market has left consumers with a wealth of options, which in turn increases the cost of acquiring new customers. It’s more important than ever to engage customers who are experiencing a brand for the first time,” said Lee Barnes, head of Paytronix Data Insights. “To get a good return on investment from acquiring new customers the challenge is to motivate a second, third, and fourth visit, at which point nine out of ten guests become repeat, loyal customers.”
The Paytronix Research Brief studied guest behavior over time, across separate study groups to analyze loyalty programs for quick-service chains, versus full-service. The report details how (and why) the more guests visit, the more likely they are to visit again, with a graph showing the dramatic increase in how likely guests from each group are to return after visits two, three, and four.
To read the Paytronix Research Brief, click here.
Hot Trends in Canada
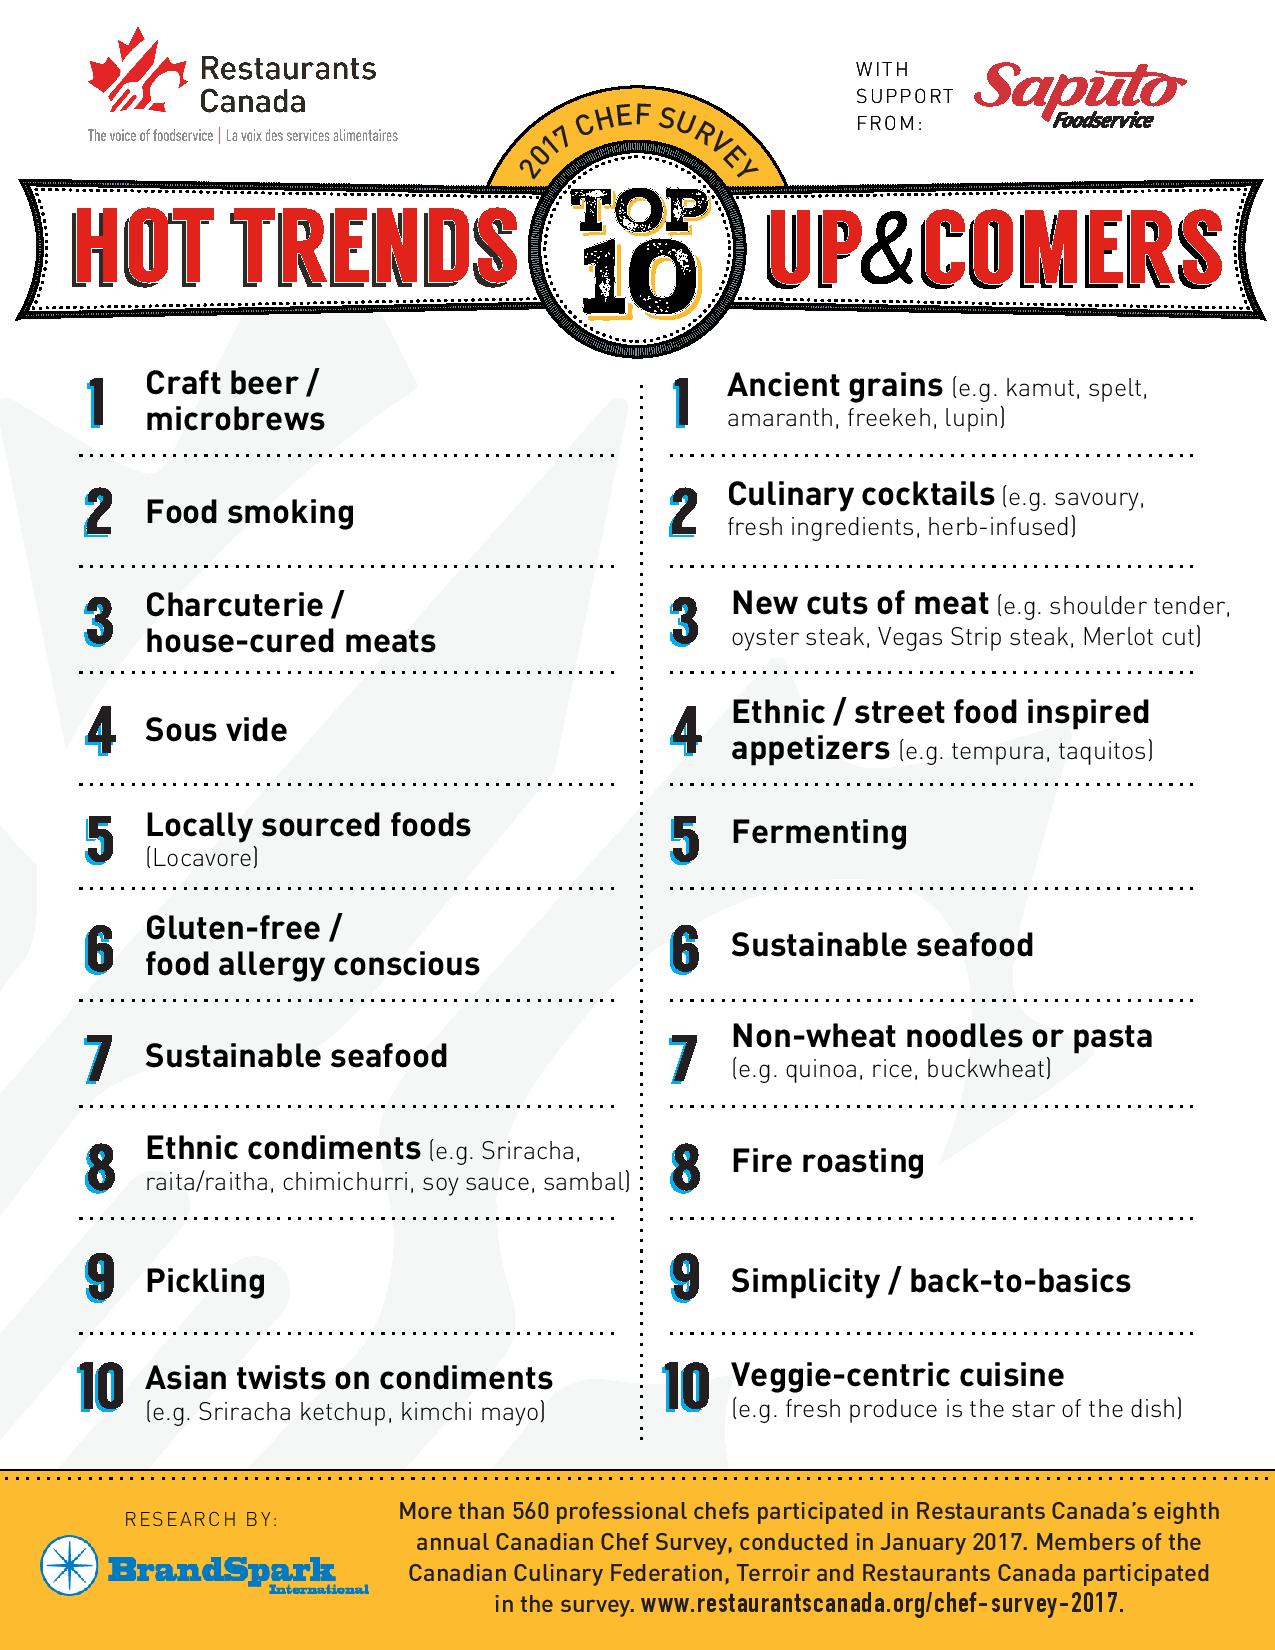
Craft beer isn’t going anywhere. For the third year in a row, this potent potable is the No. 1 hot trend in Restaurants Canada’s annual Canadian Chef Survey.
Top 10 Hot Trends
Chefs across the country have made their picks. Here’s what’s hot for 2017:
- Craft beer/microbrews
- Food smoking
- Charcuterie/house-cured meats
- Sous vide
- Locally sourced foods (Locavore)
- Gluten-free/food allergy conscious
- Sustainable seafood
- Ethnic condiments (e.g. Sriracha, raita/raitha, chimichurri, soy sauce, sambal)
- Pickling
- Asian twists on condiments (e.g. Sriracha ketchup, kimchi mayo)
- “Craft beer continues to dominate, but new trends are breaking ground,” says Shanna Munro, Restaurants Canada’s President and CEO. “The restaurant industry is always innovating and experimenting with different flavour palettes to push the boundary.”
“Trends come and go, but these solid, innovative products are here to stay and grow,” says Chef Charlotte Langley, culinary curator for RC Show 2017, an annual industry gathering taking place this weekend in Toronto. “Watch for fermented and fresh-to-go options. Seaweed is in, so we can give our oceans a break. It’s an ethically sourced product that’s great for you and our food economy.”
New for Canada’s 150th: Iconic Canadian foods
Nothing says Canadian like maple syrup. New this year, chefs were asked to name the quintessential Canadian food. And the winners are:
- Maple syrup
- Poutine
- Beef/Alberta beef
- About the survey
More than 560 professional chefs participated in Restaurants Canada’s eighth annual Canadian Chef Survey, conducted by independent market research firm BrandSpark International between January and February. RestaurantsCanada, the Canadian Culinary Federation, Terroir, and the industry at large took part. The survey was sponsored by Saputo.
Restaurant Numbers Decline
The total number of U.S. restaurants decreased by two percent from a year ago to 620,807 units, according to a count of U.S. commercial restaurant locations compiled each spring and fall by The NPD Group. With the decline in restaurant units, restaurant density (units per million population) is at its lowest level in the past ten years, dropping from 1,992 units per million in fall 2007 to 1,924 units per million in fall 2016, based on NPD’s Fall 2016 ReCount®, which includes restaurants open as of September 30, 2016.
If consumers continue to reduce their restaurant visits, we expect the number and density of restaurant units will continue to decline in response to the lower demand.
Independent restaurant units decreased by four percent and density declined from 1,132 units per million a decade ago to 1,002 units per million in fall 2016, reports NPD. On the flip side, chain restaurant unit counts grew by one percent in the fall 2016 increasing to 297,351 units. Density of chain restaurants grew from 860 units per million in fall 2007 to 922 in fall 2016.
The decline in independent restaurant units sourced to both the quick service and full service segments. The higher concentration of independent units, however, is in the full service segment, which includes casual dining, midscale/family dining, and fine dining. The fast casual quick service segment, which includes selected chains identified by NPD as “fast casual,” continues to expand, increasing units by 7 percent to 23,798. Density of fast casual restaurants is 74 units per million in fall 2016, up from 41 units per million in fall 2007.
Total U.S. restaurant visits dipped slightly in the year ending December 2016, according to NPD’s ongoing foodservice market research, CREST®. Quick service restaurant traffic, which represents 80 percent of total industry traffic, was flat last year. Visits to independent restaurants declined by two percent and chain restaurant visits were up one percent.
“This is the most significant drop in total U.S. restaurant counts since the recession,” says Greg Starzynski, director- product management, NPD Foodservice. “If consumers continue to reduce their restaurant visits, we expect the number and density of restaurant units will continue to decline in response to the lower demand.”
Steakhouse Trends Up
When it comes to American cuisine, there are few things more iconic than steakhouses. The slabs of marbled meat, the sizzling grills, the oozing butter, and the dripping bravado, maybe even a cowboy hat or two for ambiance—it’s enough to make even fictional steakophile Ron Swanson misty-eyed.
Yet for all the traditional steak dinners ordered daily, there are restaurants nationwide pushing the concept of the all-American steakhouse to new culinary heights, according to market research firm Packaged Facts in the brand new report 2017 Forecast: Culinary Trend Tracking Series.
“The steakhouse is back and will capture our attention in 2017. Not that the classic restaurant style ever disappeared, but a renewal of the model is taking place in response to new sources of beef and new flavorful expressions of the concept that get chefs and diners excited,” says David Sprinkle, research director, Packaged Facts.
Today’s steakhouse menus increasingly feature grass-fed cattle, locally raised animals, heritage varieties, meat butchered and dry aged in-house, and dishes that stem from the whole animal, not just the premium cuts. And that’s just the meat. Creative side dishes in lieu of old standards, global and seasonal flavors, and a wider menu selection also distinguish these new school operations.
Chefs and consumers both want their meat to taste delicious and to feel good about its consumption, too. This new breed of steakhouse broadcasts its mission to support local ranchers, factor in sustainability and animal welfare, and create a dining experience that showcases culinary flair, not just a grill master’s skill at cooking steak to the requested doneness. These operations are also designed to be more inclusive, more of a great place for all kinds of people to dine well, not just tradition-minded men on expense accounts.
As a result, the modern steakhouse is increasingly similar to other modern restaurants with a focus on distinctive and sustainable sourcing, local and seasonal produce, and global flavors and forms, all done within the steakhouse format showcasing cuts of meat as entrées with a choice of sides. Moreover, new menu categories (such as flatbreads) and service elements freshen the concept.
Handheld Food Proves Popular
Findings from Technomic Inc.’s “Foodservice Prepared Sandwich Category” study show that sandwiches, burgers and other handheld items account for nearly one out of every four dollars spent in the foodservice channel in 2016, totaling just over $205 billionin sales. Out of those items, burgers continue to lead the category with 44 percent of total US handheld sales, while deli and submarine sandwiches follow at 13 percent and 11 percent of consumer spend, respectively. Rising consumer favorites include formats such as tacos, burritos, breakfast sandwiches and wraps.
“Burgers and other traditional sandwiches remain the prominent choice for consumers who eat handhelds away from home today,” said Dave Henkes, senior principal of Technomic’s Advisory Group. “However, with Millennial and Gen-Z consumers growing in spending power and cultural influence, ethnic flavors and non-conventional formats are redefining what Americans typically identify as a standard sandwich. These unique formats and flavors will only grow as these younger populations continue to mature.”
While proteins and carriers are top of mind for sandwich consumers, other components such as toppings and sauces are convenient pathways by which operators can explore novel flavor profiles, such as spicy, sweet and Asian. Trending flavors include Sriracha and ghost pepper-spiked sauces, ginger, wasabi and chipotle.
Additional key takeaways from the report include:
- While more than half (53 percent) of all handheld sales occur during the lunch or mid-afternoon daypart, consumers are expanding their sandwich consumption to the morning and other snacking occasions.
- Proteins and carriers are ranked as the two most important sandwich components by both operators and consumers, with cheeses, toppings and sauces getting much less attention. It follows that focusing on the quality and variety of meats and breads is critical for operators to stay relevant in the sandwich category.
- Although sandwiches have a natural affinity for on-the-go consumption, operators and consumers note numerous pain points around packaging and delivery, such as cost challenges, temperature control and green packaging to solidify off-premise quality.
The Rise of Freedom Foods
Though highly fragmented, the global processed food and beverage market will see high growth due to several Mega Trends, finds Frost and Sullivan’s Visionary Science team. Key transformative forces include emerging business models such as crowdsourcing, marketplaces, gamification and mass customization, which are shaping retail, socioeconomics, connected eating in a cognitive era, and increasing popularity of “Freedom Foods” that meet ethical production standards. Major contenders, such as ADM, Clover Corporation, Coca-Cola, Dole Food, Tyson Foods and Unilever, are already rethinking product lines to align with these changes, focusing onconsumers’ health, wellness and embracing sustainable measures in processing to keep their lead.
The 2017 Global Processed Food and Beverage Industry Outlook, a part of Frost and Sullivan’s Visionary Science Growth Partnership Service program, finds that total global expenditure on processed food and beverage products by final consumers will grow to $4.675 trillion in 2017. The research delivers critical insights that enable food and beverage companies to successfully assess trends that will shape market sub-segments such as canned food, confectionery, dairy and ice cream, frozen and perishable groceries, and pet and processed food.
“The food and beverage market tends to be a safe investor haven in bad economic times due to its relative inelasticity of demand when compared with other industry sectors such as consumer durables,” said Frost and Sullivan Agriculture and Nutrition Global Director Christopher Shanahan. “However, certain categories, like dietary supplements, may take a disproportionate hit due to the perception of the products as ‘less essential’.”
In contrast to the saturated markets for processed food and beverage products, emerging markets such as Asia-Pacific and Eastern Europe will display higher growth. However, increasing consumer demand for pollutant and allergen-free products that are ethically produced without wasting natural resources will add to the cost of the production as well as to the overall pricing. This might discourage a large section of the targeted consumers. Food producers must launch extensive campaigns to promote Freedom Food or RSPCA Assured products since consumers are often willing to pay extra for them. Participants must also continue investing in state-of-the-art processing technologies to teach consumers about compliance and top-notch quality.
“The rise of Freedom Foods, specifically the need for enhanced nutrition and health, will dominate new food and beverage product innovation in 2017 and beyond,” said Shanahan. “The transformation will start from the development of safer and cleaner seeds and livestock to extend to value-added functional foods and more environmentally friendly packaging.”
What’s Trendy in California
Cooking with milk and a return-to-indulgence movement is back this year, according to chefs from across the state of California who participated in a January 2017 Food Trends culinary competition. With semi-finalist recipe submissions ranging from pork chops braised in milk to Latin-fusion desserts including Coconut Tres Leches and Churro Sando with Horchata Ice Cream and Dulce de Leche, one thing is certain – 2017 will be a stellar year for milk-loving foodies.
The winning recipe – Smoky Chili Chocolate Cake with Chocolate Kahlua Milk Frosting and Vanilla Milk Drizzle – was created by Merry Graham, a Southern California award-winning home cook and published author. Her recipe combines Dutch cocoa, ancho chili, brewed coffee, Kahlua and milk for a decadent dessert.
The competition was hosted by the California Milk Processor Board (CMPB), creator of the iconic got milk? and Toma Leche campaigns, which invitedCalifornia-based culinary artists to submit on-trend recipes featuring milk. Notable influencers who participated in the campaign include Shirley Chung, a season 11 finalist and current contestant on Season 14 of Top Chef, and Napa-foodie Ethan Speizer, founder and executive chef at late-night pop-up Nuri Napa.
Chef Chung contributed a Milk-Braised Napa Cabbage recipe that incorporates Virginia cured ham, ginger, Goji berries, a reflection of her “modern American cooking with Chinese soul” philosophy. Napa-notable Ethan Speizercontributed a traditional-style Milk-Braised Lamb Neck recipe that incorporates an array of spices and herbs such as bouquet garni and Shisho gremolata.
“The start of a new year inspires an openness to try something new, especially in the kitchen,” said Steve James, CMPB Executive Director. “We’re excited to showcase new culinary creations that demonstrate milk’s central role in expected food trends for 2017.”
Pasta and Coucous Market to Grow
The staple food of Italy and North Africa’s popular appetizer, together, are spanning the globe for being affordable, tasty and healthy as well. There’s no denying that pasta and couscous will continue to be in demand for their easy-to-make preparatory approach and their status as flavorsome culinary delicacies. A latest study published by Persistence Market Research projects that the global market for pasta and couscous, which is presently estimated at $ 29.5 billion, will soar at 3.7 percent CAGR to bring in a little over $ 42 billion in revenues by the end of 2026.
Increasing health concerns due to growing incidences of lifestyle diseases such as diabetes, blood pressure, heart problems, etc., and rising awareness about harmful effects of consumption of synthetic ingredients and pesticides boosted demand for organic food across the globe, during 2011-2015. Further, rising focus of government organizations and organic food manufacturers towards promoting benefits associated with organic food consumption, growing annual per capita spending on food, easy availability of organic food products and infrastructural developments in supply chain and distribution network are projected to augur well for global organic food market over the course of next five years.
According to the report, titled “Global Market Study on Pasta and Couscous: Couscous Product Type Segment Expected to Gain Significant Market Revenue Share by 2026,” the global demand for pasta and couscous will grow moderately as global consumers continue to be less aware about couscous’ nutritional content. Fluctuating prices of raw materials used for making pastas is also a key deterrent revealed in the report. The most significant factor restraining the growth of global pasta and couscous market is volatile competition imposed by other noodle-based and rice-based staple food products. Canned or preserved pasta, despite being affordable, will also see dip in its global sales, owing to the health concerns arising from speculated product analysis. 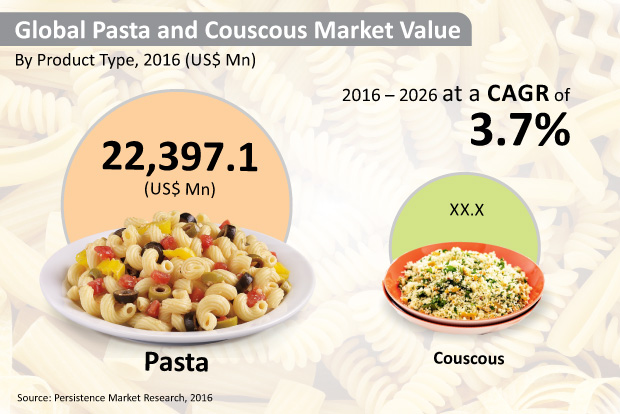
How the World Likes its Pasta and Couscous
When it comes down to buying pasta or couscous, a majority of people in the world prefer dried and fresh/chilled products. In 2017 and beyond, one out of every two products sold in the global pasta and couscous market will be a dried product. Fresh or chilled pasta and couscous products will also gain traction, accounting for one-third of global revenues through 2026. Key findings in the report indicate higher demand for macaroni, fusilli and penne pastas, while global spaghetti revenues will showcase growth at 3.1 percent CAGR.
On the other hand, global consumption of whole grain couscous products will continue to outpace that of traditional couscous. Comparatively, people from around the world will prefer being served with pasta, while revenues emanating from global couscous sales will account for about one-fourth of global pasta and couscous revenues by the end of 2026.
Highest Demand for Multigrain Pasta and Couscous
With respect to raw materials used for commercial-scale production of pasta and couscous products, the report reveals surging demand for multigrain ingredients. By the end of 2026, revenues amassed from sales of multigrain pasta and couscous are anticipated to rise at 3.9 percent CAGR. Raw materials such as 100 percent durum wheat, 100 percent wheat, and mix (durum and wheat) ingredients will also garner high demands in the future. Consumption of maize as raw material for production of pasta and couscous will, however, be the lowest.
Additional highlights of the research report:
- In 2016, North America’s pasta and couscous market accounted for a little less than 25 percent of global market value
- Supermarkets and hypermarkets will be the largest distributors of pasta and couscous in the world, followed by unorganized small retail stores
- Revenues from online sales of pasta and couscous will grow at a modest CAGR of 2.8 percent
- With pasta being one of the prominent staple foods in this region, Europewill be the world’s largest market for pasta and couscous
- Asia Pacific’s pasta and couscous revenues are also expected to surge rapidly, registering growth 3.8 percent value CAGR
Dressing Vinegar and Condiment Market
Dressing vinegar and condiments are predominantly included in almost every kitchen in the world. Their importance in culinary preparations and food seasonings makes them some of the highly-consumed food ingredients in the world. However, manufacturing of dressing vinegar and condiments has been tainted by emergence of speculated production practices being carried out around the world. Consumers are being conscious regarding health prejudices emanating from contaminated raw materials used in production of vinegar. Following such factors, the global demand for dressing vinegar and condiments is expected to remain restrained from growing lucratively. Persistence Market Research recently conducted a study on global market for dressing vinegar and condiments which estimates that by end of 2024, an estimated 313,671 metric tons of dressing vinegar and condiments will be sold in the world.
According to Persistence Market Research’s report, titled “Global Market Study on Dressing Vinegar and Condiments: Apple Cider Vinegar and Red Wine Vinegar Segments Projected to Gain High BPS Shares During 2016 – 2024” –
In 2016, more than 115,000 metric tons of dressing vinegar were sold globally, while global consumption of condiments surpassed 125,000 metric tons in volume.
By the end of 2024, around 147,694 metric tons of condiments are expected to be sold in the world, while global consumption of dressing vinegar is predicted to reach 165,977 metric tons.
In terms of volume, global dressing vinegar market will soar at 4.7 percent CAGR, while global market for condiments will register a sluggish CAGR of 2.1 percent.
Global Dressing Vinegar and Condiments Market: Key Players
US-based manufacturers of dressing vinegar products and condiments are recognized as leading brands in the global market. Companies such as Fleischmann’s Vinegar Company, Inc., Annie’s Homegrown, Inc., BRIANNAS, Del Sol Food Co., Newmans Own Inc., and the Kraft Heinz Company are actively partaking in growth of global market for dressing vinegar and condiments. Besides, Puget, Cecil Vinegar Works, Mizkan Group, and Borges Branded Foods S.L.U are also prominent manufacturers of dressing vinegar and condiments profiled in the report.
Higher Demand for Balsamic Vinegar
The report projects that balsamic vinegar products will be widely-preferred by consumers in 2017 and beyond. Other types of dressing vinegar such as white wine vinegar, rice vinegar, garlic vinegar, sherry vinegar, cava vinegar and honey vinegar will witness marginal rise in their global demand. However, more than 130,000 metric tons of apple cider vinegar are anticipated to get sold by the end of 2024. Balsamic vinegar will continue accounting for one-third of global dressing vinegar revenues, while red wine vinegar is likely to be the second-most dominant type of dressing vinegar throughout the forecast period.
A major portion of global demand for dressing vinegar products will keep arising from Europe. In 2017 and beyond, European countries will be accounting for at least one out of every two dressing vinegar products being sold globally. Consumption of dressing vinegar products will be the fastest inAsia-Pacific region, while North America will remain the third-largest regional market by the end of 2024.
Vinaigrettes – Top-Selling Condiments in the World
Over 60 percent of global condiments volume being consumed during the projection period will be accounted by vinaigrettes. Among theses, demand for emulsified vinaigrette condiments will account for sales of over 65,000 metric tons condiments by the end of 2024. However, global sales of condiments labelled as seasoning sauces will incur sluggish growth. The report further expects a majority of global condiments consumption being concentrated in European countries. In 2016, Europe accounted for sales of an estimated 60,818 metric tons of condiments. On the other hand, consumption of condiments is projected to drop in North America, while Asia-Pacific’s condiments consumption will reach surpass 27,000 metric tons by 2024-end.
Need for Aspen Chopsticks
The global one-off chopsticks market is expected to reach $41.1 billion by 2025, according to a new research conducted by Grand View Research, Inc. The growing need for disposable chopsticks, particularly made of aspen, is projected to spur the market growth over the forecast period. The fact that chopsticks form an integral part of tableware and kitchen utensils, particularly in the Asian countries, is expected to remain a key driver.
The one-off chopsticks market is anticipated to witness moderate growth over the forecast period, globally. This can be accredited to the use of aspen for producing chopsticks as compared to other materials such as bamboo, birch, and cottonwood, among others. Furthermore, manufacturers are gradually shifting their plants to North America and other regions, owing to the surging government regulations pertaining to deforestation and availability of aspen in these regions. However, the environmental impact and surging health concerns, due to the adoption of one-off chopsticks, are the key factors challenging the market growth.
Further key findings from the report suggest:
- The bamboo chopsticks segment captured over 50 percent of the total revenue in 2015. However, aspen chopsticks are projected to witness high growth at a CAGR exceeding 11 percent from 2016 to 2025, owing to the surging espousal in Asian countries and better life span against their counterparts.
- The Asia Pacific region dominated the market in 2015 with a market share of over 60 percent. However, North America is projected to emerge as the fastest growing market and is expected to witness a healthy CAGR of over 8 percent, primarily due to the rising aspen chopsticks manufacturing activities in the region.
Market for Organic Tea and Coffee Grows
According to a TechSci Research report, “United States Organic Tea and Coffee Market, By Type, By End User, Competition Forecast and Opportunities, 2012 – 2022”, the market of organic tea and coffee in the United States is projected to grow at a CAGR of over 13 percent during 2017-2022. Growing instances of lifestyle diseases, increasing disposable income, rising awareness among consumers and surging environmental concerns are expected to aid the country’s organic tea and coffee market during 2017 – 2022. Moreover, expanding distribution channel, increasing visibility as well as accessibility of organic tea and coffee in retail outlets and aggressive marketing strategies being adopted by companies and online retailers is expected to positively influence United States organic tea and coffee market over the next five years.
As consumers in the United States are becoming more health-conscious, they are seeking products which have minimal impact on their health and provide nutritional benefits. Organic products, especially beverages, are considered healthy as natural ingredients or substances are used to prepare them. All organic products are grown without any use of artificial chemicals, pesticides, or fertilizers. In the United States, the demand for organic tea and coffee is increasing owing to increasing consumer awareness regarding their high nutritional value, in comparison to conventional tea and coffee products.
More Cognac Drinkers
Cognac’s recent strong growth is poised to continue in the coming years, driven by increased consumption in the US, China and the UK, according to a joint report from just-drinks and the IWSR featuring the latest full-year data available. While growth will moderate slightly from the near-4 percent volume increase seen in 2015, global consumption will increase by some 2m cases by 2021, the Global Cognac Insights report says, with the US moving above 6m cases by the end of the forecast period.
China – which remains the largest Cognac destination by value despite a recent slump in the wake of the government’s anti-extravagance drive – will continue to recover, with growth accelerating in a few years’ time.
“Although Cognac has suffered in China, the category has to some extent been protected by its longevity in the market,” says the report. “Forced to choose, many consumers will opt for Cognac over rivals such as Scotch whisky.”
And it adds: “It seems inconceivable that there will not be some kind of rebound in the luxury Cognac market in China over the coming years; the key is to know precisely when, and to what extent.”
While Chinese consumers tend to view relatively inexpensive VS Cognacs as too cheap, opting for VSOP and above instead, VS is the key driver of Cognac’s biggest volume market, the US. As China has cooled, producers have increasingly targeted the US, resulting in a double-digit sales increase in 2015.
However, new entrants to the market are not necessarily copying the template of the dominant Hennessy brand and selling VS to the hugely influential African-American demographic; instead, they are increasing prioritising value over volume.
As demand for luxury Cognac has declined in China, companies are rerouting inventory investment into younger spirit – a reflection of the growing importance of the VS and VSOP segments in markets from the US to Africa to Eastern Europe. There is an enormous and growing gulf between the ‘big four’ Cognac houses – Hennessy, Martell, Rémy Martin and Courvoisier – and the rest, with the quartet accounting for almost 90 percent of the category’s retail value in 2015.
Specialty Malts to Soar
In parallel with the rise in global consumption of alcoholic beverages, local entrepreneurs from all corners of the world have begun treading the waters of brewing businesses. A considerable rise in the number of microbreweries being set up across the globe is stimulating the growth in consumption of specialty malts – a key ingredient for making alcoholic beverages such as beer. Innovations in brewing techniques have further consolidated the application of specialty malts in production of flavored alcoholic beverages.
A new research report from Future Market Insights reveals that the global market for specialty malts, which is currently valued at an estimated US$ 2.16 billion, is expected to soar at a steady CAGR of 6.4 percent and bring in revenues worth over $4 billion by 2026 end.
Since the growth in demand for specialty malts continues to remain contingent upon global alcoholic beverage consumption, more than one million tonnes of specialty malts are anticipated to be consumed through 2026. Incidentally, this will also shore up the global production of barley, wheat, corn, soybean and other grains used for deriving specialty malts. By lending a unique flavor, texture, and color, the application of specialty malts continues to gain significance in production of beverages, revenues from which will impose nearly 90 percent share on global specialty malts market value throughout the forecast period. The research reveals that revenue share of alcoholic beverages in the global specialty malt market will remain consistent at nearly 82 percent through 2026. Meanwhile, about 130,000 tonnes of specialty malts were globally consumed for production of non-alcoholic drinks and beverages in 2016.
Western Europe – Largest Consumer of Specialty Malts
When it comes to consuming flavored alcoholic beverages, consumers in Western European countries such as Germany, France or Belgium will certainly not shy away. By the end of the forecast period, more than 500,000 tonnes of specialty malts will be consumed across Western Europe, making it the largest consumer of specialty malts in the world. With respect to production, the demand for specialty malts will register stellar growth in theAsia-Pacific excluding Japan (APEJ) region. The APEJ specialty malts market will register the highest value CAGR of 7.8 percent, and procure over US$ 1 billionrevenues during the projected period. North America and Latin America are anticipated to account for a collective share of more than 24 percent in global specialty malts revenues through 2026.
Demand Grows for Hazelnuts
Even though it is characteristically a dry fruit, hazelnut guarantees that its consumers will be indulging in some mouth-watering treats. Food products and drinks derived from hazelnuts have left a flavorsome imprint of the taste buds of billions of people in the world. Rising consumption of chocolate truffles and confectionary products such as Nutella or Ferrero Rocher witnessed across the globe highlight that the world is less likely to put a stop to its hazelnut intake. In 2016, around 948,876 metric tons of hazelnuts were consumed by individuals, bakeries as well as leading food and beverage makers in the world. Persistence Market Research estimates that the global hazelnut market is presently valued at $ 7,200 Mn, and will soar at 5.9 percent CAGR to bring in US$ 12,730.6 Mn revenues by the end of 2026.
Compared to other nuts and dry fruits, the global market for hazelnut is still at a nascent stage and will surge steadily in the years to come. Nutritional content of hazelnut products draws consumers towards them, who are further satisfied by the savory flavor. Correspondingly, retailers are growing more inclined towards spiking their dry fruit sales by increasing the presence of such products on the store shelves. Furthermore, protein-rich hazelnut products are also garnering surplus demand for being a part of several healthy dietary practices trending across the globe.
In the report, titled “Global Market Study on Hazelnut: Food End Use Industry Segment Anticipated to Dominate the Global Market in Terms of Value and Volume over the Forecast Period,” the global hazelnut consumption has been broken down into two parts of the hazelnut; the kernel and the shell. In 2016, more than 90,000 metric tons of hazelnut shells were consumed globally, accounting for less than 1 percent of global hazelnut revenues. A majority of edible products made from hazelnuts are produced by extracting the nutritional fillings present in the kernels. By the end of 2026, more than US$ 12,600 Mn worth of hazelnut kernels are being projected to be sold in the world.
The report reveals that demand for raw hazelnut will keep growing robustly throughout the forecast period. In the years to come, more individuals are expected to buy raw hazelnuts to experiment with their culinary skills. By 2026-end, nearly one-third of global hazelnut revenues will be accounted by sales of raw hazelnuts. However, processed hazelnut products will witness a considerably higher consumption, revenues from which will be valued at US$ 7,400 Mn by the end of 2026.
Digital Transformation is Number One for Global Retailers
The next wave of change is sweeping across retail as the industry looks to leverage digital technologies to reach the modern shopper. The Internet of Things (IoT), big data, robotics and augmented reality are some of the ways CEOs reveal they are choosing to invest their capital in the coming year to better compete. The fourth annual JDA survey of more than 350 global retailers finds that a digital transformation strategy is their No. 1 priority in 2017; 69 percent of executives say they plan to increase their investment in digital transformation over the next year
This and other key findings are highlighted in the “CEO Viewpoint 2017: The Transformation of Retail,” a new report prepared for JDA Software Group, Inc., by PwC.
“The investment in technologies underscoring digital transformation was a major undercurrent within this year’s survey results, which is no surprise, since retail CEOs understand just how important it is to invest in the technology that will improve the customer experience,” said Lee Gill, group vice president, global retail strategy, JDA. “The next wave of results also reveal the continued balancing act retailers are struggling to maintain with delivering superior omni-channel execution and profitability, all while meeting the demands of the modern shopper, and keeping pace with the digital transformation underway across the supply chain.”
Digital Transformation Driving Technology Investments
Retailers are leveraging digital technologies to better understand and connect with their consumers, giving customers reason to engage with them across retail channels. Despite the obvious importance of having a digital transformation strategy in place, surprisingly, more than half of respondents – 52 percent – have not defined or started implementing a digital transformation strategy yet. Globally, Chinese retailers are more likely to be implementing their defined digital transformation strategy (58 percent) than the U.S. (40 percent), with 19 percent of U.S. retailers struggling to or choosing not to define this strategy at all.
Mobile-enabled applications (85 percent), big data (86 percent) and use of social media data (85 percent) are the top technologies survey respondents are investing in or plan to over the next 12 months, while automation and IoT are lower on the list for investment but gaining momentum as they are perceived as true game changers. The use of social media and big data is highly valuable in giving retailers deep insights into rich sources of customer information, allowing them to create credible customer segments, while gaining insight into shopper preferences.
Omni-channel Execution Issues Continue
As omni-channel retailing continues to mature and retailers have blurred the lines between online and store, their attention has shifted to execution and profitability. Omni-channel execution amongst global retailers continues to lag in areas of order fulfillment, and profitability is still a challenge, with only 10 percent of those surveyed able to make a profit while fulfilling omni-channel demand. Only 12 percent of CEOs surveyed, down from 19 percent in 2014, provide a seamless shopping experience across channels. These retailers are finding their omni-channel offerings to be too complex or expensive and are choosing to scale back.
Omni-channel Fulfillment and Returns Spending Priorities
Seventy-four percent of respondents believe that the cost of customer returns is impacting profits to at least some extent. Retailers in the U.S. are less likely to experience profit erosion from customer returns than other markets. As CEOs look to regain profitability, their chosen areas for order fulfillment investment are prioritized by those that are the most important and net the most financial return.
The survey found that retail CEOs are increasing their investment in buy online, pick up in-store (BOPIS), with 51 percent of survey respondents saying they offer or plan to offer BOPIS in the next 12 months – up from 47 percent in 2016. Buy online, ship to store has picked up steam in the past year with 48 percent of retail CEOs investing in this service or planning to in the next 12 months. Conversely, fulfillment options that are becoming costlier and less profitable are areas where CEOs are decreasing investments in 2017. These include same day delivery (reduced to 33 percent, down from 43 percent in 2016), and providing specific delivery time slots (down to 27 percent vs. 48 percent in 2016).
The rising costs of order fulfillment are also pushing executives to rethink their strategy overall. 2017 will see increased charges for online orders (57 percent plan to or will make this change in the next 12 months), a rise in minimum order thresholds for free standard home delivery (62 percent plan to or will make this change in the next 12 months), and raising the minimum order value for BOPIS (55 percent plan to or will make this change in the next 12 months).
“While retailers have increased fulfillment options over the last year to meet consumer demands, as BOPIS becomes a staple and buy online, ship to store emerges as another core fulfillment capability, retailers now need to balance the effectiveness and profitability of the fulfillment channels they offer – with customer satisfaction. Because if shoppers experience a problem with home delivery or in store pickups, that is a lost sale – and customer – that retailers can’t afford in a highly competitive market,” noted Gill.
“Since JDA first commissioned PwC to conduct this survey in 2014, we have witnessed unprecedented change sweeping across the retail industry that continues in earnest as retailers reimagine their strategies to transform the customer experience, making it seamless and personalized, no matter how they shop. Supply chain complexities and cost will continue to challenge retailers, and the difference between winners and non-winners will be how much, or how little, retailers understand their customers moving forward,” concluded Gill.
How Incentives are Budgeted
The Incentive Research Foundation is pleased to announce the release of the IRF 2017 Outlook Study, an analysis of how incentive, rewards, and recognition programs are being designed and budgeted for 2017. The study includes a detailed look at key industry metrics. With the release of the IRF 2017 Outlook Study, the IRF launches its Net Optimism Score, a new simplified metric to track the economic outlook for the incentives industry.
Executed in the fall of 2016, nearly 250 industry representatives including suppliers, corporate end users, and incentive house representatives gave their feedback on the outlook for U.S. incentive travel and reward programs in 2017.
“The IRF has tracked the vitality and variability in the incentive, rewards, and recognition market for almost ten years,” said IRF President Melissa Van Dyke. “The IRF 2017 Outlook Study not only provides up-to-date industry data, it also puts this year’s findings in a historical and cyclical context, so we can deliver a big-picture view of the industry.”
The IRF 2017 Outlook Study introduces the IRF’s new simplified metric to track the economic outlook for the incentives industry. The Net Optimism Score is the percentage of people providing a positive rating, subtracted from the percent giving a negative rating. A higher positive score indicates optimism in the industry. The Net Optimism Score is similar to the Net Promoter Score management tool used to gauge the loyalty of a firm’s customer relationships. Analysis shows that the Net Optimism Score within the incentive travel industry tracks closely with overall U.S. economic performance, often acting as a leading indicator. For example, in late 2011, the industry Net Optimism Score showed a dramatic dip – likely in anticipation of the economic decline that began shortly after.
Additional insights from the IRF 2017 Outlook Study include:
- The Economic Net Optimism Score for fall 2016 is 26 percent, reflecting the incentive travel industry’s moderate optimism about the economy and its impact on the industry. This is down from a recent high trend surpassing 50 percent that began fall 2013, but continues to outperform the extreme dips seen in 2009 and 2011.
- There is a strong positive outlook for budget increases in incentive travel programs – overall and for FandB and rooms. More than half of respondents agree that costs are increasing more than budgets – placing all stakeholders in a difficult position.
- The most commonly-selected destinations for incentive group travel are the USA, Caribbean, Mexico, and Europe.
- Incentive merchandise and gift card programs are expected to continue enjoying positive benefits from the economy, but the degree of optimism has diminished over the past year.
- Electronics are the most prevalent rewards with third party service providers, while clothing/apparel is most common with the corporate audience.
- Three-quarters of U.S. based merchandise and gift card programs include international participants in the non-cash rewards programs they operate.
More Spending on Recreation
US consumer spending on recreation services is forecast to rise 3.4 percent annually to 2021, according to Recreation: United States, a report recently released by Freedonia Focus Reports. Faster gains are expected in the Live Entertainment and Spectator Sports segments of the market, bolstered by growth in disposable personal income and a shift in consumer preference toward spending on experiences rather than possessions.
In addition, recreation providers are appealing to an increasingly diverse population with new amenities and entertainment offerings. Features such as nursing suites in sports stadiums cater to a growing base of female sports fans. In the Live Entertainment segment, diverse musical acts are drawing consumers of various ages to music festivals. For example, Goldenvoice’s Desert Trip festival in October 2016 featured notable musicians and groups that are especially appealing to baby boomers, such as Bob Dylan, Neil Young, Paul McCartney, The Rolling Stones, and The Who.
These and other key insights are featured in Recreation: United States. This report forecasts US personal consumption expenditures (PCE) on recreation services in US dollars to 2020. Total spending is segmented by service in terms of:
- gambling
- amusement parks and related services
- clubs and participant sports
- live entertainment
- spectator sports
- movie theaters
- museums and libraries.