
According to a Recent Study/Survey … End-of-August 2018 Edition
38 Min Read By MRM Staff
This edition of Modern Restaurant Management (MRM) magazine's "According to …" research roundup features information on restaurants closing for Labor Day, best and worst states for tipped workers, "near me" shopping report, hot new restaurant openings, Gen Z most-talked about brands, football food trends, popcorn flavor innovation and most scenic cities.
Open for Labor Day?
Since hundreds of thousands of restaurants use Square to run their businesses, they took a look at how many restaurants closed for Labor Day. Millions of people travel for the long weekend (all needing to eat, and sometimes planning for specific restaurants), but Square has seen more and more restaurant operators make the call to give their workers holidays off, too.
Here are the top cities:
Top 10 cities where the most restaurants are closed (all have over a third of their restaurants closed on Labor Day):
Phoenix – over half (53 percent) of restaurants closed for Labor Day
Orlando – 41 percent of restaurants closed
Minneapolis – 38 percent
Salt Lake City – 37 percent
Atlanta – 36 percent
Denver – 36 percent
San Jose, CA – 36 percent
San Diego – 35 percent
Honolulu – 35 percent
Chicago – 35 percent
Top five cities where the most restaurants stay open:
San Antonio – tops the charts with 96 percent of restaurants open on Labor Day
Brooklyn – 86 percent of restaurants open
Sacramento – 85 percent
Washington, DC – 84 percent
Seattle – 83 percent
The Best and Worst States for Tipping
According to TSheets, in the US we tend to tip more generously and for more services anywhere in the world. The quality of life of a tipped worker, however, varies from place to place and depends on the work performed, local labor laws and how much customers value their drinking and dining experiences. Stephanie Jeneson, an analyst at TSheets, delved into the issue.
"I wanted to find the very best — and very worst — states in America to be a tipped worker. I surveyed 208 anonymous respondents from each state, asking them about their tipping habits." Here's a sneak peak what I revealed:
Connecticut wins the best place to be a tipped worker with an average tip rate of 18.58 percent and a minimum wage of $10.10 per hour.
Wyoming, on the other hand, loses with an average tip rate of 15.91 percent and a minimum wage of $2.13.
Without considering minimum wage data, Maine takes the stage with an average of 19.36 percent per tip.
You can read the full report and learn more about the methodology here.
Near Me Shopping Report
Uberall, Inc. announced the results of its first annual “Near Me Shopping Report.” Uberall commissioned a survey of more than 1,000 smartphone users across the US to understand their “near me” preferences and behavior. The study was done between July 23-27, 2018.
According to Google, mobile “near me” searches – localized mobile searches for brands and products close by – have increased by 200 percent. Uberall’s “Near Me Shopping Report” examines what that means for consumers.
Nearly 70 percent use their smartphone to help them shop
According to the report, 69 percent use their smartphone to help them shop, according to the results. When asked how they typically use their smartphone to help them shop, the top-five responses included: 1) researching products (63 percent); 2) price comparison (62 percent); 3) search for coupons or deals (56 percent); 4) check for store hours (54 percent), and 5) find nearby store locations (52 percent). 
“Smartphones have become the go-to research companion for consumers,” said Josha Benner, CRO and Co-founder of Uberall, Inc. “For all the talk of mobile displacing brick-and-mortar shopping, our data finds that these devices are hugely supportive of in-store foot traffic. Checking hours and finding nearby locations were two of the most popular use cases from respondents.”
82 percent of shoppers have done a ‘near me’ search
When asked if respondents have ever tried a “near me” search on their mobile devices 82 percent said “yes.” Only 18 percent have not. Among millennials, “near me” adoption was even greater, at 92 percent versus eight percent.
“Near me searches have exploded, with more consumers prioritizing proximity over brand loyalty,” added Benner. “The shift is also being driven by changes in consumer behavior, with more people opting to keep GPS and location services on while using their devices. Years ago, this would have killed your battery. That’s not the case anymore. As a result, more consumers are taking advantage of proximity-based searches. This is an opportunity for brands and marketers.”
Food ‘near me’ searches most typical, with 84 percent
When asked what they typically use “near me” searches for, 84 percent said food. Rounding out the top-five were entertainment (56 percent); banking (50 percent); apparel (41 percent); and personal care (38 percent).
“The restaurant and quick-service industry sees a lot of ‘near me’ searches,” added Benner. “This makes sense given how proximity-based eating is as a behavior. It will likely always hold the top spot. However, ‘near me’ searches for the other four categories in the top-five will only increase in the future.”
When asked to rank “specific retailer or store ‘near me’ searches,” “general product ‘near me’ searches and “specific brand ‘near me’ searches,” the top response was “a specific retailer or store.” Forty-eight percent ranked it first. This includes searches like “Foot Locker near me.” Generally searching for a product (e.g., “Where can I buy toys near me”) was the runner-up with 29 percent, followed by searching for a specific brand (e.g., “Where can I buy Nike near me”) at 23 percent.
"It’s not surprising that many ‘near me’ searches start with a specific retailer or store in mind,” added Benner. “But nearly 30 percent of these searches — and growing — are generic and serendipitous. That means marketers need to build a search strategy that lures in-market shoppers who may not be directly seeking them out and are, instead, looking for a product or category.”
60 percent say they click what they see first
Respondents were asked, after completing a ‘near me’ search, how likely they were to click on the first two to three search results they saw. Sixty percent said they were “very likely” to do so, with another 33 percent saying “somewhat likely.” In total, 93 percent said they were likely to click on the first set of results. Alternatively, 5 percent percent said they weren’t sure and just 2 percent said they wouldn’t likely click.
“With huge growth in ‘near me,’ brands and marketers need to adapt to this new front door,” said Benner. “Searches are becoming more proximity and location-based. And what has been true for general organic search holds true for local search — whoever shows up first and in the top set of results will win the day. So, it’s important to optimize local presences online to meet that shift and deliver against demand.”
Food & Beverage Crystal Ball
Nixon Peabody LLP’s Food, Beverage & Agriculture (FBA) practice shared their quarterly outlook relating to trends and regulations they’re keeping an eye on. The full outlook is here, but below are some highlights.
Struggling Restaurants: Restaurants experiencing significant market challenges reads like a who’s who of restaurant chains: Applebee’s, Bertucci’s, Bob Evans, Cosi, IHOP, Joe’s Crab Shack, Romano’s Macaroni Grill, Ruby Tuesday, Outback, Subway. As consumers’ dining habits have shifted toward restaurants perceived to offer healthier alternatives, traditional casual-dining restaurants in the U.S. have struggled. Nixon Peabody Financial Restructuring and Bankruptcy partner Lee Harrington believes that “involved parties—owners/operators, franchisors/franchisees and contract counterparties—know their rights and obligations under any contract.”
Revised Nutrition Facts and Supplement Facts Label: The recent backlash over FDA’s proposed rule change that would make producers of honey and maple syrup label their products as containing “added sugars” may just be the beginning. Similar uncertainty may result with regard to the “dietary fiber” requirement, as the FDA recently approved eight non-digestible carbohydrates that manufacturers will be able to include when calculating the total amount of fiber per serving, as long as they provide health benefits. Tracey Scarpello, an attorney within our Complex Commercial Disputes Group, believes “The shifting public perception of food labels has prompted the introduction of other food labeling initiatives, the most recent of which—the Food Labeling Modernization Act of 2018 introduced by Rep. Frank Pallone, Jr. (D-NJ) in April 2018—attempts to further reform food labeling laws.”
Liabilities for Food & Beverage Social Media Influencers: The prevalence and selling power of social media influencers has resulted in food and beverage companies using social media platforms and talent to market their products. The Federal Trade Commission Act, the primary consumer protection act, which regulates advertisements, requires advertising be truthful and non-deceptive. This means influencers must try the promoted product and endorse it truthfully from that experience. It also means influencers cannot make unsubstantiated claims about the product that the food or beverage company would be prohibited from making. “While companies often provide influencers with guidelines or even scripts, companies often attempt to shift all FTC and attendant liability to influencers via contractual representations and warranties and indemnities, and they should therefore be mindful of such promotions and messaging points,” according to Intellectual Property partner Ellie Altshuler.
Obtaining a Strategic Partner: Identifying a strategic partner is an effective means for securing much needed capital, obtaining key industry insights and establishing important business connections. “While we expect early stage FBA companies will continue to partner with industry leaders, we further anticipate the relationships between companies and partners with the strongest synergies will reap the biggest and most sustainable rewards,” said Corporate partner Tyler Savage.
U.S. Restaurant Count
The U.S. restaurant count reached 660,755 in spring of 2018, a one percent decrease in units from a year ago, based on a recent restaurant census conducted by The NPD Group, a leading global information company. The primary source of the decline in U.S. restaurant units was a two percent drop in independent restaurant units compared to a stable restaurant chain count, reports NPD’s Spring ReCount®, a census of commercial restaurant locations in the United States compiled in the spring and fall each year.
Restaurant chain counts grew to 307,940 units, which kept the total chain count flat compared to spring 2018. The total number of independent restaurants stood at 352,815 units, a decrease of 5,719 units from last year. Total quick service restaurant (QSR) units declined by 1 percent to 357,766 due to a decline in QSR independents. Full service restaurant units, which include casual dining, family dining, and fine dining restaurants, stood at 302,989 units in Spring 2018, a one percent decline, according to NPD’s ReCount, which includes in its spring 2018 census all restaurants open as of March 31, 2018.
While the number of independent restaurant units in the U.S. dropped by 2 percent, the independent restaurant units remaining open represent over half of all U.S. commercial restaurants. Independent commercial restaurant operators are forecast to spend $43 billion with foodservice manufacturers and broadline foodservice distributors in 2020, a 3.4 percent compounded annual growth rate over 2018 and will represent 15 percent of total restaurant operator spend. In the year ending June 2018, cases shipped from broadline foodservice distributors to independents increased by 4 percent.
“The restaurant unit declines captured in our spring 2018 census are reflective of the sluggish restaurant traffic the industry has been experiencing over the last several years,” says Annie Roberts,vice president of NPD’s SupplyTrack®, ReCount®, and Foodservice Future Views research services. “It takes a lot of resources and capital to withstand tougher times, and an experience and offering that keeps customers coming back.”
Bullfrog & Baum's Fall Preview
According to Bullfrog & Baum, with the start of fall comes a new season of exciting restaurant and hotel openings around the globe. From a British-inspired brasserie in New York City to the Art Deco Capitol Kampinsky Hotel in Singapore, here's where to eat, drink and vacation this fall.
New York
Bluebird London
Address: 10 Columbus Circle, 3rd Floor, New York, NY 10019
September 2018
A British Brasserie from the brilliant London-based D&D Restaurant Group located in the Shops at Columbus Circle, the dining and shopping hub of midtown
Mokum
Address: 464 Amsterdam Ave., New York, NY 10024
October 2018
Mokum, the Yiddish word for "place" or "safe haven, is bringing a health conscious menu to Manhattan's vibrant Upper West Side
Black Tap Herald Square
November 2018
The instagram-obsessed Black Tap Craft Burgers & Beer continues their NYC takeover with a fourth location centrally situated in bustling Herald Square.
Washington, D.C.
Officina
Address: 1120 Maine Ave SW, Washington, DC
September 2018
From Michelin-star Chef Nicholas Stefanelli, Officina opens at The Wharf, DC's newest neighborhood. The restaurant features one of the country's only Amaro libraries and views of The Potomac from its glistening rooftop.
Las Vegas
Vetri Cucina Las Vegas
Address: The Palms Las Vegas, 4321 W. Flamingo Road, Las Vegas NV
November 2018
World renowned Chef Marc Vetri, opens Vetri Cucina at The Palms. This is the first expansion of his 20-year old acclaimed Philadelphia flagship.
San Diego
Dog Haus Biergarten Vista
Address: 227 E Broadway, Vista, CA 92084
September 2018
Dog Haus brings their world-famous gourmet hot dogs and sandwiches to Dog Haus Biergarten Vista, their third San Diego location.
Claremont
Dog Haus Biergarten Claremont
Address: Sycamore Hills Plaza, 2209 E Baseline RD, Ste 700, Claremont, CA 91711
September 2018
Dog Haus will continue to expand their premier hot dog, sausage and sandwich joint in their home state of California this fall with Dog Haus Biergarten Claremont.
Cleveland
Ohio City Galley
Address: 1400 W. 25th Street Cleveland, OH 44113
October 2018
Galley Group's third food hall and restaurant accelerator will bring four new restaurant concepts as well as an innovative bar program to the growing Ohio City neighborhood.
Detroit
Fort Street Galley
Address: 160 W Fort Street, Detroit, MI 48226
November 2018
The food hall incubator model invites chefs to apply for the opportunity to launch a brand new concept in a kitchen space provided by Galley Group.
Singapore
Black Tap Singapore
Address:Marina Bay Sands, 01-80, 2 Bayfront Avenue, Singapore, 018972
September 2018
Black Tap Craft Burgers & Beer will soon offer its award-winning burgers and world-renowned milkshakes at the iconic Marina Bay Sands.
Six Senses Maxwell
October 2018
The property's colonial-style buildings have been carefully conserved and transformed into 138 guestrooms and suites, a Six Senses Spa, outdoor lap pool and Champagne bar.
The Capitol Kempinski Hotel Singapore
October 2018 – Singapore
This hotel is an Art Deco jewel, housed in the heritage Capitol Building, which features 157 guest rooms and a restaurant under the helm of a Michelin-starred chef.
Capella Hotels and Resorts
Capella Sanya
Late 2018 – Hainan Island, China
Located along the coastline of Blessed Bay on Hainan Island, Capella Sanya will be a new luxury landmark offering 190 elegantly appointed rooms, suites and villas.
Capella Bangkok
Late 2018 – Thailand
Ultra-luxury hotel situated on the banks of the Chao Phraya River, comprised of 100 guest rooms and a series of river view villas.
Hoshino Resorts
Hoshino Resorts' KAI Ito
Late 2018 –Japan
After major renovations, the ryokan's sizeable public hot spring, footbath area, lobby, and guest rooms will be refurbished.
Mandarin Oriental Hotel Group
Mandarin Oriental Wangfujing, Beijing
Late 2018 –China
Mandarin Oriental Wangfujing is the brand's first Beijing location, featuring 74 luxurious guestrooms and suites with excellent views of the Forbidden City.
Mandarin Oriental, Doha
Late 2018 –Qatar
An intimate and stylish urban retreat located in the heart of Msheireb Downtown Doha, this hotel blends chic, contemporary design with touches of Qatari heritage.
The Islands of Tahiti
Coqui Coqui Bora Bora
Late 2018 – Bora Bora
The very first Coqui Coqui Residences & Spa concept outside of Mexico, Coqui Coqui Bora Bora is helmed by Nicolas Malleville of the Yucatan-born Perfumeria.
Fresh Food Container Demand
Fresh food container demand in the US is projected to increase 3.7 percent per year to $1.1 billion in 2022. The trends toward snacking and healthy eating will drive gains, as pre-made meals and snacks in food retail outlets allow consumers to eat fresh food quickly and easily. This and other trends are presented in Food Containers in the US, 11th Edition, a new study from The Freedonia Group, a Cleveland-based industry research firm. More information about this study is here.
Dairy product containers will account for largest share of sales growth through 2022. The continued popularity of single-serving dairy containers and increasing popularity of specific yogurt segments will support gains. Plastic bottles will see especially strong growth due to the increasing consumption of various non-dairy creamers, as consumers look to create coffee shop flavors at home.
The perishable prepared foods market will see the fastest fresh food container gains through 2022. Consumers' desire for convenience will boost demand, as rigid tubs, clamshells, and bowls are ideal containers for cut and peeled fruit, prepared sandwiches, and pre-mixed salads.
Gen Z and Brands
For decades, the most important right of passage for American teenagers was the purchase of a first car to drive to the mall to hang out with friends. A new analysis of teenage conversation patterns by Engagement Labs shows that teens today—popularly known as Generation Z—present an entirely new challenge to marketers. Enabled by mobile devices, ride sharing, and a penchant for walkable restaurants and retail, teenagers are shunning destination retail and the auto industry for FaceTime, 7-Eleven, and Starbucks.
Marketers have an inherent fascination with the next big thing, and the next big thing is Generation Z. Generation Z, the next consumer powerhouse is expected to account for 40 percent of all consumers by 2020. In a recent landmark study, Engagement Labs proved that conversations about brands, on average, drive 19 percent of U.S. consumer purchases, representing between $7 and $10 trillion in annual sales. For that reason, Engagement Labs' analysis includes not only social media, but also what Generation Z is talking about face-to-face, in the real world.
The study "Gen Z: The TotalSocial Generation," reveals that Gen Z is highly talkative about brands. They have 13.4 conversations about products and services on average each day, one-third more than the 9.9 conversations among people 21 and older. They also talk more about political and cultural topics such as the environment and health eating or nutrition. In a typical day they have 30 percent more conversations than adults about such issues.
"We call Generation Z a TotalSocial generation because they are socializing both online and offline. They have more consumer conversations than older consumers, but it's not just a digital phenomenon. They are talking more face-to-face about products and services as well," said Ed Keller, CEO, Engagement Labs. "We are also seeing major shifts from the teenagers of five years ago, indicating that Gen Z is a very different type of generation, with long-term implications for marketers."
The study identifies broad patterns from changes in the individual brands that teenagers talk about every day, indicating that restaurants and local retail are in, while cars, specialty and department stores are all out with this generation of teenagers.
Gen Z Most Talked About Brands
iPhone and Apple are the two most talked about brands of Generation Z, making a profound statement about the importance of technology, connectivity, and mobility for teenagers today. Other rising brands on the list include Nike, proving its relevance to yet another generation of youth, and the ever-present Walmart brand. Two of the great competitive brands of our eras—Coca Cola and Pepsi—are down 21 percent and 49 percent, respectively, suggesting Generation Z is moving away from sugary beverage brands that have dominated their category for several generations.
|
The Gen Z Top 8 Brands |
|||
|
1 |
iPhone |
18.0 percent |
(+82 percent) |
|
2 |
Apple |
15.0 percent |
(-40 percent) |
|
3 |
Coke |
14.6 percent |
(-21 percent) |
|
4 |
Samsung |
12.1 percent |
(+1 percent) |
|
5 |
Nike |
11.2 percent |
(+34 percent) |
|
6 |
McDonald's |
11.0 percent |
(-2 percent) |
|
7 |
Walmart |
9.5 percent |
(+20 percent) |
|
8 |
Pepsi |
6.3 percent |
(-49 percent) |
|
Chart: Percent of teens talking about brand on an average day, with change |
|||
"Gen Z is highly social, online and offline, with greater conversational engagement than adults in most consumer categories," added Keller. "As important as the trends may be, there are plenty of brands that are succeeding despite them. No matter which category you're in, the key to connecting with Generation Z is to listen—and learn."
Destination Retail Gives Way to Convenience Among Teens
The biggest declines among teens since 2013 are for Nordstrom, JCPenney, Kohl's, Macy's, Kmart, Sears, and TJ Maxx. Some bright spot for teenagers are "neighborhood" convenience and drugstores. 7-Eleven is up by more than 300 percent among Generation Z in terms of the frequency of conversation, while Aldi's, Walgreens, and CVS are also posing double and triple digit gains. Taken together with the increase in Walmart conversations, the reports' authors attribute the shift to a preference for "around the corner" retail in place of destination retail.
A Cultural Shift Away from Cars
Generation Z is turning away from the American love affair with cars, in a trend which may be related, as well, to the declining allure of destination retail. In a world with ride sharing via Uber and Lyft, electric bicycles, and public transit, conversation levels for automobiles have plummeted among teenagers for nearly every mass market brand and many smaller nameplates as well. Teenagers today have many ways to get to the places they want to be, without needing to own a car upon their 16th birthday.
Most Restaurant Brands Gain from TotalSocial Gen Z
Today, compared to 2013, nearly every restaurant is being talked about more often by Gen Z. Conversation levels among teens have literally tripled—or more—for several restaurant chains: Baskin & Robbins, Del Taco, Domino's, and California Pizza Kitchen. Despite the rising tide for restaurants among Generation Z overall, several quick services restaurants in like McDonald's are seeing modest declines, including Burger King, Subway, Taco Bell, and Wendy's. The report authors see evidence that casual chains that enable "hanging out" with friends are becoming more popular than the in-and-out convenience of "quick service" restaurants. Gen Z is taking the "fast" out of "food."
Teen Talk Favors Mobility and Connectivity to Hardware
Among Generation Z, the ascendant brands in tech are the one that travel well in denim pockets—brands like iPhone, iTunes, Facebook, Amazon, and Google. These brands are much more talked about by teens versus five years ago, while less portable hardware brands like Toshiba, Sony, HP, and Lenovo are being talked about far less often by teens.
Traditional Youth Brands No Longer at the "Cool Table"
A surprising number of youth-oriented brands are being left out of the conversation among Generation Z. The biggest declines are for retail & apparel brands Aeropostale, Hollister, and Abercrombie & Fitch, a large shift away from shopping mall retailers. Many of the declining brands are athletic shoes—Reebok, Converse, Vans, Puma—might lead one to think there is a category effect going on, except for the fact that Nike is rising, and is now one of the most talked about brands among Gen Z.
Brands of Our Grandparents Are Back!
Brands as diverse as Ace Hardware, Scott Tissue, Breyers Ice Cream, and Post cereals are seeing new life with today's teens who are talking much more about their brands than five years ago – some of these brands have commitments to environmental sustainability, a topic that Gen Z talks about much more than their elders.
The full white paper, "Gen Z: The TotalSocial Generation" is available for download at http://bit.ly/2ohzipi
Most Scenic Restaurants
Diners looking to broaden their travels and enjoy astonishing scenery as they feast – from wooded overlooks to twinkling skylines and everything in between – need look no further than OpenTable, which released its 100 Most Scenic Restaurants in America list. Featuring breathtaking views from coast to coast, the restaurants featured on the list offer the perfect backdrop for any occasion.
Whether you’re looking for oceanside views at Geoffrey's Restaurant in Malibu, California, or breathtaking skyline sunsets at River Cafe in Brooklyn, New York,this year’s Most Scenic Restaurant winners have got you covered – spanning 25 states and offering a variety of stellar views. California remains on top this year with 28 restaurants among the honorees, followed by Florida with 13 winners and New York with seven. Spanning east to west from Rhode Island to Oregon and north to south from Wisconsin to Texas, 24 additional states are among those represented.
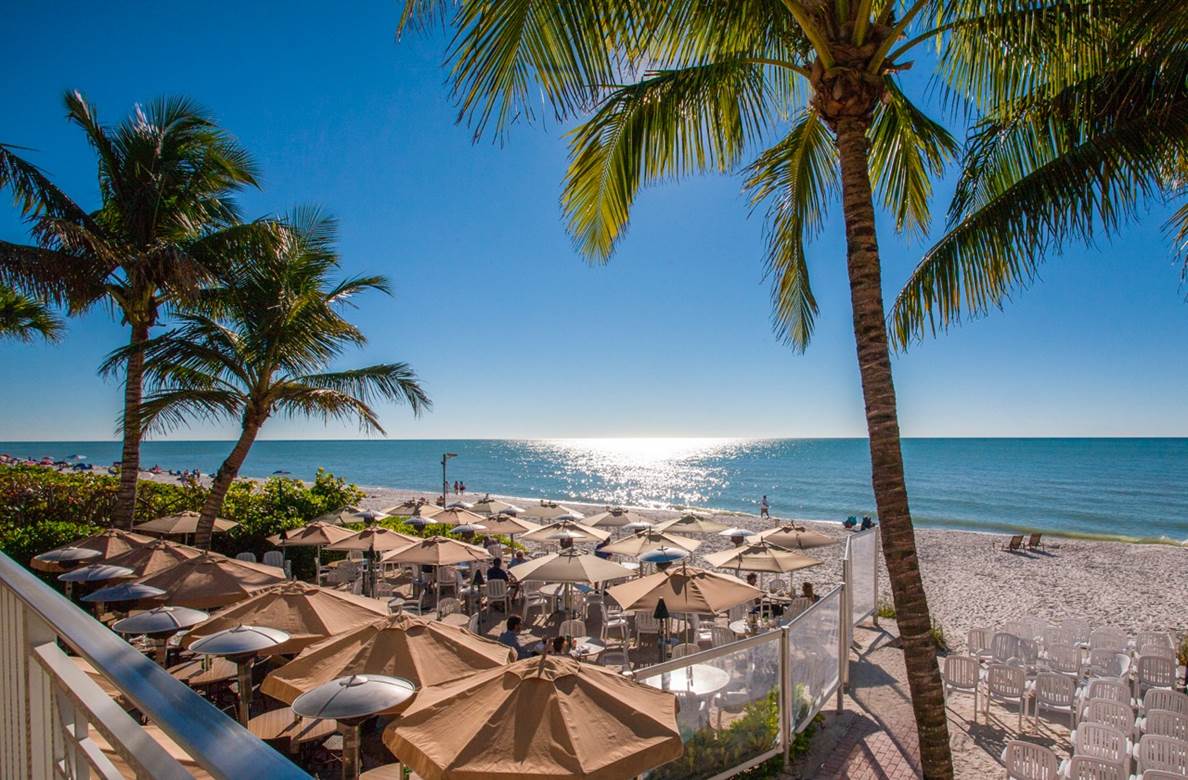
Turtle Club
Those looking to enjoy American classics can choose from over 35 restaurants on the list, and those craving surf or turf can treat themselves to more than two dozen options, each, across several states. The complete list represents a diverse mix of menus for all palates, including Asian, French, Italian, Latin, Mediterranean and more.
“We know a memorable meal is as much about the ambiance as it is about the food,” said Caroline Potter, OpenTable's Chief Dining Officer. "This year’s list represents an immense variety of restaurants that not only offer an exceptional meal but also feature breathtaking views that enhance the experience for locals and travelers alike.”
The 100 Most Scenic Restaurants list for 2018 list is generated solely from more than 12 million verified OpenTable diner reviews for more than 28,000 restaurants in all 50 states and Washington, D.C. collected between June 1, 2017 and May 31, 2018. All restaurants with a minimum "overall" score and number of qualifying reviews were included for consideration. Qualifying restaurants were then scored and sorted according to the percentage of qualifying reviews for which "scenic views" was selected as a special feature.

Waterbar
Based on this methodology, the following restaurants, listed in alphabetical order, comprise the 100 Most Scenic Restaurants in America according to OpenTable diners. The complete list may also be viewed at https://www.opentable.com/lists/most-scenic-restaurants-2018.
100 Most Scenic Restaurants in America, according to OpenTable:
Altius – Pittsburgh, Pennsylvania
Bartolotta's Lake Park Bistro – Milwaukee, Wisconsin
The Bay House – Naples, Florida
Beachcomber Cafe – Crystal Cove – Newport Coast, California
Bertrand at Mister A's – San Diego, California
The Bistro at Gervasi Vineyard – Canton, Ohio
Black Bass Hotel – Lumberville, Pennsylvania
Blue Moon Fish Co. – Fort Lauderdale, Florida
Blue Ridge – Asheville, North Carolina
The Boathouse – Lake Buena Vista, Florida
The Boathouse at Rocketts Landing – Richmond, Virginia
Boat House Waterfront Dining – Tiverton, Rhode Island
Boatyard – Fort Lauderdale, Florida
Carrol's Creek Cafe – Annapolis, Maryland
Catch LA – West Hollywood, California
Chart House Restaurant – Lake Tahoe, Nevada
Chart House Restaurant – Weehawken, New Jersey
Chicago Cut Steakhouse – Chicago, Illinois
Clinkerdagger – Spokane, Washington
Columbia Restaurant – SandKey – Clearwater, Florida
Dauphin's – Mobile, Alabama
Different Pointe of View – Phoenix, Arizona
Duke's – San Diego, California
Duke's – Malibu, California
Eiffel Tower – Las Vegas, Nevada
El Five – Denver, Colorado
Elements at Sanctuary Camelback Mountain Resort – Paradise Valley, Arizona
EPIC Steak – San Francisco, California
Farmhouse at Rogers Gardens – Corona Del Mar, California
Five Sixty by Wolfgang Puck – Dallas, Texas
Fleet Landing Restaurant & Bar – Charleston, South Carolina
Four Winds Steakhouse – Wills Point, Texas
Gaonnuri – New York, New York
Geoffrey's Restaurant – Malibu, California
George's Ocean Terrace – San Diego, California
The Grand Marlin of Pensacola Beach – Pensacola, Florida
Greens Restaurant – San Francisco, California
Harbor House – Milwaukee, Wisconsin
Honu Seafood and Pizza – Lahaina, Hawaii
Il Fornaio – Coronado, California
Iridescence – Detroit, Michigan
Island Prime – San Diego, California
Jake's Del Mar – Del Mar, California
Joe Muer Seafood – Detroit, Michigan
Kaluz Restaurant – Fort Lauderdale, Florida
The Lakehouse – Bay Shore, New York
La Mar by Gaston Acurio – Miami, Florida
Latitudes on Sunset Key – Key West, Florida
Legal Harborside – Floor 1 Restaurant and Market – Boston, Massachusetts
The Lobster – Santa Monica, California
Lobster Shop South – Tacoma, Washington
Lone Eagle Grille – Incline Village, Nevada
Mama's Fish House – Paia, Hawaii
The Marine Room – San Diego, California
Mariposa – Sedona, Arizona
Mastro's Ocean Club – Newport Beach, California
Mastro's Ocean Club – Malibu, California
The Mill House – Waikapu, Hawaii
Mon Ami Gabi – Las Vegas – Main Dining Room – Las Vegas, Nevada
Monterey Bay Fish Grotto – Mt. Washington – Pittsburgh, Pennsylvania
The Mooring Restaurant – Newport, Rhode Island
The Ocean House Restaurant – Cape Cod – Dennis Port, Massachusetts
Ophelia's on the Bay – Sarasota, Florida
Orchids at Halekulani – Honolulu, Hawaii
Oyster Loft – Pismo Beach, California
Pacific Coast Grill – Cardiff – Cardiff–By–The–Sea, California
Parc – Philadelphia, Pennsylvania
Perch LA – Los Angeles, California
Peter Shields Inn – Cape May, New Jersey
Pier W – Cleveland, Ohio
The Pink Door – Seattle, Washington
Portland City Grill – Portland, Oregon
Primavista – Cincinnati, Ohio
Prime – Huntington, New York
Poseidon – Del Mar, California
Rats Restaurant at Grounds for Sculpture – Hamilton, New Jersey
Ray’s Boathouse – Seattle, Washington
River Cafe – Brooklyn, New York
RiverPark – New York, New York
Robert – New York, New York
The Rotunda at Neiman Marcus – San Francisco, California
Simon Pearce Restaurant – Quechee, Vermont
Spinners Rooftop Revolving Bistro & Lounge @ Grand Plaza Hotel – St. Pete Beach, Florida
Splashes at Surf and Sand Resort – Laguna Beach, California
The Strand House – Manhattan Beach, California
Summit House – Fullerton – Fullerton, California
Sunset Terrace – Omni Grove Park Inn – Asheville, North Carolina
Tidepools – Poipu, Hawaii
Tom Hams Lighthouse – San Diego, California
Top of the Hub – Boston, Massachusetts
Top of the World Restaurant – Stratosphere Hotel – Las Vegas, Nevada
Trattoria Lisina – Driftwood, Texas
The Turtle Club – Naples – Naples, Florida
The Twisted Olive – Green, Ohio
Ulele – Tampa, Florida
Vast – Oklahoma City, Oklahoma
Ventana Grill – St. Pismo, California
Vivace Restaurant – Tucson, Arizona
Waterbar – San Francisco, California
X2O Xaviars on the Hudson – Yonkers, New York
Football Food Trends
Are you ready for some football? Aramark, the food service provider that partners with more NFL teams, and serves more football fans than any other hospitality company, is.
To prepare for the upcoming season, where they will serve more than six million football fans, Aramark’s culinary and innovation teams explored local food trends and dove into fan feedback and consumer insights, to create unique menu items reflecting each city’s local flavors and signature tastes.
“We’re committed to enhancing fans’ game day by creating a dining experience that offers great tasting, high quality, convenient and personalized menu options, that also includes healthy options, for those that want them,” said Carl Mittleman, President of Aramark’s Sports and Entertainment division. “We challenge our culinary team to create an innovative menu and this year’s lineup features some unique items that are sure to get fans excited.”
Taco Trios
The only thing better than one taco is three! This season, Aramark will serve signature taco trios, influenced by the hometown team, city or its fans.
- Battle Red Tacos (NRG Stadium) – Flamin’ Hot Cheetos-crusted chicken tenders, mango pico de gallo, Sriracha mayonnaise, flour tortilla.
- Bay Spice Brisket Tacos (Raymond James Stadium) – Spice-crusted brisket, queso fresco, radish, cilantro crema, jalapeno slaw, flour tortilla.
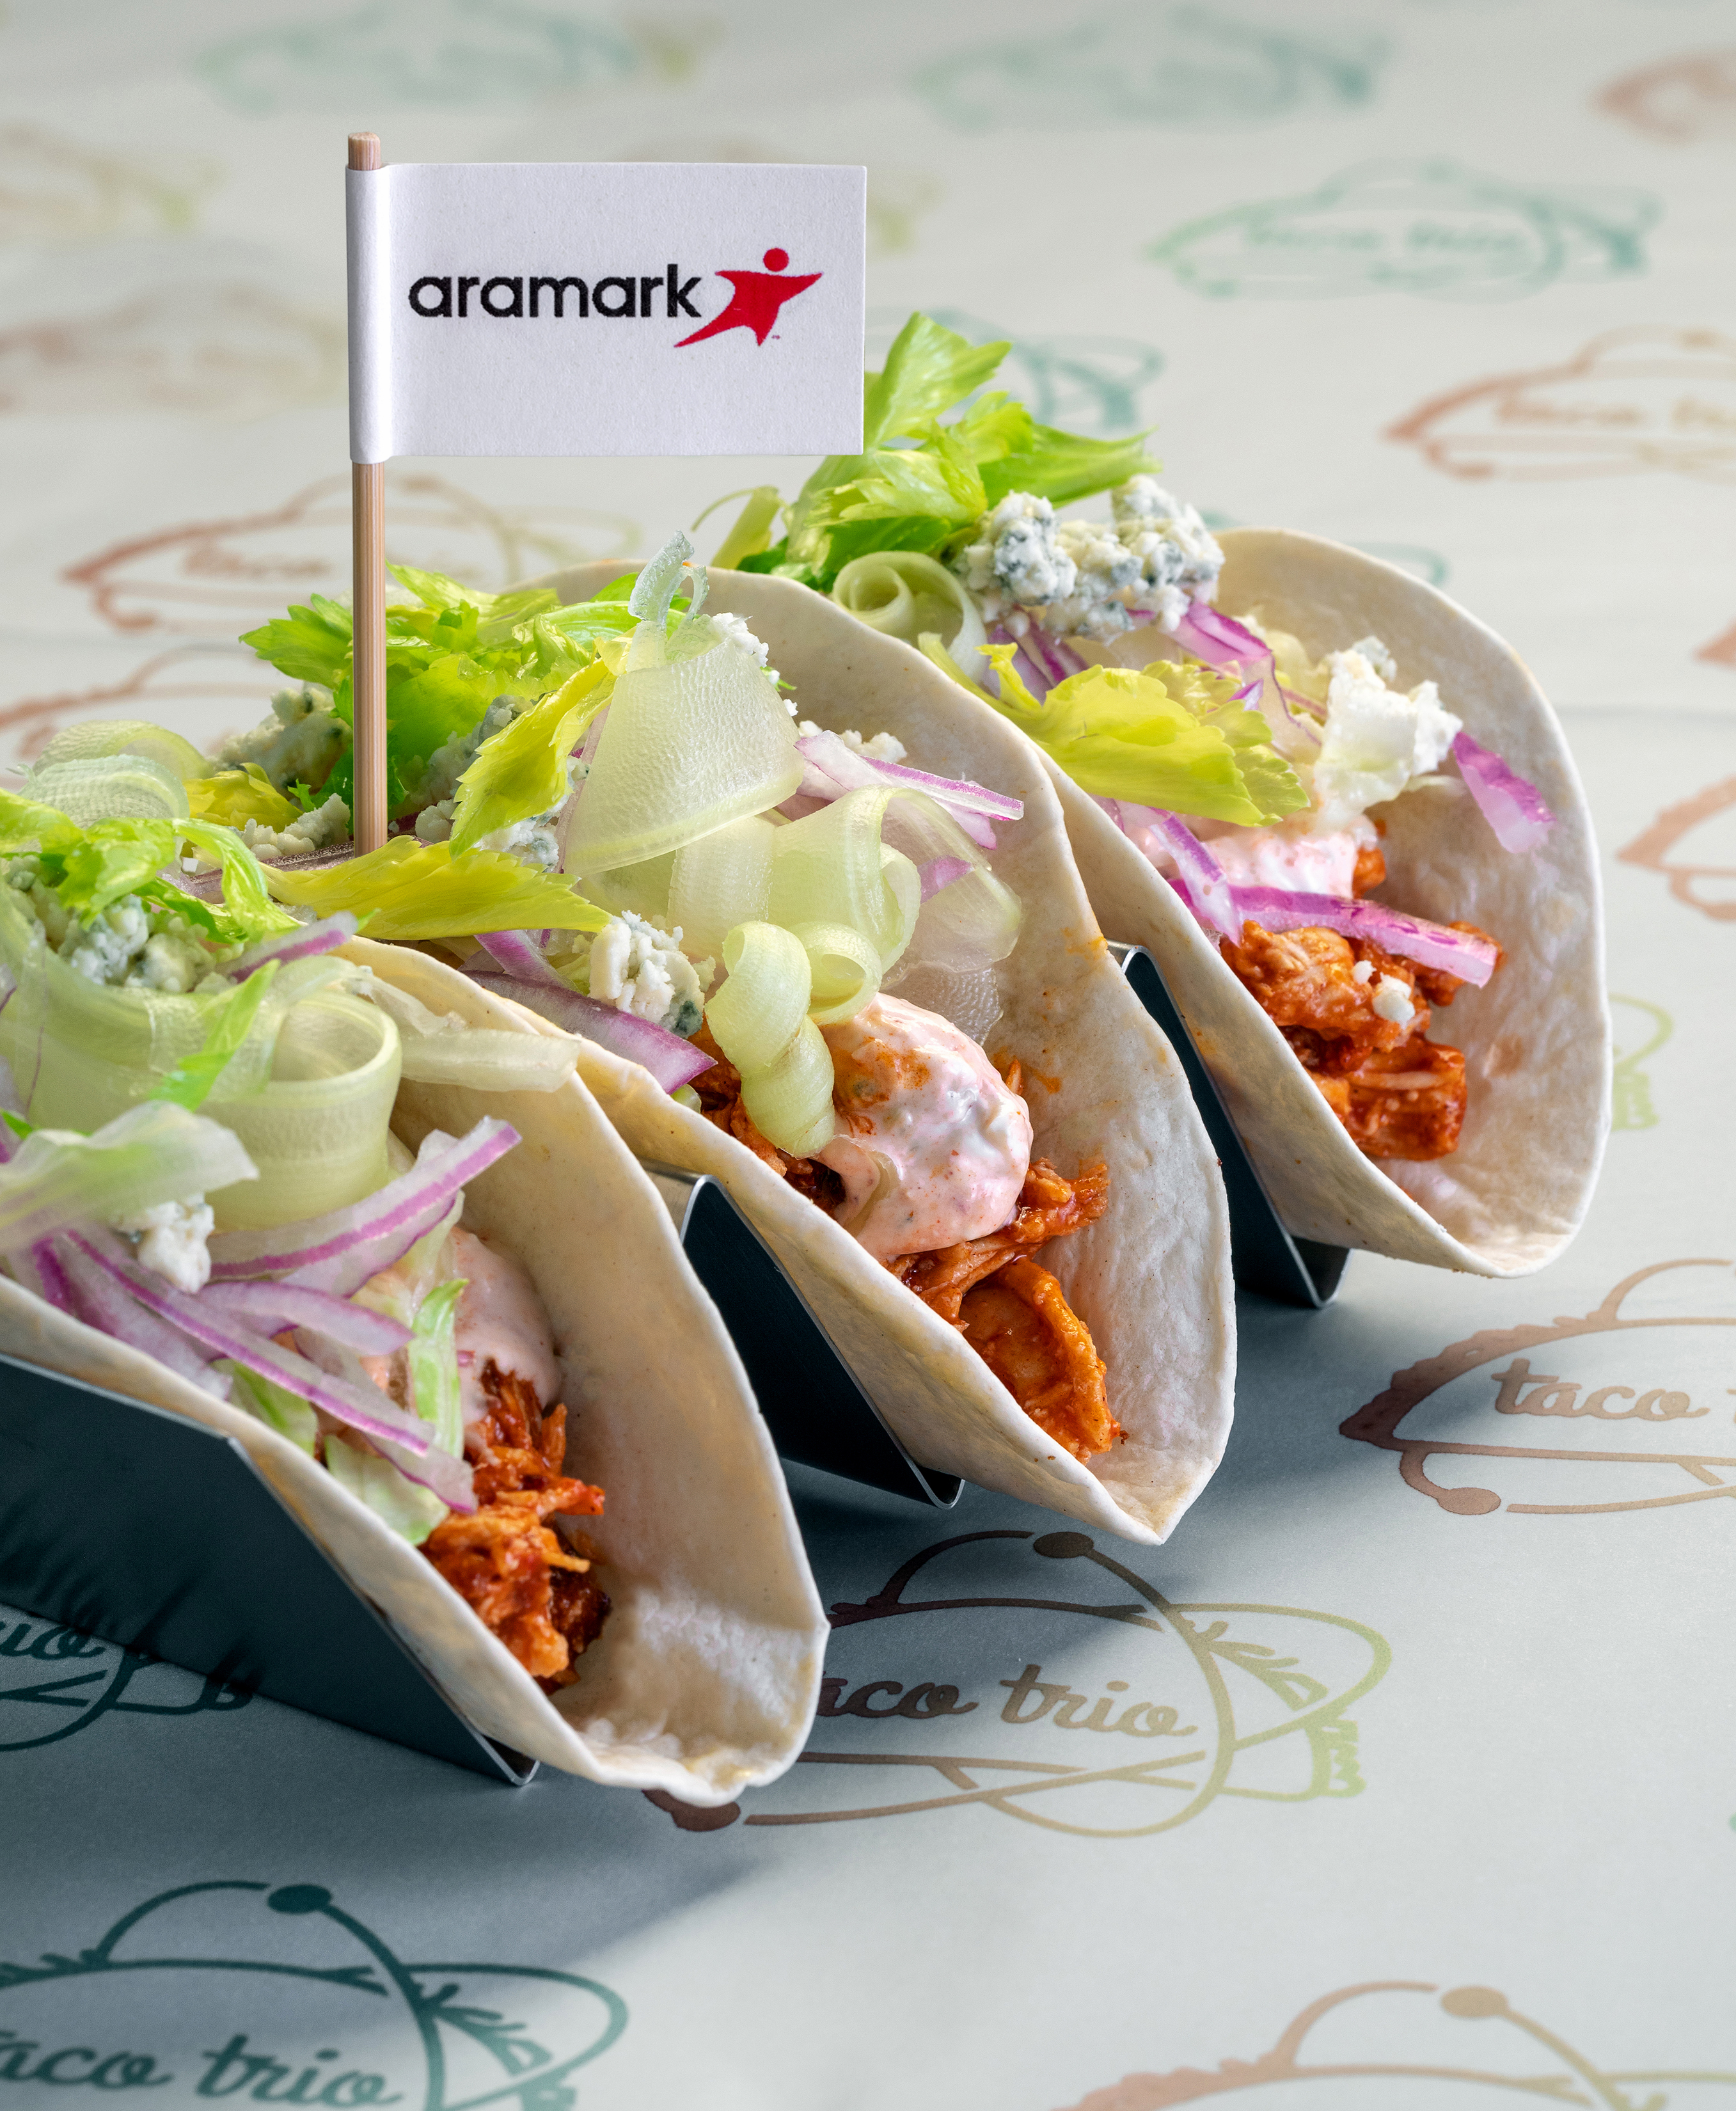
Buffalo Chicken Tacos
- Buffalo Chicken Tacos (Heinz Field) – Buffalo chicken, spicy blue cheese sauce, shredded lettuce, shaved celery, red onion, flour tortilla.
- Chesapeake Tacos (M&T Bank Stadium) – Old Bay pulled chicken, Maryland crab dip, corn salsa, cheddar jack cheese, purple corn tortilla.
- Chipotle Chicken Tacos (U.S. Bank Stadium) – Chipotle chicken, coleslaw, lime sauce, flour tortilla.
- Elote Chicken Tacos (Arrowhead Stadium) – Hatch chile-braised chicken, roasted corn pico de gallo, Cotija cheese, corn cake.
- Mojo Pork Tacos (Lincoln Financial Field) – Mojo-style chopped pork, queso blanco cheese sauce, pickled diced red onions, cilantro, long hot pepper hot sauce, fried flour tortillas.
- Pork Belly Tacos (Soldier Field) – Bulgogi (Korean-style grilled meat) marinated braised pork belly, daikon and carrot Asian-style slaw, grilled scallions, Sriracha pepper sauce, flour tortilla.
- Roasted Pork Tacos (Paul Brown Stadium) – Roasted pork, salsa verde, roasted street corn, BBQ chips, flour tortilla.
- Smokehouse Chicken Tacos (FirstEnergy Stadium) – Hickory-smoked coriander chicken, chili-spiked pepper jack queso, Ohio sweet corn pico de gallo, habanero cilantro crema, flour tortilla.
Sandwiches
- Cubano (U.S. Bank Stadium) – House cured and roasted pork Cubano with shaved ham, Swiss, house garlic, pickles, mustard, local Cuban roll.
- Kielbasa Cheesesteak (M&T Bank Stadium) – Sliced Dietz and Watson kielbasa, mixed with peppers, onions and sauerkraut, American cheese, hoagie roll.
- Kingdom Inferno Chicken Sandwich (Arrowhead Stadium) – Hand-breaded chicken tenders, Carolina reaper pepper mayo, pepper jack cheese, sliced jalapenos, Buffalo sauce, brioche bun.
- Market Bar-B-Que Smoked Brisket (U.S. Bank Stadium) – House smoked brisket, classic sauce, caramelized onions, coleslaw, garlic butter toasted bun, with kettle chips on the side.
- Pimento Cheese Melt (Raymond James Stadium) – Pimento cheese and thick Applewood bacon, Texas toast.
- Texas Smoked Meatball Sub (NRG Stadium) – Hickory smoked meatballs on a sub roll.
Hot Dogs and More
- Beef Rib (NRG Stadium) – House-smoked large beef rib.
- Chicago Hot Chicken Fries (Soldier Field) – Seasoned popcorn chicken, beer cheese, signature hot sauce, crumbled blue cheese, carrot-celery slaw, cool ranch drizzle.
- Franco Harris Pizzeria “Pro Bowler” (Heinz Field) – Artisan dough, whole milk mozzarella, San Marzano tomato sauce, Parma pepperoni, fresh basil, extra virgin olive oil.
- Jamaican Jerk Sausage (Arrowhead Stadium) – Jerk pork sausage, habanero mango slaw, crispy plantains, toasted New England bun.
- North Shore Huluski (Heinz Field) – Potato cheese pierogis, kielbasa, braised cabbage.
- Tennessee Hot Chicken Mac & Cheese (Arrowhead Stadium) – Classic mac & cheese, Tennessee hot popcorn chicken, hot sauce simmered onions.
- Teriyaki Beef Tater Tots (Paul Brown Stadium) – Tater tots, teriyaki marinated skirt steak, Asian slaw, Sriracha BBQ sauce.
- Traditional Sonoran Hot Dog (Paul Brown Stadium) – Bacon wrapped all-beef black angus foot long hot dog, pinto beans, white onions, tomatoes, fresh jalapenos, mustard, mayonnaise, salsa verde, queso fresco, traditional Bollilo roll.
Vegan and Vegetarian Options
As part of Aramark’s Healthy for Life 20 By 20 initiative, and ongoing commitment to providing fans with greater variety, choice and access to healthier menu options, Aramark continues to expand vegan and vegetarian options in the stadiums it serves.
- Beyond Burger (Arrowhead Stadium) – Vegan burger, arugula, tomato, red onion, toasted bun.
- Grilled Veggies and Hummus Flat Bread (Paul Brown Stadium) – Fresh, grilled seasonal veggies, hummus spread, cauliflower crust.
- Sweet Potato and Black Bean Tacos (U.S. Bank Stadium)
- Vegan Sausage (Arrowhead Stadium) – Cauliflower/walnut/wild rice sausage in vegan casing, maple walnut tapenade, cran-apple slaw, toasted New England bun.
Aramark partners with premier restaurateurs and top local and celebrity chefs, including several James Beard Award winning chefs, who will be introducing new offerings at stadiums this season. Among Aramark’s culinary partners at NFL stadiums are Andrew Zimmern, Chris Shepherd, David Chang, David Morton, Gavin Kaysen, Jimmy Bannos Jr., Jonathon Sawyer, Michael Symon, Rocco Whalen, Ronnie Killen and other celebrity chefs from across the country.
- B-Spot Red Zone Bratwurst (Michael Symon, FirstEnergy Stadium) – Beer bratwurst, caraway Cleveland kraut, spicy mustard and Tony Paco’s pickles.
- Fuku Spicy Fried Chicken Sandwich (David Chang, Lincoln Financial Field) – Habanero brined thigh served on a Martin’s potato roll and garnished with pickles and butter.
- Fuku Fingers and Fries (David Chang, Lincoln Financial Field) – Crispy chicken breast paired with sweet jalapeño-seasoned fries; choice of house made honey mustard or ranch.
- Georgia James Carved Roast Beef Sandwich with Wedge Slaw (Chris Shepherd, NRG Stadium) – 44 Farms beef, horseradish cream, pickled red onions, blue cheese, bacon, onion, tomatoes.
Game Day Innovation
Aramark is on the forefront of stadium innovation, with the launch of the following concepts, which are all the first of their kind in an NFL stadium.
- Tour de Taps – Aramark’s new fleet of Beer Cycles — three-wheeled, mobile and interactive beer bikes — will offer an additional location for fans to purchase beer. The carts will serve two varieties of draft beer, are designed with the local team’s colors and will be stationed in general concessions areas in each NFL stadium Aramark serves.
- Compostable Peanut Bag – Aramark is committed to stopping waste before it is created and debuted the first-ever pre-packed compostable peanut bag at a professional sports venue last season. The compostable peanut bag was recognized and awarded Green Sport Alliance’s Innovator of the Year award, and will be available at Arrowhead Stadium and U.S Bank Stadium this football season.
Aramark partners with 14 National Football League teams to provide food and beverage, retail and/or facilities services – Baltimore Ravens, Chicago Bears, Cincinnati Bengals, Cleveland Browns, Denver Broncos, Houston Texans, Kansas City Chiefs, Minnesota Vikings, New York Giants, New York Jets, Philadelphia Eagles, Pittsburgh Steelers, Seattle Seahawks and Tampa Bay Buccaneers.
Dough Demand
US demand for dough, dry pasta, and tortillas is forecast to increase 3.2 percent per annum through 2022, according to Dough, Dry Pasta, & Tortillas: United States, a report recently released by Freedonia Focus Reports. Suppliers will benefit from population growth, including in the Hispanic cohort, and rising per-capita consumption; consumers' ability to purchase higher-value products as disposable personal incomes expand; and ongoing demand for prepared foods from foodservice establishments as consumers continue to place value on the convenience and entertainment of dining out.
More information about the report is available here.
Furthermore, a preference by some consumers for higher-value niche products, such as gluten-free pasta, will boost gains in dollar terms. Other niche trends include marketing products that feature high-protein, heritage or ancient grain, and pulse flour. Competition from other foods and increasing consumer health concerns and the related popularity of diets designed to reduce carbohydrate intake will prevent stronger gains.
Sous Vide Market
According to the latest market research report released by Technavio, the global commercial sous vide machine market is expected to accelerate at a CAGR close to 6 percent during the forecast period. The growing adoption of sous vide cooking in foodservice establishments is one of the key factors triggering the growth of the market.
This research report titled ‘Global Commercial Sous Vide Machine Market 2018-2022’ provides an in-depth analysis of the market in terms of revenue and emerging market trends. It also includes an up-to-date analysis and forecasts for various market segments and all geographical regions.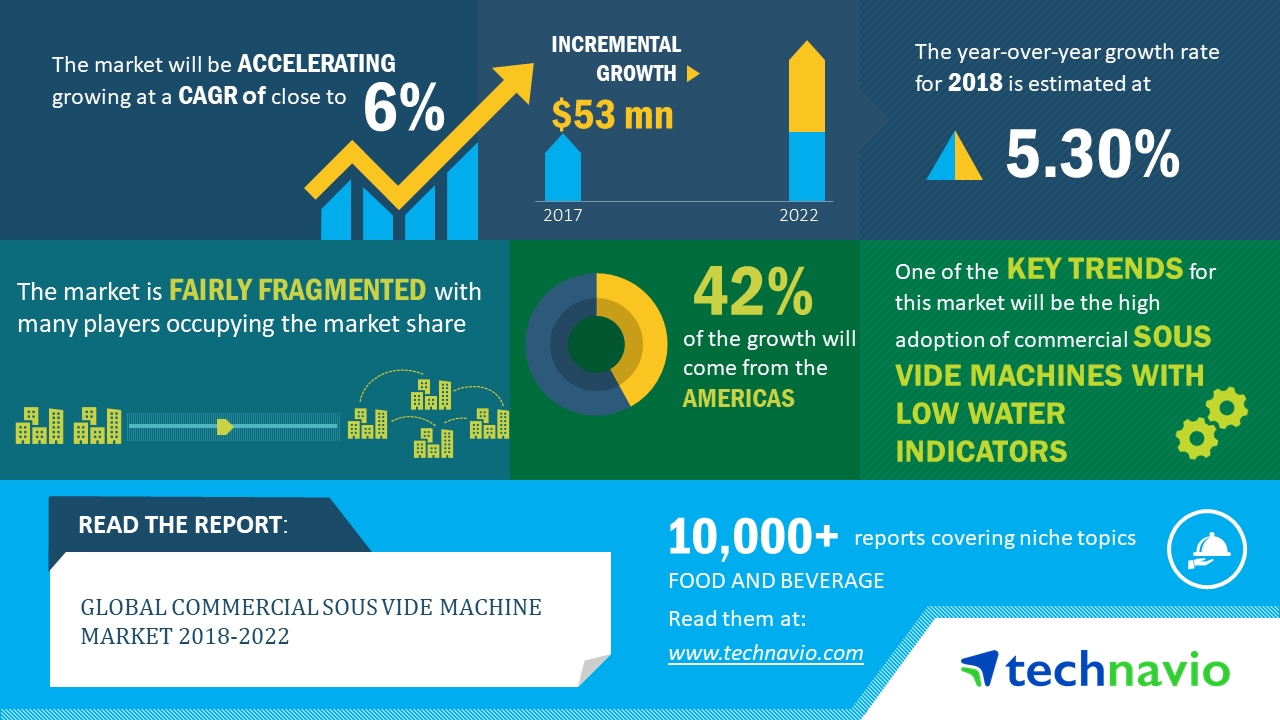
The market research analysis categorizes the global commercial sous vide machine market into the following products:
In 2017, the commercial water bath type sous vide machines segment accounted for 74 percent of the global market and is projected to reach 75 percent by 2022, exhibiting a 1 percent increase in market share.
Global commercial sous vide machine market: Top emerging trend
The high adoption of commercial sous vide machines with low water indicators is an emerging trend in the food service space. Commercial sous vide machines use water baths to provide the precise temperature control while cooking various types of food products. Vacuum bags that contain food products are immersed in a bath of warm temperature-controlled water. Operators need to maintain the water level in sous vide containers between the minimum and maximum fill lines noted on these containers. Commercial sous vide machines offered by various manufacturers feature low-level water indicators. Some of the commercial sous vide machines can automatically turn off if the water level falls below the minimum required level. Thus, with such advantages, the market is expected to have a positive outlook during the forecast period.
Egg Replacement Market
The outbreak of several epidemics from birds is having a profound influence on global consumption of eggs. This has led to an intense egg supply crisis causing various constraints apropos of egg supplies. Also, the global food industry has witnessed a paradigm shift over the past few years, with increasing number of consumers preferring vegan diet over a non-vegetarian diet. This, in turn, is poised to bode well for egg replacement ingredients market. The egg replacement ingredients market is envisaged to be driven by several factors such as rising number of vegans, outbreak of fatal diseases associated with birds, and rising preferences for vegetarian diet in the wake of health concerns worldwide. According to the report, the egg replacement ingredients market was sized over US$ 980 Mn in 2018. The market is further projected to value around US$ 1, 630 Mn by 2028 end.
With rampant shortage in egg supply, consumers are on the lookout for egg alternatives, which are supposed to serve as a source of their daily nutritional requisites. Furthermore, use of dairy based, soy based, and starch based products have witnessed a drastic upturn over the past few years. These conditions are poised to accentuate the demand for egg replacement ingredients, thereby reviving the market growth. One Green Planet, in one of its prominent publications, stated that over 6 percent of the US population is vegetarian in the light of adverse impacts of having a non-vegetarian diet on one's health in the long run. Over and above that, multiple NGOs across the globe are promoting benefits of vegan diet over a non-vegetarian diet, thereby paving grounds for prosperity for egg replacement ingredients market.
Manufacturers in the egg replacement ingredients market are encouraging advent of diverse varieties in a bid to cater to mushrooming needs of manufacturers raising requirements for low cost ingredients and demand of customers for healthy food products. In terms of innovation, companies are emphasizing on streamlining their production capacity for offering products which are cost-effective and having longer a shelf life with flawless texture. Confectionery and bakery products such as cakes/pastries/muffins/breads are one of the lucrative targets for the market players with regard to surging demand for egg supplements from these products. Manufacturers operating in the egg replacement ingredients market are all set to launch new products for this segment in the light of rising popularity of bakery as well confectionery products. Furthermore, mayonnaise stands out as a remunerative segment in the egg replacement ingredients market. Eggless mayonnaise is gaining significant traction amid the health concerned consumer demographics owing to low fat and cholesterol levels.
One of the differentiating strategies which might help the market players to have a competitive edge is to closely study and understand the consumer requirements and offering products in similar lines with specific features. Streamlining the value chain might evolve as the biggest catalyzer for price reduction of the final product. In case of bakery industry, the demand for plant-based ingredients is picking up the steam and can be considered as a striking opportunity by the market players of egg replacement ingredients.
Moreover, product innovations and developments have been considered as the key for manufacturers to attain a spike in sales. Prominent companies like TIC Gums and several other companies offering texture and stabilization solutions in the food industry are vying to offer several stabilizer systems to replace the necessary texture and emulsification properties of eggs. After receiving several requests to introduce stabilizers in place of eggs in their products, they have proactively formulated stabilizers for replacing eggs and enhancing their product portfolio.
The challenge of receiving optimal benefits out of egg alternatives is poised to limit the market growth to a certain extent. Since eggs cater to various functional roles in foods, it is difficult to obtain a one-to-one replacement for the multiple benefits they offer. This difficulty in restoring the nutritional benefits of eggs is poised to create minimal hindrances for manufacturers to attain sustainable consumer trust, thereby posing minute roadblocks for growth of egg replacement ingredients market.
Popcorn Flavor Innovations
While popcorn has traditionally benefited from a health halo, new research from Mintel reveals that Americans are now embracing flavor innovation, from indulgent to savory, driven by the increasingly popular ready-to-eat (RTE) popcorn category. Total US retail sales of popcorn increased 32 percent in the last five years to reach an estimated $2.5 billion in 2017, with RTE popcorn leading the flavor innovation wave, growing an impressive 118 percent between 2012-17 to reach $1.1 billion.
With the pre-popped convenience of RTE popcorn offering a perfect medium for a range of flavors and toppings, consumers today are interested in flavor innovation—both familiar and unexpected—in the popcorn category. While traditional varieties like cheese-flavored (49 percent) and indulgent (eg chocolate/caramel covered) (32 percent) are high on the list, popcorn buyers* are also interested in purchasing options that are mixed flavor (eg salty, indulgent and cheesy popcorn in one bag) (39 percent), have additions mixed in (eg dried cranberries or candy) (20 percent) and are seasonal flavored (eg pumpkin spice, gingerbread) (12 percent).
Overall, while Americans are interested in indulgent flavors and mix-ins when it comes to popcorn, natural options have their place in the grocery cart as nearly half (45 percent) of popcorn consumers are interested in buying all-natural varieties.
“Popcorn sales have been on the rise in recent years and now the category is shifting from traditional flavors toward more dynamic flavors and combinations, driven by the ready-to-eat (RTE) segment which has seen sales more than double since 2012. RTE popcorn brands are finding success not only through an expanding array of creative new flavors, but also by tapping into growing interest in healthy, natural and portable snacks and eating occasions. The popcorn segment, and RTE popcorn in particular, is likely to continue benefiting from a generally healthy image as well as its suitability as a medium for a wide range of flavors and toppings. As such, there is an opportunity for brands in other salty snack segments to innovate with unexpected flavors to engage consumers, especially among younger generations who, our research shows, are looking for variety in the salty snack aisle,” said John Owen, Senior Food and Drink Analyst at Mintel.
Meat snacks corner the salty snacks market
Meat snacks is the largest segment of the salty snacks category (30 percent market share), and also the fastest growing**, with sales increasing 45 percent in the last five years to reach $3.6 billion in 2017. While interest in premium products such as meat snacks made from prime cuts (58 percent) is high among meat snack consumers*** of all ages, younger consumers aged 18-34 are most likely to be interested in portable options such as meat snack bars (45 percent vs 38 percent overall).
“While the inherent benefits of protein and portability favor all meat snack brands, we’re seeing some of the smaller brands drawing a point of distinction by offering niche flavors and formats. Our research shows that young salty snack purchasers place extra value on the portability of meat snacks, as well as its versatility to be eaten beyond snacking occasions. There is an opportunity for brands to position meat snacks for breakfast, where protein and portability have become essential attributes,” continued Owen.
Are Americans in denial about salty snacking?
The popularity of snacking is undeniable, but salty snack consumers**** are more likely to say they’re eating less (19 percent) salty snacks today (compared to last year) than they are to say they’re eating more (16 percent). While they’re seen as an acceptable indulgence, with two in five (42 percent) agreeing that taste is more important than health when it comes to salty snacks, many are on the lookout for more healthful varieties as nearly half (48 percent) wish there were more healthy snack options.
While consumers may report eating less salty snacks, the variety of snacking occasions, such as munching while on-the-go (41 percent) and as an energy boost (22 percent), has helped the salty snacks category see continued growth over the last year, with overall category sales increasing 5 percent to reach an estimated $11.9 billion in 2017. Looking at the past five years, sales have grown 31 percent since 2012, making salty snacks one of the best performing major packaged food categories in recent years.
“The diverse salty snacks category benefits from the increasing prevalence of snacking and the blurring line between traditional meal times and snacking occasions. However, salty snack purchasers report eating less salty snacks, suggesting they aren’t as willing to admit to their changing behavior, likely due to lingering negative perceptions of the category. Our research shows that because salty snacks are still primarily seen as an indulgence, there are opportunities for brands to shift their messaging and new product development to better position salty snacks as a healthy snacking option, such as popcorn, or more nutrient-dense, such as meat snacks, to continue the category’s growth,” concluded Owen.
Brand Intimacy Report
The beverages industry ranked ninth out of 15 studied in MBLM’s Brand Intimacy 2018 Report, which is the largest study of brands based on emotions. The top three in the industry, which moved up one spot from the 2017 study, were Coca-Cola, Coors and Budweiser. The remaining brands in the Top 10 for the beverages industry were: Pepsi, Red Bull, 7UP, Tropicana, Miller, Snapple and Mountain Dew.
Brand Intimacy is defined as a new paradigm that leverages and strengthens the emotional bonds between a person and a brand. MBLM’s study again revealed that top intimate brands in the U.S. surpassed the top brands in the Fortune 500 and S&P indices in revenue and profit over the past 10 years.
“Brands in the beverages industry, which is innately personal, are missing out on opportunities to better connect with their customers,” stated Mario Natarelli, managing partner at MBLM. “Beverage brands are related to rituals, rites of passage and celebrations since they are often consumed over shared meals, major life events, at sports games or during recreational activities. The industry has a strong foundation to work from to create stronger, more resilient customer bonds.”
Other significant beverages findings in MBLM’s Brand Intimacy 2018 Report include:
- The beverage industry had an average Brand Intimacy Quotient of 24.7, which was below the industry average of 27.1
- Indulgence, which is related to moments of pampering and gratification, was the most prominent in the category, and Budweiser was the top-performing brand for indulgence
- Coca-Cola, the top brand in the category, also ranked #1 for both men and women, as well as for millennials
- Users aged 55–64 preferred Coors and Red Bull ranked #1 for having the highest percentage of customers in fusing, the most advanced stage of Brand Intimacy
- Coors and Budweiser had considerably improved their intimacy scores since last year, while Miller and Tropicana declined in this year’s rankings
To view the beverages industry findings, please click here. The full Brand Intimacy 2018 Report and the Ranking Tool can be found here.
This year’s report contains the most comprehensive rankings of brands based on emotion, analyzing the responses of 6,000 consumers and 54,000 brand evaluations across 15 industries in the U.S., Mexico and UAE. MBLM’s reports and interactive Brand Ranking Tool showcase the performance of almost 400 brands, revealing the characteristics and intensity of the consumer bonds.
Tortilla Popularity
The consumption of tortillas has increased rather significantly over the past decade. According to an analysis by Future Market Insights, the global Tortilla market is projected to be valued at US$ 12,324.4 Mn by 2028 end, expanding at a CAGR of 3.7 percent during the forecast period 2018-2028. Despite an extremely slow moving annual growth rate, increased tortilla consumption is predicted in the coming years-mostly supported by population growth, especially among Hispanics, as well as a continuation in the trend of consumer tortilla consumption preferences.
Tortillas have successfully positioned itself in the Latin American market. With a revenue share of +48 percent in 2017, Latin America clearly dominated the global tortilla market, in terms of value sales, substantially driven by the rapidly growing Hispanic population in the United States. In countries like Mexico, more than 94 percent of the tortillas are processed or produced using corn as its main source. Flour tortillas have a fairly high value share in the global tortillas market, compared to other variants such as tortilla chips, taco shells, tostadas, and corn tortillas. However, tortilla chips are expected to witness significant consumption in the coming years.
Research also suggests that, due to increasing demand for Mexican cuisine such as such as tortillas, nachos, enchiladas, tacos, and tamales, especially in North America and Latin America, tortillas, in the on-the-go snacks format, have been gaining traction. Busy lifestyles, deteriorating health conditions, and increasingly urban working population are some factors contributing to the consumption increase of tortillas, as per convenience. Moreover, an in-depth consumer sentiment analysis also indicates that more than 40 percent consumers buy tortilla products on a weekly basis and +50 percent consumers buy from modern trade stores like hypermarkets and supermarkets, owing to easy availability of the product at reasonable prices. Tortilla flour-based products, being one of the main Mexican foods, is gaining traction among its target customers throughout the foodservice industry.
Traditional Tortillas in New Convenient, Flavored Formats to Push Global Adoption
The global tortilla market has witnessed a surge a surge in the launch of new products containing innovative flavors over the last couple of years. Moreover, organic or gluten-free new products are being increasingly adopted in Americas, primarily attributable to the rising demand for the product, with added health benefits. The launch of these new flavored products is expected to have a positive impact on the market, thereby fueling the growth of global tortilla market during the forecast period. Moreover, significant growth in organized retailing in the form of hypermarket and specialty markets, which are more likely to make savory snacks popular among the consumers, will significantly drive the adoption of tortillas in the coming years.
Key Food Manufacturers Adding New Features to Tortillas to Expand Consumer Base
In new food formulations, key food manufacturers including Cargill and AB Mauri are leveraging the significant growth in the consumption of tortillas and have come up with new features added to tortillas. Cargill has developed a number of whole grain, low-fat tortilla prototypes in an effort to capture a slice of the growing U.S. market for healthy bread alternatives. With their new patent technology, AB Mauri has developed reduced-fat tortillas, paving way for manufacturers to attract growing base of health conscious consumers. The company's new patented technology enables manufacturers to develop reduced fat, reduced sodium, wheat-based tortillas. Already widely adopted in American market, AB Mauri has been strategizing on implementing the same patented technology in the European markets as well.
Moreover, FDA approvals for folic acid fortification of corn masa flour, allowing manufacturers to add up to 0.7 milligram of folic acid per pound of corn masa flour, has opened up new opportunities for manufactures to explore new food formulations. Key food manufacturer Bunge, offers corn masa flours and a wide variety of shortenings to help create products that meets all consumer demands.
However, lack of stringent regulations and less emphasis on clean labelling, particularly in terms of safety and efficacy of organic products, could impact consumer outlook, thereby, affecting the growth of tortilla market. Since, the production of tortillas is extremely low in other parts of the world, would also affect the value sales of tortillas.
Kid Friendly in Canada
Many road trips and family vacations take place during the last few weeks of summer when there's a gap between camps and summer programs and the start of the school year. Whether families are embarking on adventures or enjoying local downtime, OpenTable announced the 50 Best Restaurants for Kid-Friendly Dining in Canada for 2018 to help find quality dining in kid-friendly environments.
Restaurants from coast to coast round out the list, with Ontario having the most restaurants featured (22), followed by Alberta with 13 and British Columbia with 10. Quebec (4) and Manitoba (1) also have establishments in the top 50.
"Eating out with children exposes them to foods they may not otherwise get at home and helps families connect and socialize, but parents often don't know where to go," said Danielle Binns, Nutritionist and Family Restaurant Consultant. "It's easy to fall into a routine of meals at home and for parents and kids to be distracted. Going out as a family allows families to focus while teaching kids how to be more flexible around what they eat."
"We view restaurant dining as an opportunity for families to bond over delicious food in an engaging atmosphere," said Caroline Potter, Chief Dining Offer at OpenTable. "We are excited to connect people who enjoy going to restaurants that strive to accommodate all members of their party, regardless of age. These family dining options encourage togetherness and new food experiences."
Restaurants featured on the list include Toronto's Piano Piano, which offers a curated kids menu specially designed by Binns and Chef Victor Barry, and Vancouver'sGyu-Kaku, that offers Japanese family-style dining and sharing plates. These restaurants, among others on this year's list, offer variety and variations of foods that appeal to all members of the family.
Canada's 50 Best Restaurants for Kid-Friendly Dining is generated solely from more than 550,000 restaurant reviews collected from verified OpenTable diners between June 1, 2017 and May 31, 2018. All restaurants with a minimum "overall" score and number of qualifying reviews were included for consideration. Qualifying restaurants were then sorted according to a score calculated from each restaurant's average rating in the "kid friendly" category
Based on this methodology, the 50 Best Restaurants for Kid Friendly Dining in Canada for 2018 according to OpenTable diners are as follows (in alphabetical order):
21 Steps Kitchen + Bar – Whistler, BC
360 The Restaurant at the CN Tower – Toronto, ON
Ancaster Mill – Ancaster, ON
Benihana at Fairmont Royal York – Toronto, ON
Bolero – Calgary, AB
Borealis Grille & Bar – Kitchener, ON
Bow Valley Ranche Restaurant – Calgary, AB
Brasa Brazilian Steakhouse – Niagara Falls, ON
Cambridge Mill – Cambridge, ON
Canyon Creek – Toronto, ON (Multiple Locations)
Cibo – Calgary, AB (Multiple Locations)
Cluny – Toronto, ON
Copacabana Brazilian Steak House – Toronto, ON (Multiple Locations)
Damas – Montréal, QC
Dels Enoteca Pizzeria – Kitchener, ON
Drake Devonshire Inn – Wellington, ON
El Catrin – Toronto, ON
Firestone Restaurant and Bar – Lethbridge, AB
Golf's Steak House & Seafood – Kitchener, ON
Gyu-Kaku – Vancouver, BC (Multiple Locations)
Industria Pizzeria + Bar – Anjou, QC
Joe Fortes Seafood & Chop House – Vancouver, BC
The Keg Steakhouse + Bar – Calgary, AB (Multiple Locations)
Kobe Japanese Steak House – Vancouver, BC
Lake House Restaurant – Vineland, ON
The Melting Pot – Edmonton, AB
Miijidaa Cafe + Bistro – Guelph, ON
Miku Restaurant – Vancouver, BC
Modavie – Montréal, QC
Neverland Tea Salon – Vancouver, BC
Open Sesame – Calgary, AB
Osteria Savio Volpe – Vancouver, BC
Pampa Brazilian Steakhouse – Calgary, AB (Multiple Locations)
Piano Piano – Toronto, ON
Pineridge Hollow – RM of Springfield, MB
Planta – Toronto, ON
PZA Parlour – Calgary, AB
Ravine Vineyard Winery Restaurant – Niagara-on-the-Lake, ON
Sauce Italian Kitchen & Market – Calgary, AB
Scaddabush Italian Kitchen & Bar – Toronto, ON
Seasons in the Park – Vancouver, BC
Sicilian Pasta Kitchen (South) – Edmonton, AB
Smith Bros. Steakhouse Tavern – Toronto, ON
Smuggler's Inn – Calgary, AB
Tea at The Empress – Victoria, BC
Terroni – Toronto, ON (Multiple Locations)
Vaticano Cucina – Edmonton, AB
Whitewater Brewing Company – Lakeside Brew Pub – Cobden, ON
Wienstein & Gavino's – Montréal, QC
YEW seafood + bar – Four Seasons Hotel – Vancouver, BC
The complete list may also be viewed at https://www.opentable.com/lists/ca-best-kid-friendly-restaurants-2018
The Grades Are In: Most Americans Score 'F' On Fat IQ Test
While 85 percent of Americans say they know how to eat right, more than half flunked a basic quiz on dietary facts and weight loss. The MDVIP Fat IQ Survey, conducted by Ipsos Public Affairs, reveals contradictory behaviors relating to obesity and weight management and explores deeper motivations that may stimulate lifestyle changes and offer Americans a higher probability of losing weight successfully.
America's Fat IQ Report Card
Grade on Fat IQ Quiz percent of Respondents
A Grade (90 percent+) <1 percent
B Grade (80 percent-89 percent) 2 percent
C Grade (70 percent-79 percent) 10 percent
D Grade (60 percent-69 percent) 32 percent
Fail (0 percent-59 percent) 56 percent
"Contrary to what most Americans think, they are largely ill-informed when it comes to proper dieting and weight loss,” said Dr. Andrea Klemes, chief medical officer at MDVIP. "It's easy for people to become overwhelmed by the constant flood of information, which can be confusing. For instance, many people still believe that strength training makes it harder to lose weight, when actually having more muscle helps you burn more calories. As their report card shows, Americans need help separating the facts from fiction.”
Physician Intervention May Fill Gaps
The survey shows a staggering 82 percent of adults are currently over their ideal weight. When it comes to shedding excess pounds, 4 out of 5 Americans say that hearing from a doctor that they need to lose weight would motivate them (83 percent). An even greater number (90 percent) say they would be influenced if a doctor told them that they have a serious health risk. Yet, only 1 in 5 Americans say they've actually asked their primary care doctor for weight loss help or advice (20 percent).
Dr. Klemes said, "Obesity is a serious disease that warrants medical attention and treatment. Yet, the survey data suggests that Americans aren't tapping into the one resource that could have the most influence on their weight – their physician. Time constraints in the exam room are a serious limitation, plus the misconception that obesity is a personal choice prevents people from establishing an open dialogue with their doctor. Instead, the topic of weight doesn't come up until it's manifested into a more pressing health concern like chronic back pain, high cholesterol or worse – a diagnosis of diabetes, heart disease or cancer.”
Additional Statistics
The survey uncovers additional layers of inconsistency in what Americans say they know about nutrition, dieting, and their motivations and barriers to weight loss:
- 3 out of 4 Americans admit they would feel better if they tried harder to stay fit (75 percent).
- But most say lack of motivation to stick with a diet or exercise plan (58 percent) and lack of willpower to resist food temptations (55 percent) are top reasons they have more difficulty losing weight.
- More than a third of Americans blame their weight-loss difficulties on bad genetics (35 percent).
- 85 percent of Americans claim they have the knowledge to eat the way they think they should.
- However, the same percentage of Americans either under-estimate (50 percent) or don't know (35 percent) how many calories they need to burn to lose one pound of weight. The correct answer is 3,500 calories.
- 3 out of 4 obese Americans say they diet and exercise out of concern about their long-term health (75 percent).
- Yet, nearly two-thirds of obese Americans believe most diet plans ultimately fail (64 percent).
- 1 out of 4 obese Americans have actually put off or considered delaying a doctor's appointment until they lost weight.
Comparable to other published data on U.S. adult obesity rates, 35 percent of the survey respondents are classified as obese, and another 30 percent are overweight based on their Body Mass Index (BMI). Obese Americans are known to have an increased risk for many serious diseases and chronic conditions, including hypertension, high cholesterol, type 2 diabetes, coronary heart disease, stroke, osteoarthritis and some cancers.
In addition to the national findings, the MDVIP Fat IQ Survey provides regional results for 10 major U.S. cities, including New York, Los Angeles, Chicago, San Francisco, Boston, Washington, DC, Atlanta, Houston, Phoenix and Miami.