MRM Research Roundup: Resale Dynamics, Meal Program Benefits, and Private Chef Demand
11 Min Read By MRM Staff
This edition of Modern Restaurant Management (MRM) magazine's Research Roundup features consumer traffic patterns, resale market dynamics, menu pricing, insights on workplace meal programs, demand for private chefs, and qualities of a good sports bar.
Customer Traffic Standouts
Restaurant traffic is still soft – QSR traffic was down 1.2 percent year-over-year last quarter – but RMS's new Q2 2026 Consumer Survey (926 U.S. diners) found the story isn't just decline. It's about who's still showing up, and why.
A few standouts:
Commute beats demographics: Hybrid workers are still crazy about restaurants – 37 percent plan to increase their visits going forward, up 21 percent YOY – and they are more likely to be frequent drive-thru users, visiting 3+ times a week at nearly double the rate of full-time remote workers.
The generational split is widening: Gen Z and Millennials are the only generations increasing restaurant visits and spend; Boomers and Gen X are pulling back.
Takeout is growing, particularly among those big-spending Gen Z and Millennials, while delivery has slipped back to year-ago levels — just 49 percent of respondents report at least one weekly delivery order, compared to 77 percent for takeout and 80 percent for dine-in. Not surprising: a $10.29 QSR combo ordered through DoorDash or Uber Eats carries a roughly 30 percent in-app markup, a delivery fee, a platform service fee and a tip — pushing a $10 meal to nearly $27.
Grocery is restaurants' quiet competitor: more diners now report buying meals from grocery stores more often than less, and Gen Z leads that shift at 4x the rate of Boomers.
World Cup Results
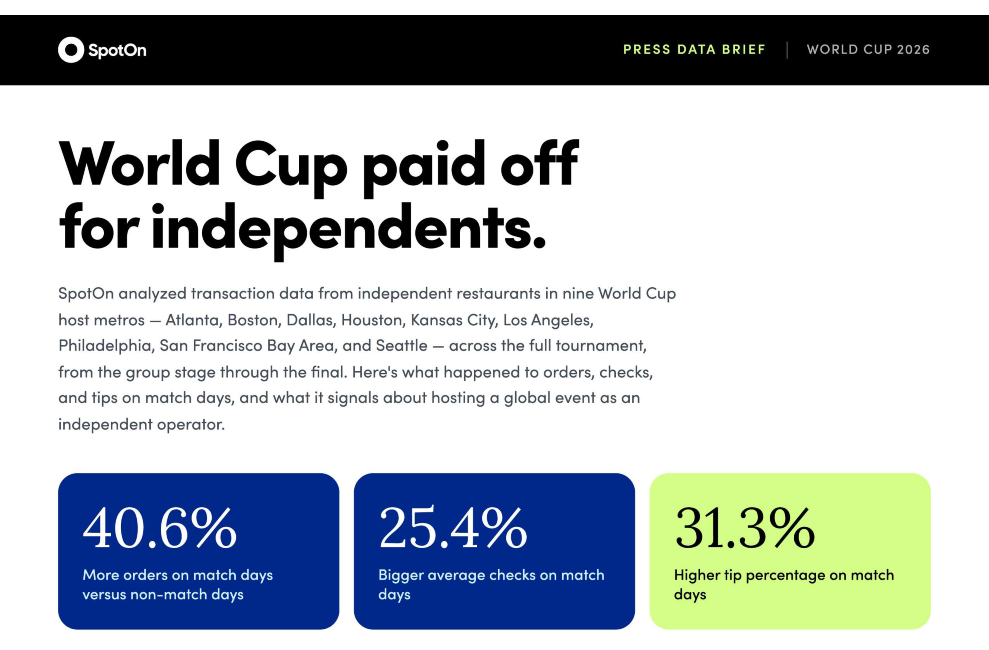
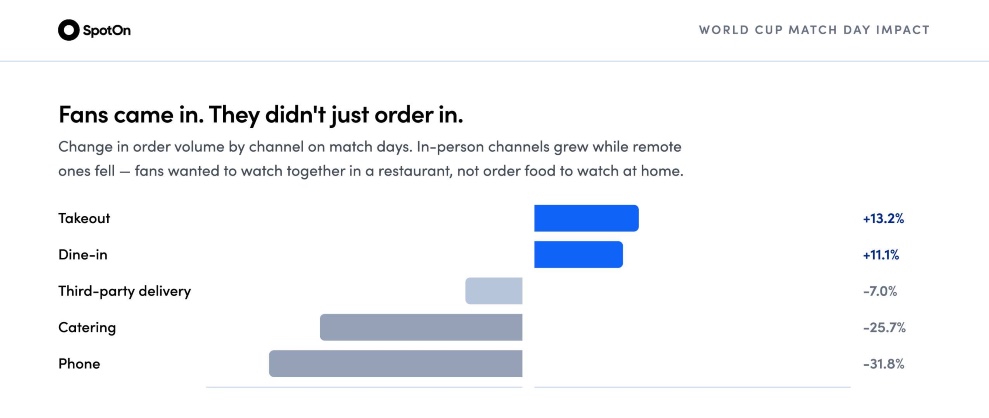
New SpotOn point-of-sale data from nine World Cup host metros on match days:
-
Orders rose 40.6 percent versus non-match days
-
Average checks were up 25.4 percent
-
Tip percentage rose 31.3 percent, outpacing check growth
-
Philadelphia led with a 28 percent check lift, while Dallas restaurants saw checks fall roughly 40 percent against their own baseline
Restaurant Resales
We Sell Restaurants, released its State of the Restaurant Resale Market report for the first half of 2026, revealing a national market that contracted in transaction volume even as buyer behavior has shifted decisively.
By combining national data and one of the largest restaurant-specific transaction datasets in the country – We Sell Restaurants’ own internal data on closings, buyer inquiries, signed confidentiality agreements and listing activity – the report details what buyers are pursuing, which cuisines and concepts lead the way, where demand is shifting and why.
Six Forces Reshaping the Market
According to data from BizBuySell, restaurant sales fell 5.8 percent year over year in the first quarter of 2026 and 11.7 percent in the second, with the national median sale price dropping 11.8 percent to $205,000. Yet the average cash flow multiple paid for a restaurant climbed to 2.41, and sold-to-asking-price ratios reached 90.3 percent nationally. This means the market is not paying less for restaurants. It is buying smaller ones and rewarding sellers who price accurately.
We Sell Restaurants identified six forces driving the first-half market:
-
Elevated borrowing costs are pushing buyers toward lower purchase prices, established franchise brands and equipped spaces that require less capital, with the prime rate holding at 6.75 percent and SBA 7(a) acquisition loans running roughly 9–11.5 percent.
-
Construction costs are up roughly 30 percent since 2020, and new retail construction has fallen to record lows, making it increasingly difficult to build new restaurant space — and increasingly attractive to buy existing space instead.
-
The "Silver Tsunami" of retiring Baby Boomer owners is fueling a growing pipeline of franchise transfers and independent sales.
-
Franchise resales are surging. Their share of the firm's closings climbed from 28.1 percent in the first quarter to 37.9 percent in the second, reaching 45.2 percent by June — more than double their share of all 2025 closings.
-
Asset sales are climbing every month. Buyer intent for turnkey, equipped, open-and-operating restaurants sold for their location and build-out grew 400 percent from January to June.
-
Migration into the Southeast continues to compound, with the eleven-state "Boom Belt" generating 83 percent of the firm's first-half closings and nearly nine of every ten signed confidentiality agreements by June.
Voice of the Industry
Toast released its 2026 Voice of the Restaurant Industry Survey, offering fresh data on how U.S. restaurant operators are navigating inflation, labor shortages, AI adoption, and revenue growth.
The survey of 600+ restaurant decision-makers reveals an industry doubling down on durability, technology, and growth despite macro pressures.
Key takeaways include:
Durable Business Health: Ninety-one percent of operators rate their business health as good or excellent (unchanged YoY).
Top Challenges Rising: Inflation is the #1 pain point at 27 percent (+7 percent pts YoY), followed by hiring at 22 percent (+6 pts YoY).
Profitability via Growth: Profitability remains the #1 goal (37 percent). Operators are pursuing it by generating new revenue streams (+6 pts YoY to 27 percent) and driving guest demand (30 percent), rather than cutting services.
Managing Inflation and Labor: Forty-three percent of operators will raise menu prices if costs rise (down 5 percent YoY), while 39 percent are focusing on running leaner inventory (+12 pts YoY). If labor challenges mount, 51 percent plan to increase staff efficiency and service speed.
Hiring Shifts: Forty-nine percent plan to increase headcount (down from 60 percent in 2025), while 48 percent plan to keep staffing levels the same.
AI Adoption and Experimentation: Eighty-seven percent of operators feel comfortable using AI (+1 pt YoY), 85 percent plan to use it more in the future, and 81 percent believe it offers great value for the money. 42 percent are actively experimenting with AI through their existing tech vendors.
July Menu Price Monitor
Toast released its July Menu Price Monitor, offering a granular view of how inflation is truly impacting restaurant menus. July data shows hot dogs hit a record high of $7.74 during peak grilling season, drip coffee reached a record $3.77, and burritos posted their largest monthly jump in over a year; chicken wings were the sole item to see prices fall.
July Menu Price Monitor highlights include:
🍳 Omelette prices hold firm: The median price of an omelette stayed flat at $15.00 from June 2026 and is up 1.8 percent since July 2025.
🌭 Hot dogs hit a record high: The median price of a hot dog reached $7.74 in July 2026 (the highest since tracking began), up 1.0 percent from June 2026 and up 3.4 percent since July 2025.
☕️ Coffee keeps climbing: The median drip coffee price rose to $3.77 (an all-time high), up 0.5 percent from June 2026 and up 7.4 percent since July 2025.
🧊 Cold brew prices hold steady: The median price of cold brew remained flat at $5.62 from June 2026, though prices are up 3.5 percent since July 2025.
🍔 Burger prices remain flat: The median price of a burger was $14.72, up 0.1 percent from June 2026 and up 2.3 percent since July 2025.
🍗 Chicken wing prices ease again: Chicken wings were the only monitored item to drop in July, down 0.4 percent to $13.86 from June 2026, though still up 1.1 percent since July 2025.
🌯 Burritos roll to biggest jump in over a year: The median price of a burrito rose to $13.67, up 0.7 percent from June 2026 and up 2.2 percent since July 2025.
🍻 Beer prices bubble up slightly: The median price of a beer was $6.61, up 0.2 percent from June 2026 and up 2.5 percent since July 2025.
Meal Impact
DoorDash for Business released the 2026 Meal Impact Report, based on a survey* of more than 1,000 U.S. workplace decision-makers. The findings show that meal benefits are taking on a bigger role in return-to-office strategies and the broader benefits mix, while workplace meal programs expand beyond the traditional lunch order.
Meals are part of the RTO playbook and a core part of the benefits package
-
Meals are competing with more established benefits: 46 percent of workplace decision-makers say their companies compare meal benefits with other offerings such as commuter benefits, phone stipends and wellness perks.
-
Meals are playing a role in RTO strategies: Among hybrid companies focused on increasing office attendance, 93 percent say meal benefits help drive employees back to the office, while 47 percent are calling it a major part of their approach.
-
The benefit extends beyond the office: Three in four companies extend meal credits or reimbursements to hybrid or remote employees, allowing employers to use the same benefit across in-office and remote teams.
Meal programs are moving beyond the office lunch
For restaurants, the findings point to meal programs becoming a broader opportunity than the traditional individual lunch order. While lunch remains the most common employer-sponsored meal, companies are also paying for group meals and expanding into other parts of the day.
-
Dinner remains largely untapped: Among companies that provide meals directly, 76 percent cover lunch, compared with just 35 percent that cover dinner.
-
Group and catered meals are already mainstream: 66 percent of employers providing meals directly cover group meals for meetings, trainings or team events.
-
Work travel extends the opportunity beyond the office: 96 percent of companies see value in managing everyday and travel meals in one place, providing restaurants with another opportunity to reach employees beyond the office, wherever work takes them.
The findings point to a shift in how companies approach employee satisfaction; meals are increasingly becoming part of how employers think about attendance and employee benefits, while companies are looking for ways to improve programs without simply increasing spend. For restaurants, that evolution is expanding the workplace dining opportunity beyond the individual lunch order.
What Makes a Great Sports Bar?
DIRECTV has some research that highlights why sports bars are having a cultural moment, what makes a great sports bar, what fans go out to watch, and some eyebrow-raising stats on what fans are willing to do for the love of the game.
Key findings:
The Couch Has Competition as Sports Bars Rival Home Viewing On Game Days
-
Sports bars tie with home viewing for where fans prefer to watch games – trailing only two percentage points behind catching a game in the stadium.
What Sports Bar Fans Want To Watch
-
Ninety percent of sports bar fans are football fans – great news for bar owners this fall.
-
The NFL love is so strong that one in four sports bar football fans would choose to be live on the 50-yard line watching their favorite team win the Super Bowl over being present for the birth of their child!
-
Twenty-eight percent of fans go to bars specifically to see games they can’t watch at home – which makes sense as sports rights continue to scatter across multiple networks/apps.
What Makes A Great Sports Bar?
-
Top three fan favorite things about going to a sports bar are the vibe (51 percent), food and drink selection (50 percent), and large-screen TVs (40 percent).
-
Food/drink specials, crowd reactions, fellow/rival fans, and a packed, high-energy environment make for a winning game day atmosphere, according to fans.
-
Fans picked chicken wings three-to-one over burgers as their go-to food.
-
Nearly half (48 percent) of sports bar drinkers would pass on a 10 percent raise at their current job for free drinks for life at their favorite watering hole!
Who Are Sports Bar Fans?
-
Sixty-six percent of fans made a new friend at a sports bar; 14 percent met a romantic partner or spouse; 15 percent made professional networking contacts.
-
Nearly 80 percent have altered plans in the past 12 months to watch sports, with 40 percent having left work early and 23 percent calling in sick.
-
Fifty-four percent have game day superstitions – 32 percent did confess to wearing a lucky jersey, hat, shirt, or socks, while others had some pretty specific sports bar rituals including going to the same sports bar for important games to improve their team’s chances of winning (21 percent), eating/drinking the exact same thing on game day (16 percent), sitting in a specific seat or table for the whole game (14 percent), refusing to move, stand, or leave the room during a winning streak (10 percent), and even going so far as to avoid visiting a bar where their team previously lost (7 percent).
-
More than half of fans have stayed at a sports bar for 2-4 hours; 34 percent stayed 4-6 hours; 3 percent admit to running up a tab for over 8 hours straight.
Active QSR Demand
Sytes, the tenant-driven commercial real estate marketplace that connects landlords directly to pre-vetted tenants across 30+ categories. Despite QSR traffic actually declining 1.2 percent year-over-year in Q2 2026, with growth coming from pricing and bigger orders rather than more customers walking in, new tenant-demand data from Sytes shows QSR brands make up 33 percent of every active site search nationwide (one in three expanding tenants).
As we see the same brands that are losing ground on visits are expanding their physical footprint faster than almost anyone else in retail, some additional top stats include:
-
The Miami-over-New-York upset: Miami just edged out NYC as the No. 1 retail expansion target in the country — 4.0 percent of all national tenant demand vs. New York's, by hundredths of a point. And Miami's growth isn't even QSR-driven like everywhere else — it's the only top-five metro where coffee, not fast food, leads local demand, at 34.8 percent.
-
Dallas and Minneapolis are Leading the QSR Boom: In Dallas and Minneapolis, more than half of all retail tenant demand is now QSR — while Seattle and San Francisco are the last holdouts still diversifying.
-
American Still Runs on Efficiency: Coffee concepts and speed-focused food and beverage is 56.7 percent of all national tenant demand.
Findings are drawn from an August 2026 analysis of all live tenant expansion campaigns — public and private — on the Sytes marketplace. Each campaign represents a tenant actively searching for a location, categorized by the tenant’s stated retail category and acceptable building types (a multi-select, so building-type figures do not sum to 100 percent). Campaigns were assigned to metropolitan statistical areas by spatially matching each search area’s center point against MSA boundaries; 90.3 percent of national demand falls inside a defined MSA. Flex, industrial, warehouse and home-improvement building types are combined and deduplicated. All figures are percentages of demand; underlying campaign counts are proprietary.
Pokemon Popularity
Krispy Kreme’s launch of a limited-edition Pokémon doughnut collection on Tuesday, August 18 had a pretty sweet impact on foot traffic, according to a new Placer.ai report.
Foot traffic surged 45.7 percent that day compared to the average Tuesday for the previous 12 months, surpassing even some of the days when Krispy Kreme gave away free doughnuts.
The following Saturday, August 22, Krispy Kreme offered customers wearing Pokémon attire a free Original Glazed doughnut, which increased visits by 19.9 percent compared to the average Saturday — still far below the Tuesday launch, for which no freebie was offered.
“Even without giving away free doughnuts, Krispy Kreme can still pack the house,” the report notes.
Demand for Private Chefs
Demand for private chefs is increasing across the US, with more than 12 million households using private or semi-private personal chef services¹.
With this in mind, staffing experts at Morgan & Mallet analyzed the number of clicks to their hiring private chef pages to reveal the states with the most demand for private chefs. The experts have also advised on how to pick a chef that suits your lifestyle.
The US states with the highest demand for private chefs:
|
Rank |
State |
percent of US interest in private chefs of visits to ‘hire a private chef’ pages – January 2024 to July 2026 |
|
1 |
California |
26.3 percent |
|
2 |
Florida |
16.8 percent |
|
3 |
New York |
11.7 percent |
|
4 |
Texas |
9.1 percent |
|
5 |
Georgia |
2.5 percent |
|
6 |
North Carolina |
2.4 percent |
|
7 |
Pennsylvania |
1.9 percent |
|
7 |
Michigan |
1.9 percent |
|
7 |
Washington |
1.9 percent |
|
7 |
Virginia |
1.9 percent |
California tops the ranking as the state with the highest demand for private chefs. Many clients require chefs who can accommodate specialist diets or collaborate with personal trainers and nutritionists to create tailored meal plans. Demand also varies across the state's major cities. In San Francisco, chefs are increasingly embracing technology, using app-based inventory management, digital meal planning and smart kitchen systems. Meanwhile, 41 percent of Morgan & Mallet's Los Angeles chef candidates hold both culinary and nutrition certifications, making LA one of the strongest markets for more health-focused private chefs.
Florida ranks second, with demand likely driven by luxury estates and wellness-focused households. Around 66 percent of chefs in Miami have managed culinary operations in estates with multiple household staff, while 71 percent of placements involve back-of-house or show kitchens. In addition, 57 percent of Miami clients request chefs who can work alongside personal trainers or wellness physicians to support nutrition plans.
New York takes third place, in line with strong demand for chefs experienced in luxury service and seasonal living. Around 33 percent of chef candidates in New York have experience planning discreet private events, while 54 percent are trained in both estate service and luxury hospitality. Additionally, 61 percent regularly travel between Manhattan and Hamptons estates, and 91 percent complete full annual or longer-term contracts, highlighting the preference for long-term professionals.
The Power of Signage
Custom Neon recently surveyed diners across the US to explore how restaurant signage influences where people choose to eat, whether they can easily find a venue, and what makes them stop, take a photo, or share it online.
Among the findings:
-
Ninety-three percent have struggled to find a restaurant because its signage was poor or missing
-
Eighty-two percent have visited an unfamiliar restaurant simply because the sign caught their eye
-
Eighty percent said neon is the type of restaurant display they would be most likely to photograph
-
Fifty-one percent have shared a photo of restaurant signage on social media and tagged the venue
Beverage Rankings
Gatorade leads YouGov’s 2026 U.S. beverage rankings, with 41 percent of U.S. adults saying they would consider purchasing the brand the next time they are in the market for a beverage. Coca-Cola ranks as the most considered soft drink brand, while Dasani and Starbucks post the two largest year-over-year gains in Consideration. The data also shows how leading beverage brands compare on perceptions of Value and Quality, with cross-category Consideration scores intended as a broader indication of brand strength rather than a direct head-to-head comparison.
Key findings include:
-
Gatorade leads overall beverage Consideration at 41 percent, more than five points ahead of Coca-Cola (35.6 percent). Lipton ranks third at 32.3 percent, followed by Starbucks (28.6 percent) and Tropicana (28.2 percent).
-
Gatorade has an especially commanding lead in energy and hydration, with 41 percent Consideration compared with 21.3 percent for second-place Powerade, a gap of nearly 20 percentage points.
-
Coca-Cola leads the soft drink category, with 35.6 percent Consideration, ahead of Pepsi at 26.7 percent, Sprite at 25.1 percent and Dr Pepper at 23 percent.
-
Lipton ranks first among coffee, juice and tea brands, with 32.3 percent Consideration, followed by Starbucks (28.6 percent) and Tropicana (28.2 percent).
-
Aquafina leads water brands at 23.2 percent, followed by Dasani at 19.6 percent and Smartwater at 18.6 percent.
-
Dasani records the biggest year-over-year increase in Consideration, rising 3.8 points from 15.8 percent to 19.6 percent. Starbucks follows with a 3.5-point gain (25.1 percent to 28.6 percent), while Dr Pepper rises 3.1 points (19.9 percent to 23.0 percent).
-
Gatorade also leads on perceptions of both Value and Quality, with Net scores of 33.2 and 45.5, respectively. Lipton ranks second in both measures, with a Value score of 32.5 and a Quality score of 40.8.
-
High Consideration does not always translate into strong Value perceptions. Starbucks ranks fourth overall on Consideration but records a Net Value score of -15.1 and is outside the top 25 beverage brands on Quality perception.