

What Planned 2026 Openings Reveal About Restaurant Size and Seating
4 Min Read By Joe Dunbar
Restaurant real estate is often described through one broad theme: smaller boxes, more off-premise capacity and fewer dining-room seats. Planned 2026 restaurant openings show a more varied market. Compact fast-casual and quick-service locations are expanding alongside casual/family and upscale restaurants built around substantially larger dining rooms.
Planned 2026 location records do not point to one restaurant prototype. They show a segmented market, with compact service-driven footprints expanding alongside larger full-service and upscale dining spaces.
RestaurantData reviewed 3,381 growth-stage location records tied to planned 2026 activity among restaurant companies operating from two through 19 units. Square footage was available for 294 locations, while seating capacity was available for 166. Those fields are incomplete across the full population, but the recorded subset provides a useful view of how space requirements differ by restaurant format, price point and operating model.
Across locations with recorded square footage, the median planned footprint is 3,000 square feet. The middle half ranges from 2,000 to 5,000 square feet. Recorded seating has a median of 90 seats, with the middle half ranging from 50 to 175 seats.
Service Format Produces the Clearest Differences
The strongest distinction is not between younger and more established multi-unit companies. It is between operating formats. Fast-casual and quick-service locations each have a median recorded footprint of 1,750 square feet. Casual/family restaurants rise to 3,500 square feet, while upscale dining locations have a median of 6,000 square feet.
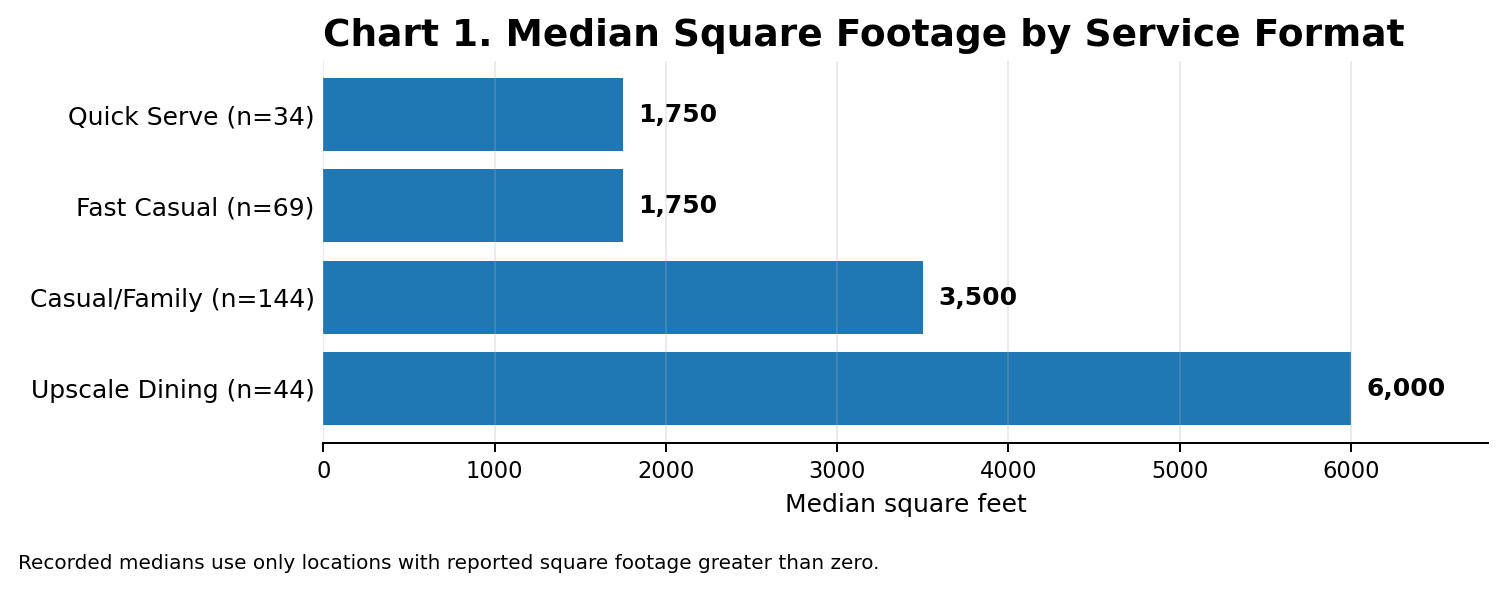
Seating follows the same progression: quick serve has a median of 40 seats, fast casual 60, casual/family 125, and upscale dining 200.
The difference is substantial. The median upscale dining footprint is more than three times the median fast-casual or quick-service footprint. Yet the data does not indicate that one model is replacing another. Instead, the 2026 pipeline contains multiple approaches to restaurant growth, from compact service-driven formats to large dining and experience-oriented spaces.
Company Growth Stage Does Not Determine Restaurant Size
The file separates micro-regional companies operating two to four units from regional multi-unit companies operating five to 19 units. Both groups have the same median recorded footprint: 3,000 square feet.
The difference is more visible in seating. Micro-regional locations with recorded capacity have a median of 80 seats, compared with 100 seats among regional multi-unit locations. Even so, the identical square-footage median suggests that restaurant size does not automatically increase as a company adds units. A growing operator may continue using a repeatable compact prototype, while a smaller company may open a larger full-service restaurant.
Check Average Closely Tracks Footprint
The source-defined check-average bands produce a similarly clear pattern. Locations in the $4-to-$15-plus band have a median recorded footprint of 1,750 square feet and 60 seats. The $10-to-$30-plus band moves to 3,000 square feet and 100 seats. The $15-to-$40-plus band reaches 3,500 square feet and 100 seats, while the $25-to-$75-plus band has a median of 6,000 square feet and 200 seats.
That progression reflects the operating requirements behind each format. Higher-check restaurants generally allocate more room to dining, bars, kitchens and guest experience. Lower-check formats are more likely to emphasize throughput, pickup, counter service and smaller dining areas.
Selected States Show a Wider Range Than the Regional View
Regional medians are fairly close to one another, so they are not the most interesting geographic lens in this file. State-level examples reveal more variation. The chart below highlights six states with a meaningful number of recorded square-footage observations and a wider range of medians.
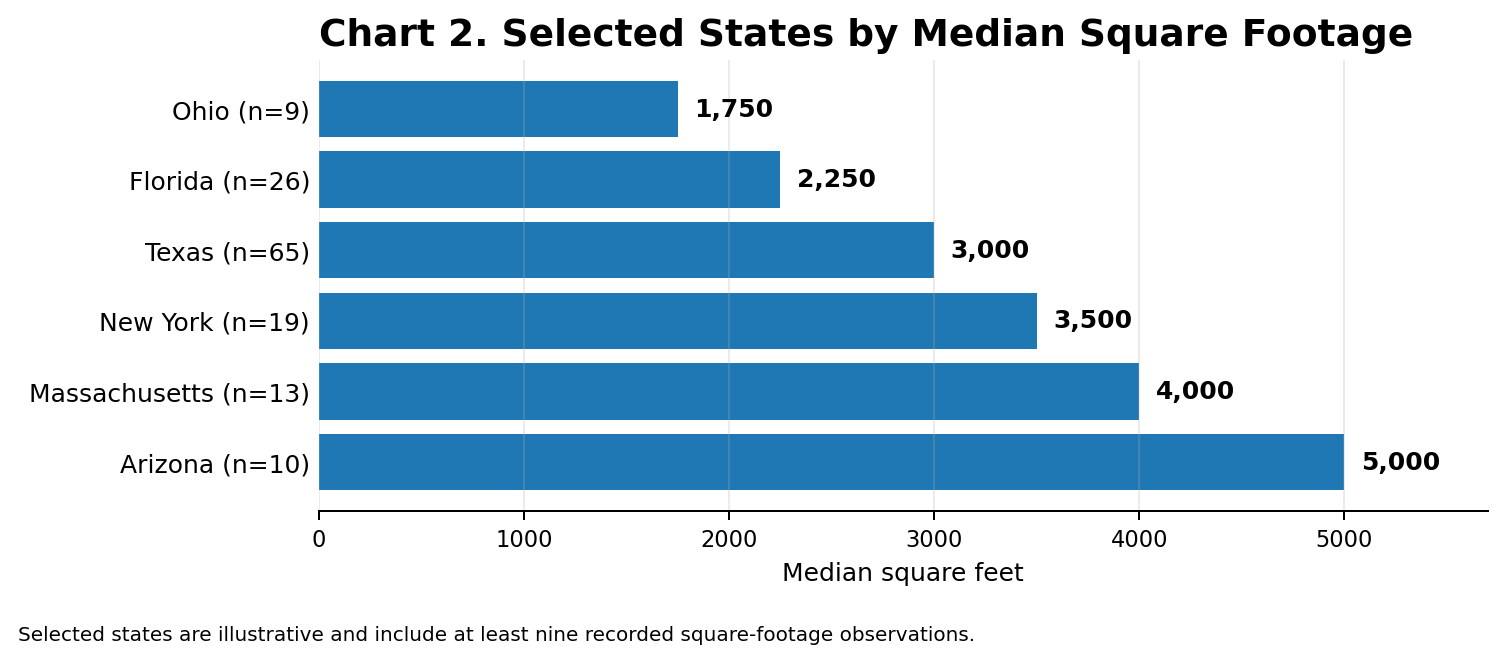
The state differences are directional and reflect the mix of formats, concepts and sites represented in each recorded subset.
The state variation still should not be over-read. It reflects local concept mix, service model, site availability and expansion strategy. But it does reinforce the broader point: restaurant growth in this file is not converging around one physical format.
Four Planned Locations Show the Range
100 Montaditos has two planned Florida locations recorded at 1,750 square feet and 70 seats each. Amy's Ice Creams has a planned Richmond, Kentucky, location recorded at 2,000 square feet and 80 seats.
At the larger end of the range, Adriatic Cafe and Italian Grill has a planned Rosenberg, Texas, location recorded at 6,000 square feet and 250 seats. Agora has a planned Bethesda, Maryland, location recorded at 6,000 square feet and 300 seats.
These examples are not presented as a ranking or a prediction of performance. They illustrate how restaurants within the same broader expansion market can require very different footprints and seating plans.
Site Type Adds Another Layer
Among the larger site categories with recorded square footage, shopping-center locations have a median of 2,500 square feet, mixed-use locations 3,000 square feet and freestanding locations 3,500 square feet. Site type does not override restaurant format, but it influences the space available, the cost structure and how operators balance dining capacity with pickup, parking and back-of-house needs.
What “Evolving Footprints” Means in This File
The data does not support a simple conclusion that restaurant footprints are universally contracting or expanding. It shows segmentation. Fast-casual and quick-service growth is occurring in smaller spaces, while full-service and upscale concepts continue to commit to larger footprints and higher seating capacity. At the same time, both early-stage and more established regional operators are using a wide range of prototypes.
For restaurant owners, developers, suppliers and real-estate professionals, the practical implication is that unit count alone is not enough to estimate a new location’s physical requirements. Service type, check average, site setting and the intended guest experience provide a more precise view of the footprint likely to be used.
Methodology: This analysis uses 3,381 valid RestaurantData growth-stage location records associated with planned 2026 activity. Research periods extend from September 2025 through July 2026. Square-footage and seating results describe only records in which those fields were available and greater than zero. Chart 2 uses selected states with a meaningful number of square-footage observations and displays medians for the recorded subset only. Contact names, telephone numbers and email addresses were excluded. Planned locations may be delayed, changed or canceled after the research date.
Complete source report: New Weekly Alerts: 2026 Emerging Restaurant Brand Growth Report