MRM Research Roundup: Holiday Spend, Drinksgiving Data, and Smarter Dining
14 Min Read By MRM Staff
This edition of Modern Restaurant Management (MRM) magazine's Research Roundup features holiday dining and spending, foot traffic trends at Starbucks, culinary trends and forecasts, AI integration, and views on gene-edited food.
The Cost of Thanksgiving at Restaurants
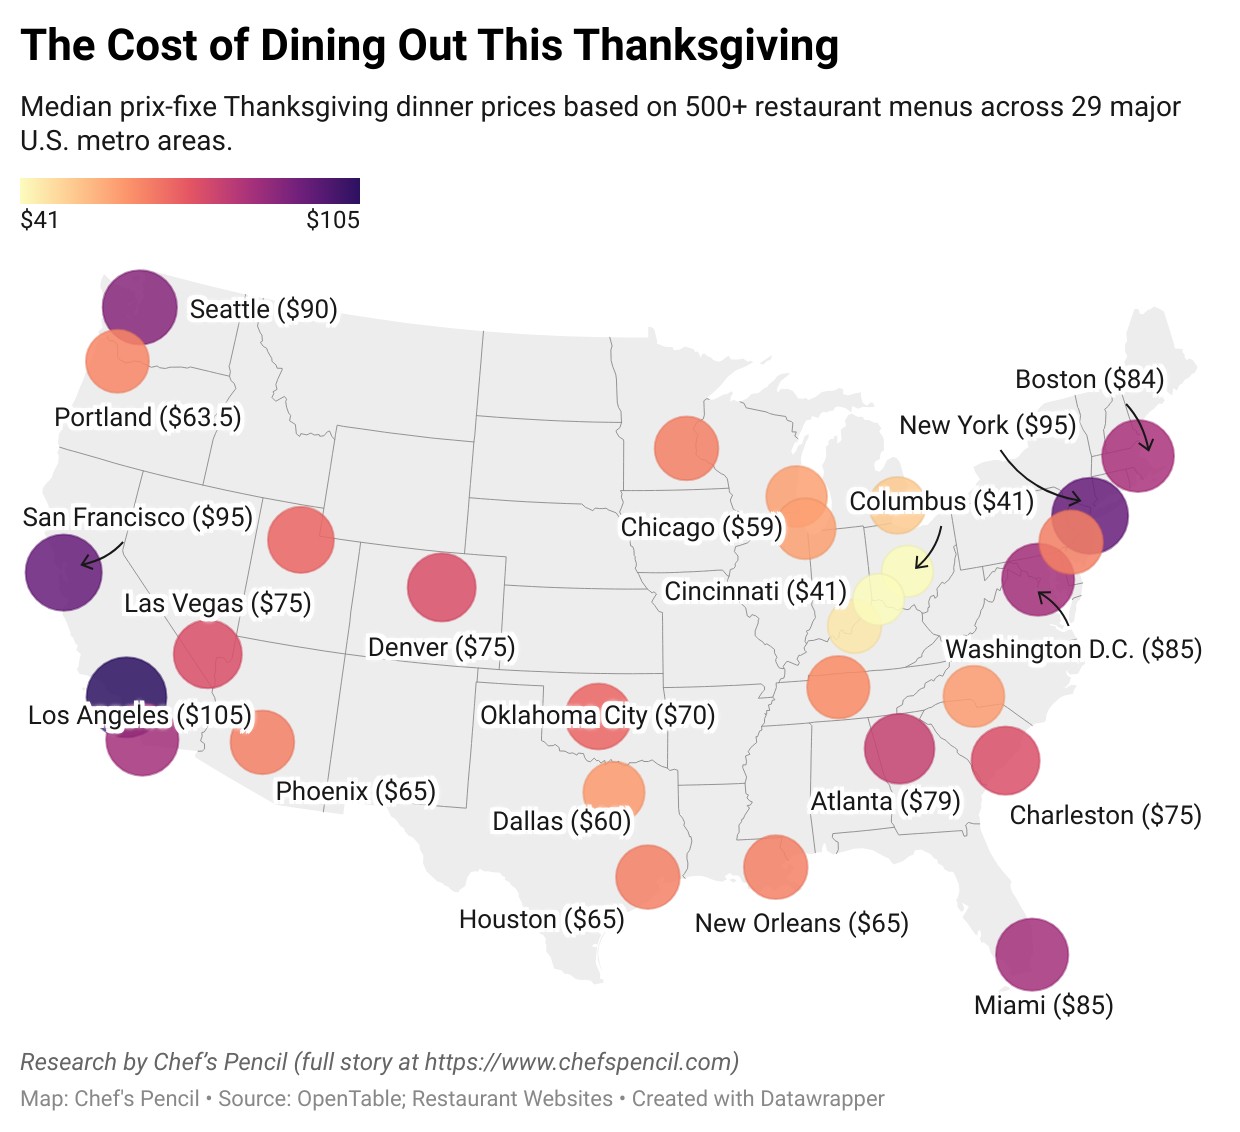
Chef’s Pencil released a national analysis of Thanksgiving restaurant prices and the data tells a surprisingly wide-ranging story about how much Americans are paying to skip the cooking this year.
They reviewed 500+ restaurant menus across 29 major U.S. cities, from casual chains to Michelin-starred dining rooms, to calculate the true cost of a Thanksgiving prix-fixe meal in 2025.
Key findings include:
-
National median price: $75 per person (excluding drinks/tips).
-
Most Expensive Cities: Los Angeles ($105 median) is the only city where the median price broke the triple-digit mark, followed by San Francisco and New York City (both $95).
-
Best-value cities: Cincinnati & Columbus (both ~$41)
-
Price extremes: meals range from $28 to a $295 Thanksgiving Michelin-star tasting menu
Holiday Dining Spend
Despite higher grocery bills, Americans are drawing a firm line at the holiday table. According to the DuraPlas 2025 Holiday Foods Survey, two-thirds of U.S. adults expect to spend more on holiday meals this year, yet nearly half say they will not alter their menus.
The survey of 1,000 U.S. adults, conducted in September 2025 via the third-party platform Pollfish, examined how rising costs affect holiday meal planning, shopping habits and social gatherings.
Key findings from the report include:
-
Two-thirds of Americans (66 percent) expect their holiday meal to cost more this year, with nearly one in five bracing for much higher costs.
-
Despite inflation, 43 percent say they will make no changes to their meals, choosing tradition over trimming.
-
A majority (57 percent) plan to keep their holiday rituals exactly the same as prior years.
-
Flavor is the top driver of holiday food choices at 46 percent, outpacing price (30 percent), tradition or brand loyalty (22 percent) and sustainability (3 percent).
-
More Americans are willing to pay extra for premium, sustainable ingredients, up from 14.5 percent in 2023 to 25 percent this year, as quality continues to outweigh cost concerns.
-
Most (59 percent) are buying ingredients at the same time as usual and 37 percent will be shopping earlier.
-
Nearly three-quarters (74 percent) will attend about the same number of holiday meals, and 61 percent expect seven or more guests to attend their main gathering.
-
32 percent say all of their dishes are homemade, skyrocketing to 76 percent for at least half made from scratch.
-
Convenience hasn’t replaced tradition, as 71 percent have never used instant delivery for holiday meal needs.
Holiday traditions aren’t just resilient, they create predictable demand. Even as inflation changes how consumers spend in other areas, categories tied to seasonal meals, from proteins to produce, remain essential. For food producers and suppliers, the opportunity lies in balancing affordability with quality, ensuring that trusted staples stay within reach for families who refuse to compromise on tradition.
Fast Food Pricing
Fast food fans might want to check their receipts – because takeout prices have been quietly climbing across the U.S.
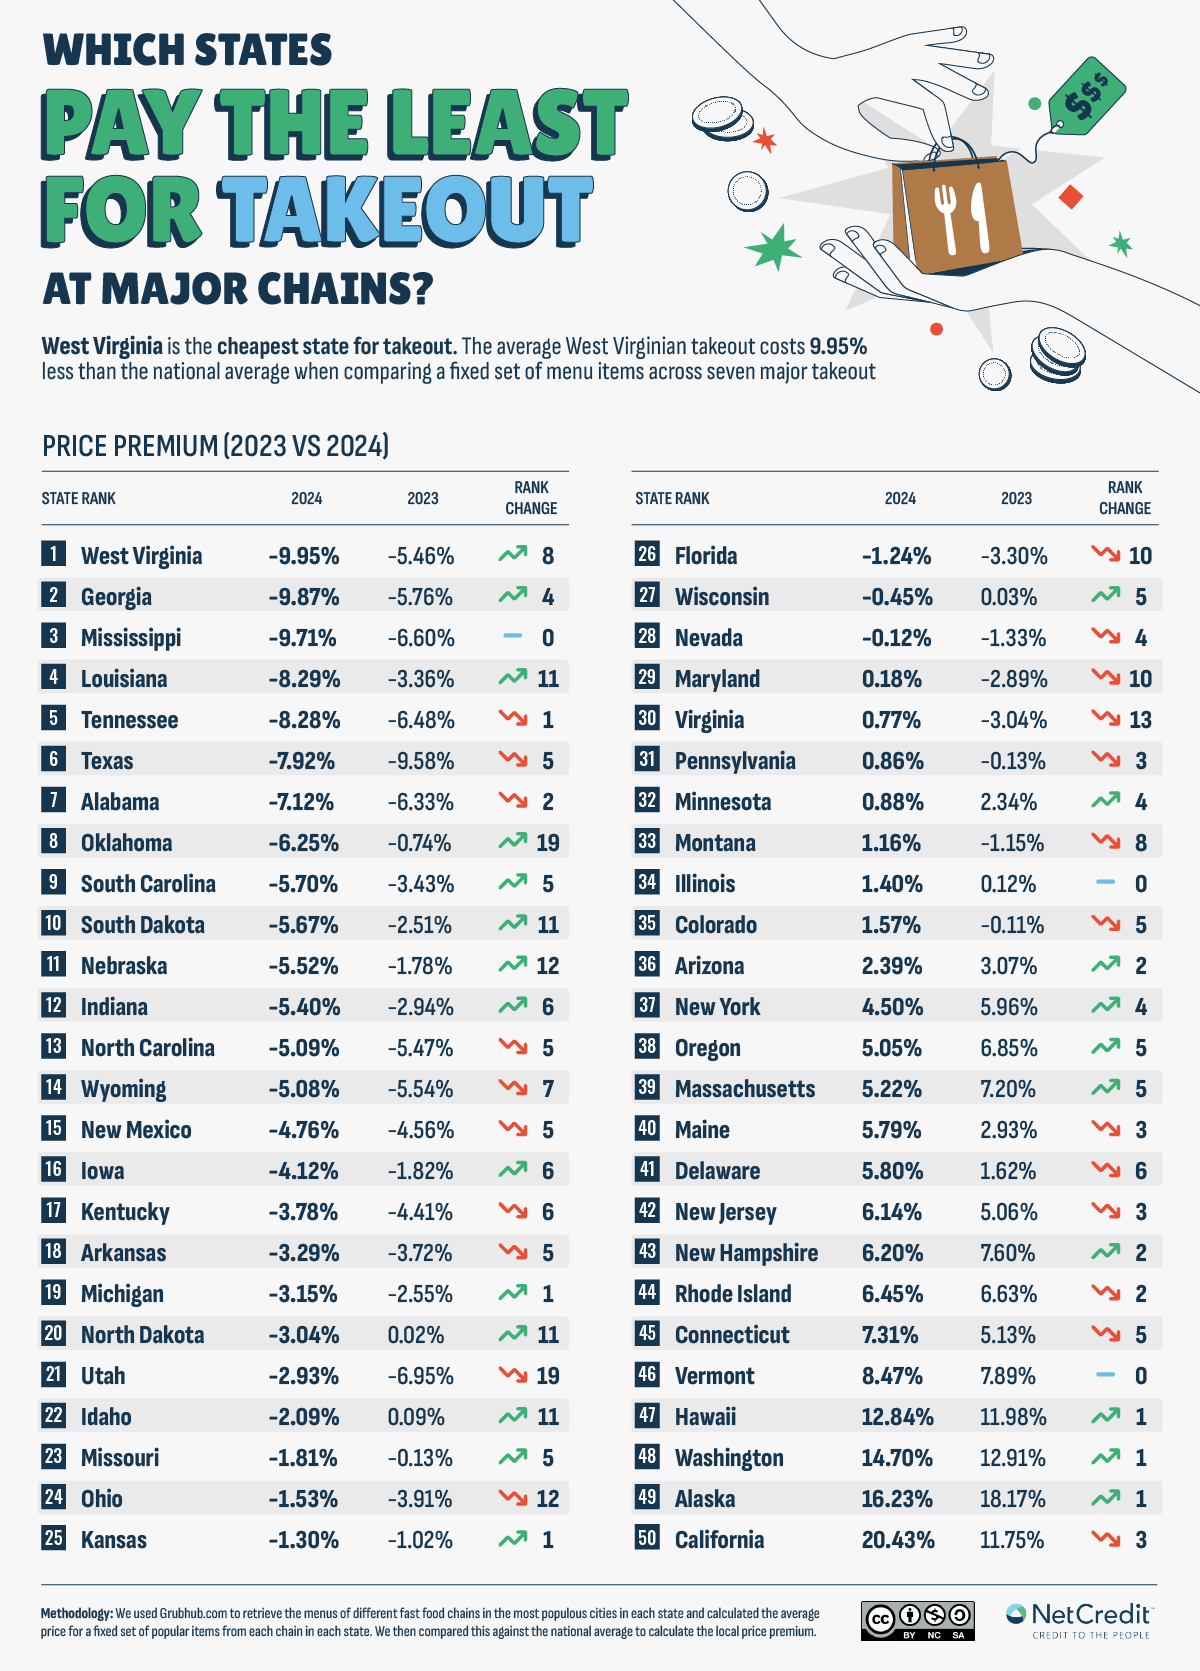
A study from NetCredit breaks down where Americans are paying the most (and least) for their favorite takeout orders, from McDonald’s and Pizza Hut to Taco Bell and Popeyes.
The research team analyzed menu data from major chains across every U.S. state and major city – comparing local prices to the national average and to their previous findings two years ago.
Here’s a preview of the states and cities with the most and least expensive takeout:
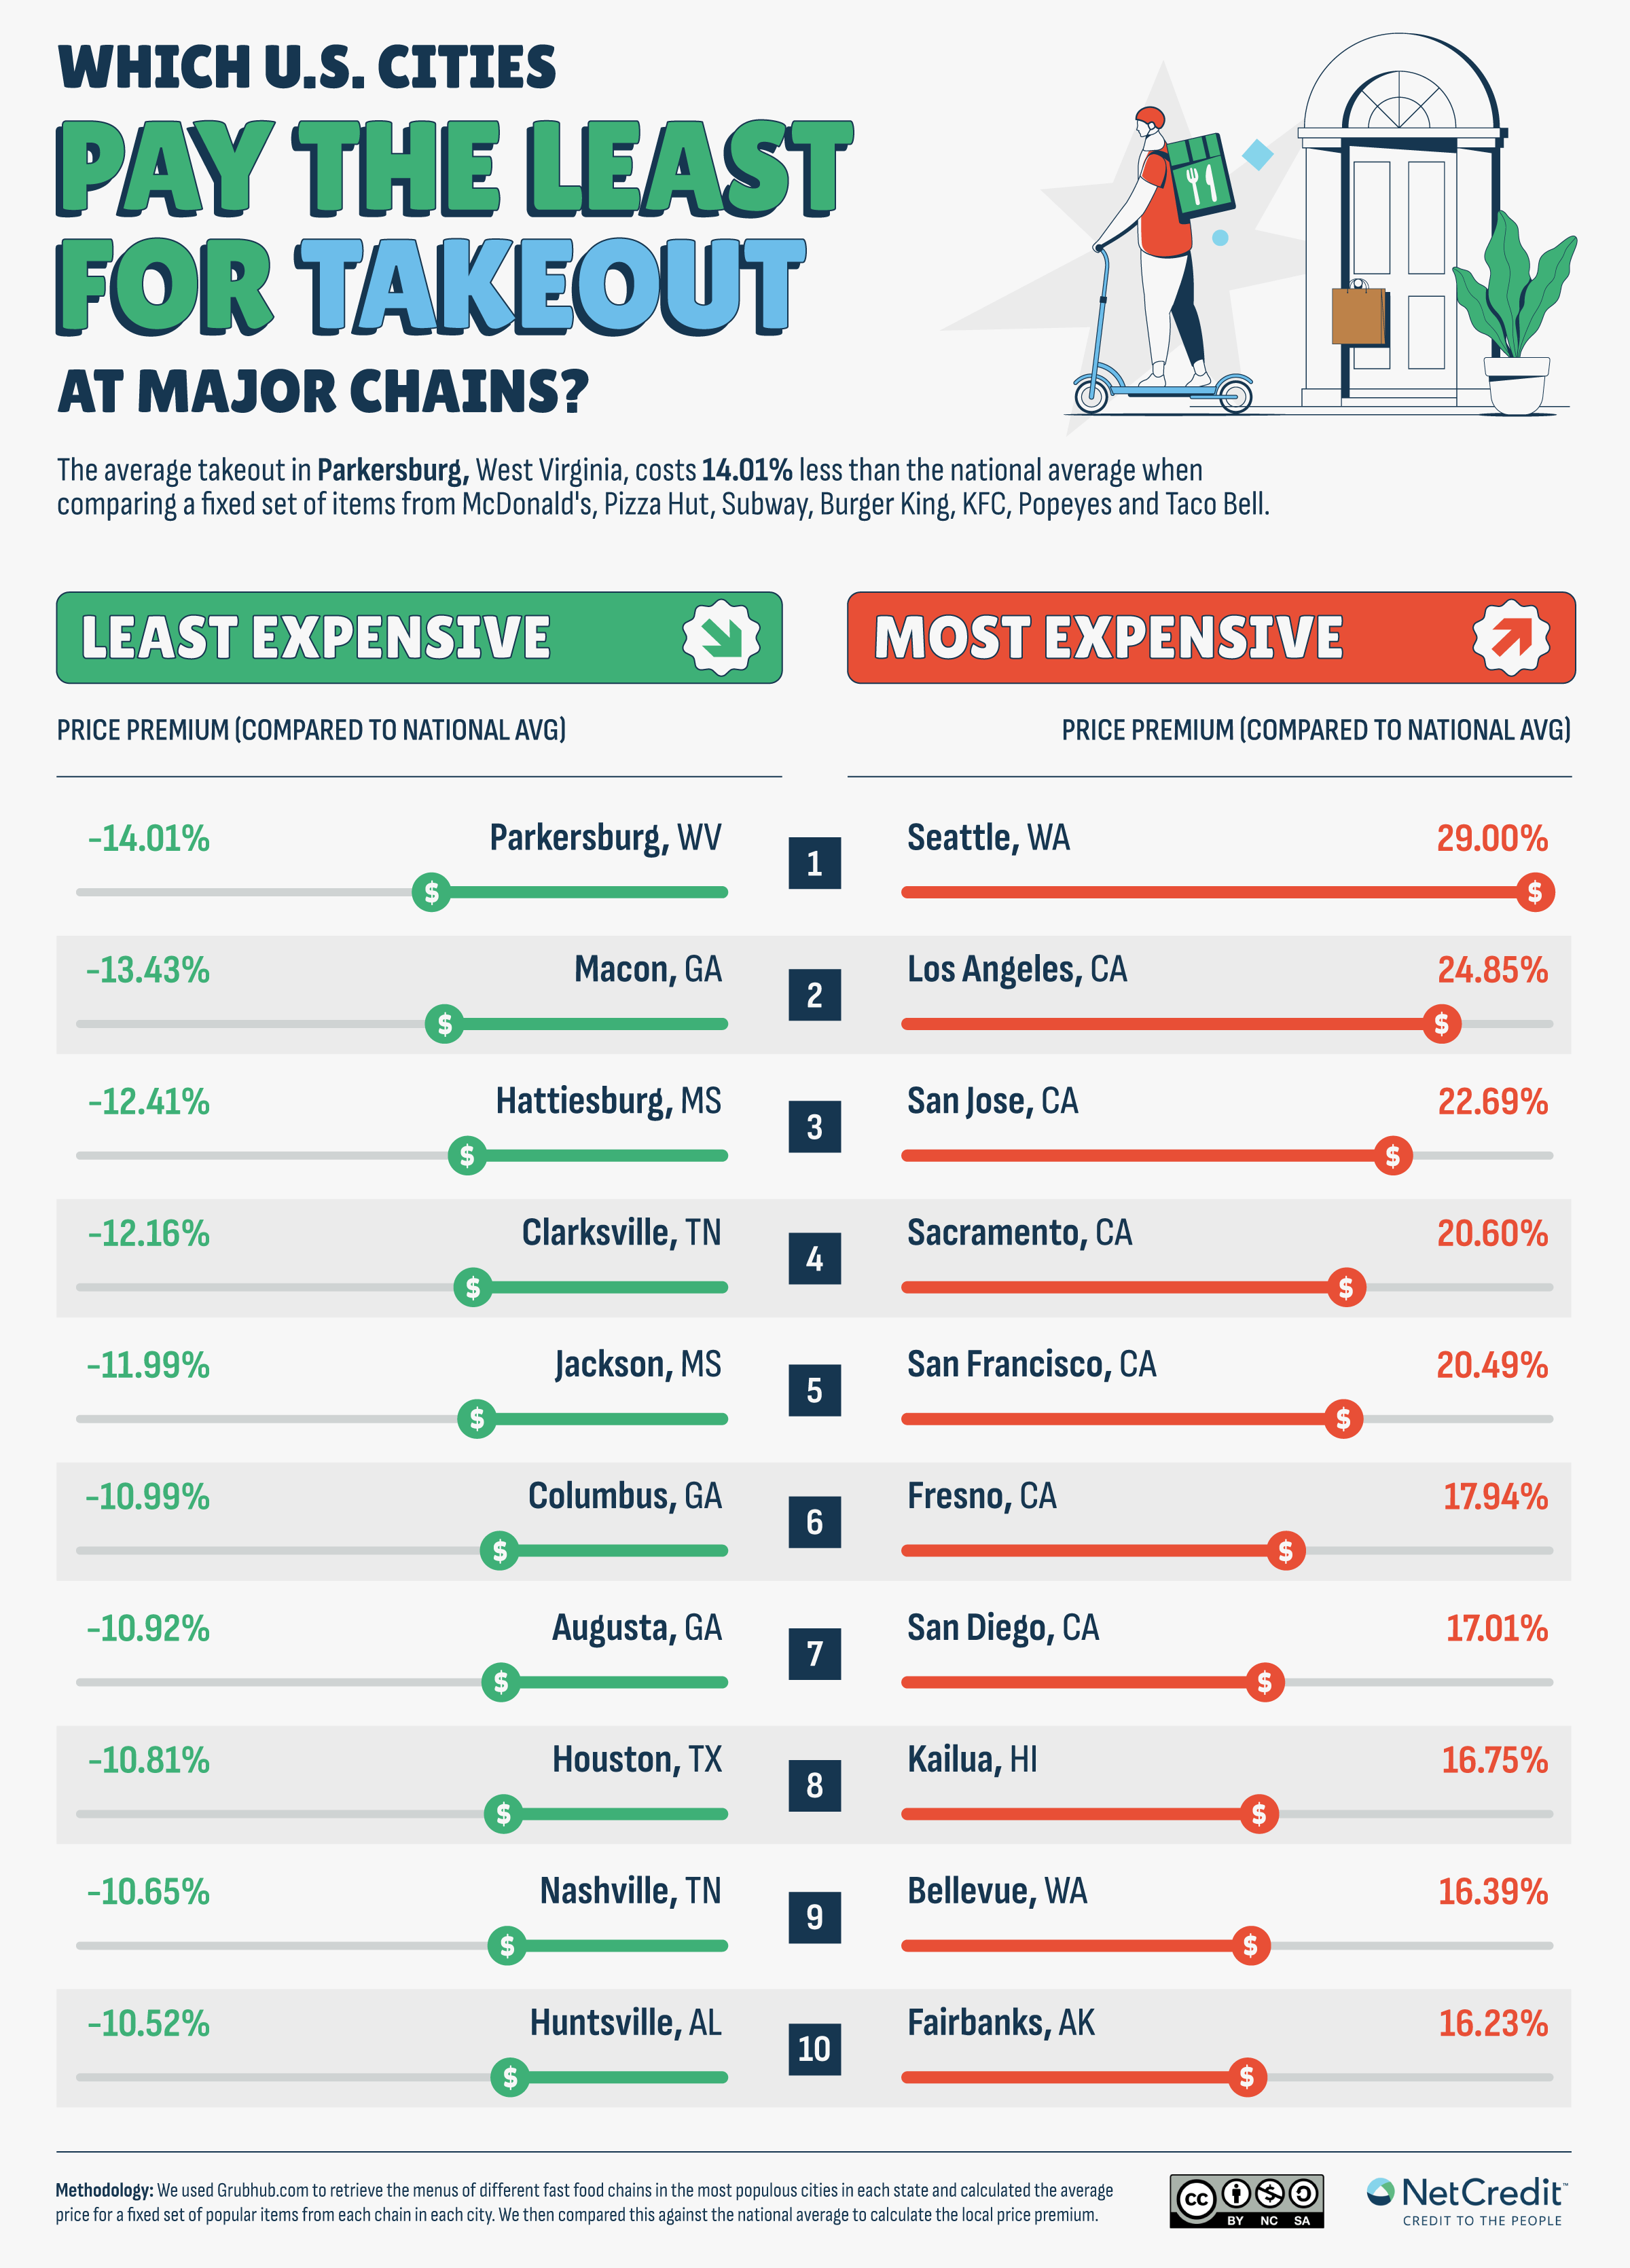
The wider study includes state- and city-level rankings for six of America’s favorite takeout restaurants: McDonald's, Pizza Hut, KFC, Burger King, Popeyes, Subway and Taco Bell.
Key findings from the study:
-
West Virginia has risen from eighth place to become the state with the cheapest takeout — with prices 9.95 percent below the national average.=
-
Seattle is the most expensive city for takeout, costing 29.00 percent above the national average.
-
McDonald’s is cheapest in Wyoming, where it costs 19.54 percent below the national average.
-
Pizza Hut in South Carolina is around 25 percent cheaper than in Maine, Utah or Hawaii.
-
The most expensive states for KFC are California (20.64 percent above national average), Alaska (+19.26 percent) and Washington (+18.42 percent).
Food Price Monitor and Drinksgiving Data
Toast released its October Menu Price Monitor, which provides a granular view of how inflation is truly impacting restaurant menus, including real-time data on price changes for popular items like burgers, chicken wings, and coffee. At a glance, prices have increased across the board in comparison to September 2025 (MoM) and October 2024 (YoY):
🍔Burger Prices Rise Again: The median price of a burger in October was $14.53, rising 0.3 percent from September 2025.
Year-over-year, prices are up 3.2 percent since October 2024.
🧊Cold Brew Continues Its Climb: The median price of cold brew in October was $5.53, rising 0.7 percent since September 2025.
Year-over-year, prices are up 4.7 percent since October 2024.
☕️Regular Coffee Also Rose: The median price of regular coffee in October was $3.57, up 0.8 percent since September 2025
Year-over-year, prices are up 3.2 percent since October 2024.
Burrito Prices Are Still Rising: The median price of a burrito in October was $13.43, rising 0.5 percent since September 2025.
Year-over-year, prices are up 3.3 percent since October 2024.
🍻Beer Prices Bubble Up: The median price of a beer in October was $6.50, remaining unchanged since September 2025.
Year-over-year, prices are up 2.5 percent since October 2024.
🍗Chicken Wings Dip: The median price of wings in October was $13.72, dropping 0.4 percent since September 2025.
Year-over-year, prices are up 1.9 percent since October 2024.
Additionally fresh data from Toast proves it’s less about holiday prep and more about celebration.
🍺The Drinksgiving Phenomenon: The tradition of meeting old friends is fueling a spending frenzy: Overall alcohol sales surged 79 percent. The unexpected superstar? Hard seltzers, which skyrocketed 256 percent compared to a typical Wednesday.
🥧The Pie Pickup Effect: Americans are prioritizing convenience over cooking: Sales of pies soared 283 percent, underscoring a huge demand for holiday catering and pre-order pickups, with overall catering sales up 33 percent.
💰Major Transaction Boom: Restaurants and bars saw transactions climb 17 percent and average check size increase 10 percent, leading to a substantial 29 percent jump in average GMV.
📍Regional Hotspots: Which states partied the hardest? Delaware, Kentucky, and Connecticut led the country with the highest average transactions per restaurant location, offering a great regional angle for local coverage.
Holiday Party Trends
With employee attendance and budgets trending up, the workplace holiday party is back, according to the second annual 2025 Workplace Holiday Party Trends Report released by ezCater. The report reveals that 82 percent of employees plan to attend their company's holiday celebration this year—an uptick from 70 percent attendance reported last year. To support this growing enthusiasm, more than half of businesses (51 percent) are increasing their party budgets.
ezCater’s report is based on a national survey of over 1,000 full-time employees and over 600 workplace party planners, and uncovers evolving attitudes toward workplace holiday parties and plans for the 2025 office holiday party season.
Key findings include:
-
Holiday parties are a critical tool for team bonding: 80 percent of employees say these events are more important than ever for building team connections, given today’s hybrid and remote work models. 83 percent confirm that holiday celebrations help them bond with coworkers.
-
Food is the secret to a successful party: An overwhelming 93 percent of planners agree that food is the top driver of social interaction at holiday events. 77 percent of employees say it’s what they look forward to most, and 50 percent report that food and drinks directly influence their decision to attend.
-
Employees want a casual celebration, during working hours: 62 percent of employees prefer a casual dress code, and 53 percent want the event held during the workday.
-
Gen Z feels the most social jitters: Planners should prioritize creating a comfortable environment for their youngest employees, who are 42 percent more likely than other generations to feel stressed about attending a work holiday party. They are also 60 percent more likely to worry about standing alone, and 15 percent more likely to be concerned about finding food they will enjoy.
Smarter Dining in 2026
OpenTable unveiled its year-end report and dining forecast. Pulling from millions of reservations, 2M+ diner reviews, and nationally weighted consumer research, it paints a picture of how Americans will dine in 2026.
Americans aren’t dining out less, they’re dining out smarter. The data points to a shift toward intentional, social, and thoughtfully curated experiences. Some of the most important insights include:
-
Dining is up 8 percent YoY, with people planning to eat out 10x/month next year.
-
Early dinners are surging (4–5pm reservations up 13 percent).
-
Group dining continues to grow, up 11 percent YoY. Yet 52 percent still prefer ordering individually vs. sharing dishes.
-
Experiential dining is taking off, up 46 percent (chef’s counters, pop-ups, collabs).
-
And 44 percent of diners plan to use AI to help choose restaurants — a major behavior shift.
Here's what to expect from this year's report:
The new meaning of value: Diners are looking for value where they can in 2026. In fact, 61 percent of Americans say dining out in 2026 will feel more like a special occasion than an everyday occurrence. This may be why "happy hour" dining between 4:00-4:59 pm is up 13 percent year over year, as a way to get more bang for their buck while gathering and savoring time together.
Millennials will be the nation's most frequent restaurant-goers in 2026: OpenTable's research reveals key shifts across demographics, among the findings: millennials plan to dine out 14 times per month on average, and lead the charge with 79 percent agreeing that a restaurant's "Instagram/TikTok-worthiness" is important when deciding where to dine.
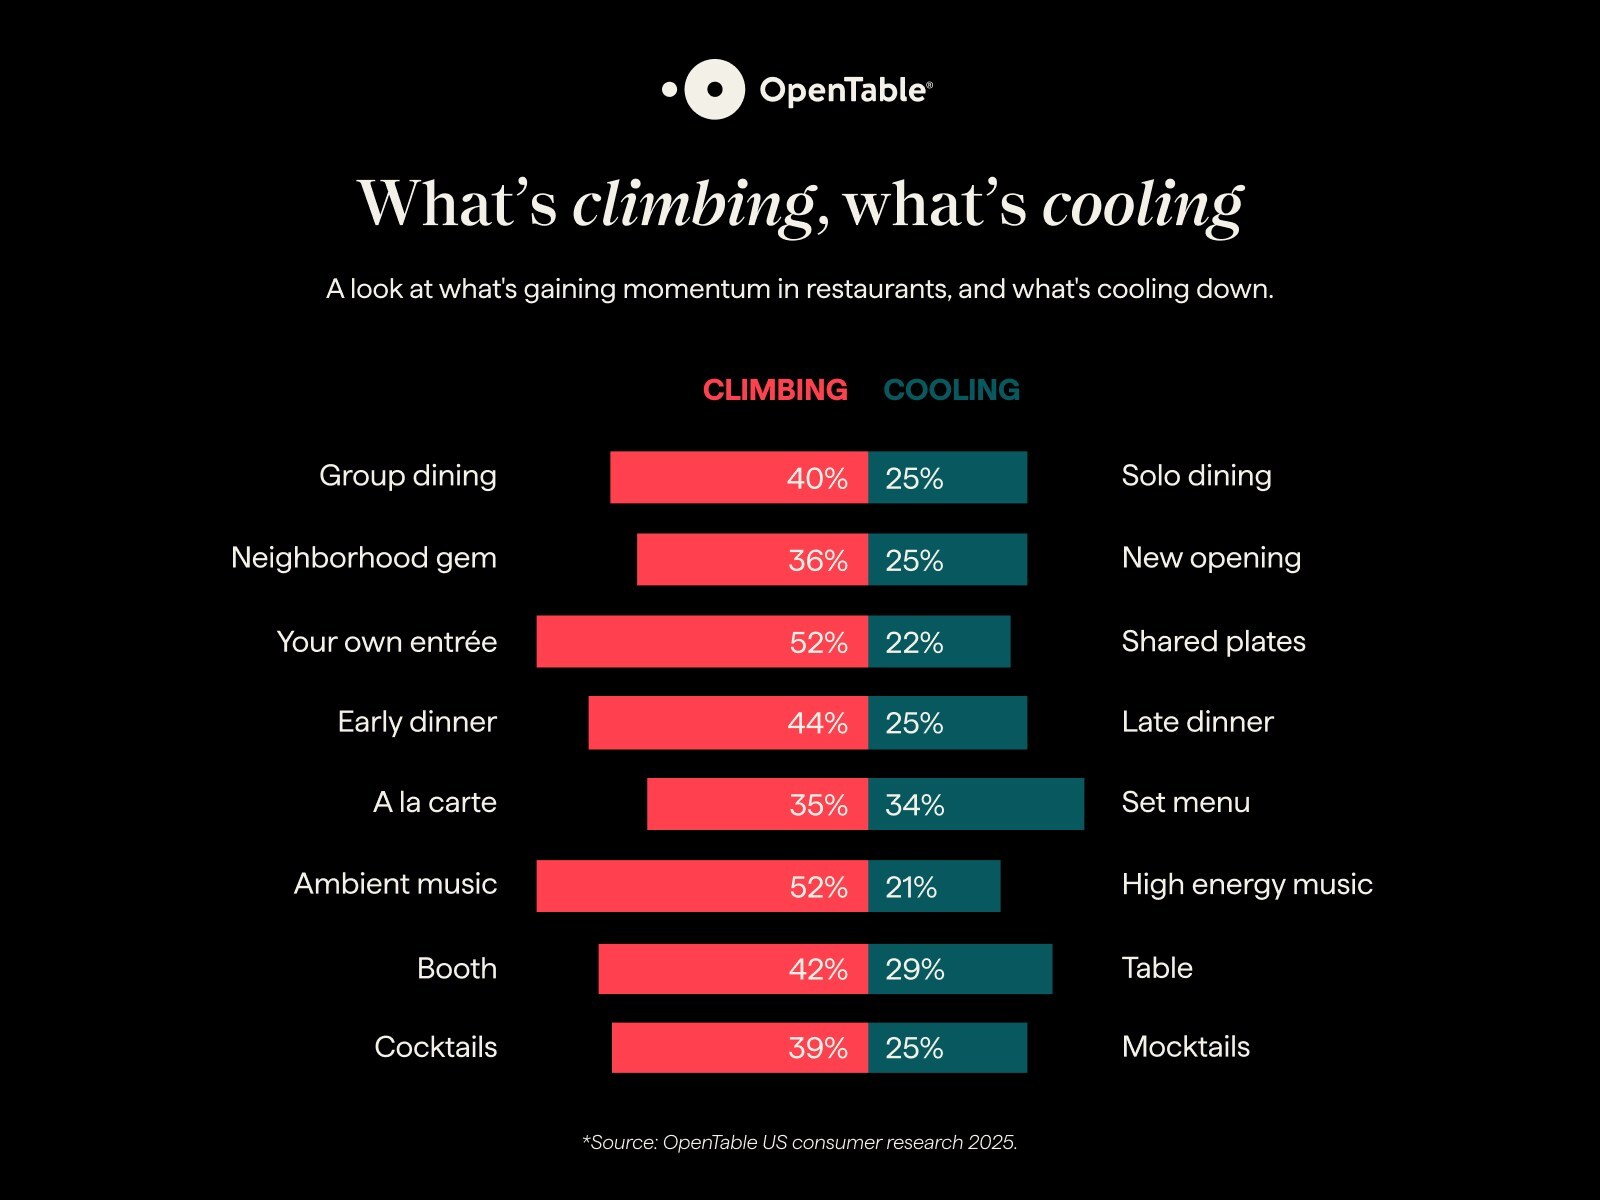
Sharing is out, but gathering is in: The shared-plates era is cooling off. More than half (52 percent) of Americans say they'd rather order their own dish in 20262 than share it with the table, but that doesn't mean group dining is on the outs. Group dining is up 11 percent year over year, and 40 percent say they'd rather eat with a group than solo.
Dining out as the main event: For today's diner, great food is just the beginning. Experiential dining is up 46 percent year over year, with restaurants offering 34 percent more pop-ups, collaborations, and chef's tables than before. Nearly half (48 percent) of Americans are more likely to book a restaurant when there's something unique to experience and many are seeking that magic close to home, with 36 percent preferring neighborhood gems over the latest openings in 2026.
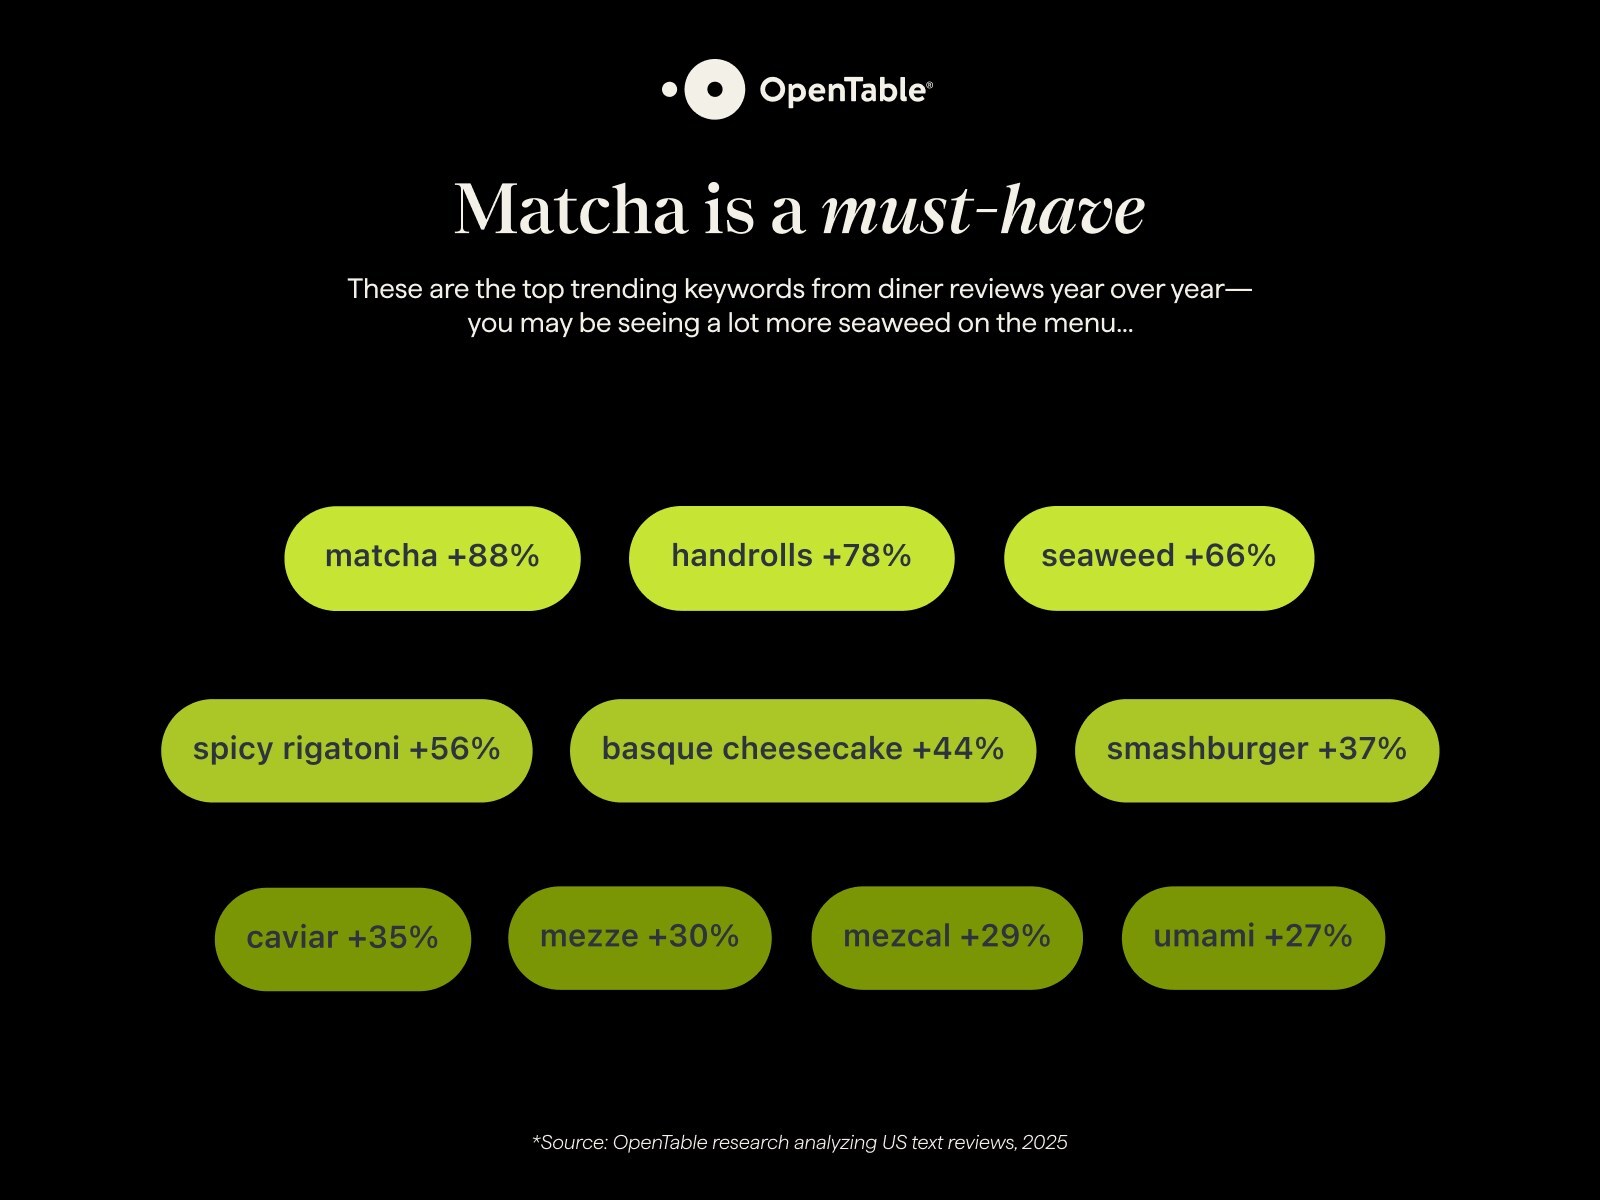
What's on the menu: An analysis of more than two million US diner reviews revealed this year's most buzzed-about ingredients and dishes, all seeing year-over-year increases in mentions: matcha (+88 percent), hand rolls (+78 percent), seaweed (+66 percent), spicy rigatoni (+56 percent), and Basque cheesecake (+44 percent).3 While these trending dishes could be an indicator of what to expect in 2026, OpenTable's consumer research also reveals classics like chicken pot pie, meatloaf and shrimp cocktail as the top nostalgic dishes Americans want to see in 2026.
Chat, help me find a restaurant: Research reveals 44 percent of Americans plan to use AI more to discover restaurants and book reservations in 2026.
Starbucks’ Foot Traffic
Foot traffic on Red Cup Day (Thursday, Nov. 13) was up 44.5 percent compared to the daily average between January 1 and November 14 this year, according to Placer.ai.
-
Red Cup Day even beat the popular “Bearista” promotion earlier this month
-
It was also the strongest Red Cup Day in company history, according to Starbucks CEO Brian Niccol, a possible indication that Starbucks will “ground” down its competitors this holiday season.
Starbucks found a new way to get customers in the door: Bears. Well, the “Bearista,” specifically.
The coffee chain’s new Bearista Cold Cup was a hit with consumers, according to a Placer.ai report, and when it launched on Thursday, Nov. 6, Starbucks saw a nearly 38 percent increase in visits compared to its 12-month daily average. And traffic has remained high since, Placer.ai data shows.
The Bearista is one of several promotional strategies Starbucks uses to drive traffic, including the annual launch of the Pumpkin Spice Latte, or PSL, which led to a 17 percent increase in visits on its launch day this year, and the upcoming Red Cup Day on Thursday, Nov. 13.
The last sip: Starbucks has stumbled upon another effective promotion, perhaps even rivaling the annual PSL launch. “Not everything needs to be free or deeply discounted to draw major crowds,” the report reads. “The Bearista proved that creativity and emotion can rival even the most generous giveaways.”
The Promise of AI
Paytronix, tzeroed in on the recently published Access Group report AI and Integrated Systems in the Hospitality Sector, which finds that 48 percent of American food and beverage respondents expect AI to be used to improve efficiency in the future.
Artificial Intelligence – specifically understanding how brands are using it today, and what they expect from it – was emphasized heavily at the start of the survey. Across the board, responders looked positively towards AI’s future, while predicting a lot of room for growth in how they use AI, and where suppliers can provide extra value. In fact, 37 percent of respondents replied that they are actively rolling out AI across multiple departments of their business. Alternatively, a combined 47 percent of brands said that they either had early interest in AI and were just starting to explore the technology or haven’t implemented anything yet. When Access asked these brands what they want from AI technology, 32 percent expect it to improve customer experiences and service quality, while 29 percent want better decision making through improved insights. Looking forward, while much of the industry has yet to commit to AI, brands still expect AI to help improve efficiency across the board and to help with reporting and routine tasks.
Current Technology Systems
Only 35 percent of brands believe they are currently using technology fairly well, while another 30 percent feel there is room for improvement in their own operations. Specifically, they identified the following challenges.
Training Staff – 21 percent said constant training is required due to high staff turnover, and 17 percent said there is not enough time to properly train everyone. All told, 55 percent said that staff and operational efficiency present a moderate to significant challenge for their business.
Forecasting – More than half (51 percent) of brands said that forecasting and revenue optimization is a moderate or significant challenge for their business. When allowed to select multiple options, respondents said that forecasting guest demand and predicting traffic were the two hardest challenges to get right, 52 percent and 49 percent respectively.
Getting it Right – Only 24 percent of businesses said that they have a provider to help with their business intelligence reporting, and 40 percent said they have a CRM tool, while 34 percent said they have a guest experience and communication management provider, and another 38 percent said they have loyalty program management.
Moving to Consolidated Systems
Brands were also asked about their level of system integration. That is, how they manage a web of disconnected systems; each operating in silos. This fragmentation creates inefficiencies, inflates costs, and undermines data confidence.
The report finds that 46 percent of U.S. respondents use two to four different software systems to run their business. When asked how long they spend managing fragmented systems, managers at these brands said they spend, on average, one to two hours each day switching between different systems or manually combining data. A combined 67 percent of responders said that consolidated data would definitely help their business (37 percent) or be a total game-changer (30 percent) for how they run their business.
Still, concerns remain around the commitment around using a consolidated technology system:
-
14 percent cited the cost and time investment required;
-
15 percent pointed to getting staff comfortable with new ways of working;
-
15 percent mentioned finding a solution that actually does everything they need;
-
14 percent worried that if one part of the system went down, everything could be affected.
Looking forward, the report presents a clear image that there are massive opportunities for U.S. food and beverage brands to optimize their tech stack and become more efficient via AI. At the same time, although there are concerns about systems consolidation, it’s clear that it would dramatically improve operations and help improve their data gathering and analysis that, in turn, power AI.
What Do Diners Think of AI?
New data out from HungerRush reveals how consumers really feel about artificial intelligence in their dining experiences: they want it to enhance, not replace, hospitality.
According to the survey, 77 percent of diners would use AI to improve their dining experience, but 87 percent say connecting with restaurant staff remains critical to a positive experience. The data shows consumers are increasingly open to AI-driven ordering, recommendations, and loyalty programs – but still draw the line when it comes to human touchpoints like greeting guests or handling special requests.
Additional insights:
-
52 percent have already used AI tools like chatbots or smart recommendations while ordering.
-
64 percent say they’d be more likely to join a loyalty program if AI helped personalize rewards.
-
Nearly half want AI to shorten wait times and improve order accuracy.
-
But 63 percent worry about losing human interaction.
AI in F&B
As artificial intelligence becomes deeply embedded across global supply chains, the food and beverage industry is emerging as one of the most transformative sectors. The global AI in food & beverage market is projected to grow from $10.8 billion in 2024 to $50.6 billion by the end of 2030, at a CAGR of 29.6 percent during the forecast period.
According to the report, rising demand for food safety, operational efficiency, and real-time quality monitoring is fueling AI adoption in the food and beverage industry. As North America leads in early adoption and Asia-Pacific gains traction, financial investment and scalable AI platforms will be critical to unlocking regional growth and technology diffusion.
Market Insights and Investment Trends Driving Expansion
AI is no longer viewed as an experimental technology in food and beverage, it’s now an investment imperative. Startups and established players alike are capturing investor interest through smart automation, predictive analytics, and dynamic pricing solutions.
Investors are channeling capital into computer vision, robotics, and NLP tools that enable precision sorting, contamination detection, and real-time data analytics across production lines. Strategic funding rounds and joint ventures are expanding AI’s reach from large processors to small-scale food retailers, aligning financial growth with operational innovation.
Global food manufacturers are rethinking their long-term investment strategies, integrating AI into production planning, demand forecasting, and personalized nutrition product development. Financial stakeholders are focusing on high-growth application areas such as food safety and quality control. Companies are also using AI to improve marketing intelligence and consumer behavior analytics, unlocking new ROI streams through personalization and targeted promotions.
Venture capital firms and institutional investors are increasingly emphasizing AI solutions that support ESG objectives. These include reducing food waste, optimizing energy consumption in packaging, and improving transparency in sourcing. Financial alignment with sustainability goals is creating new valuation metrics for tech providers serving the food and beverage space.
What’s Hot Forecast
The National Restaurant Association released its 2026 What’s Hot Culinary Forecast, highlighting the trends set to shape America’s menus in the coming year. The report, based on insights from hundreds of culinary professionals surveyed in October 2025, reveals that nostalgia, comfort and “flavor escapism” are defining consumer desires in 2026.
From smash burgers and Caribbean curry bowls to protein-packed meals and low-alcohol drinks, this year’s report shows that diners are craving fusions of past trends and modern flavors. Familiar favorites are being reimagined with global influences, while wellness and affordability remain top of mind for consumers.
Drawing on insights from chefs and culinary professionals nationwide, the report highlights how consumers are looking for food that feels good emotionally and financially. In response, restaurants are crafting dishes that deliver comfort and creativity without sacrificing value.
Top 10 Overall Trends for 2026
1. Local sourcing – Restaurants are deepening community ties by featuring ingredients from nearby farms and producers, emphasizing freshness, and sustainability.
2. Comfort foods – Familiar classics like soups, stews and burgers offer diners a sense of nostalgia and emotional connection.
3. Value menus and options – Operators are balancing creativity and cost by delivering satisfying meals that remain affordable for price-conscious diners.
4. Smash burgers – Blending retro appeal with customizable, high-flavor twists; this diner staple has reemerged as a social-media favorite.
5. Clear menu labeling, icons, and cues – Simple visual indicators help diners make quick, informed choices about ingredients, calories and sustainability.
6. Allergen-friendly menus – Restaurants are expanding inclusive options for guests with dietary restrictions, from gluten-free items to nut- and dairy-free dishes.
7. Global comfort foods – Chefs are reinterpreting homestyle dishes from around the world, blending authenticity with local influence.
8. “Cleaner” recipes with fewer additives and dyes – Consumers are prioritizing ingredient transparency, inspiring operators to include simpler, less-processed options.
9. Proteins as add-ons – From smoothie bowls to pancakes, protein is becoming a customizable boost for both taste and nutrition.
10. Compostable and reusable packaging – Eco-friendly materials are replacing single-use plastics as restaurants reduce waste and improve sustainability.
At the macro level, comfort and value remain the ultimate crowd-pleasers, and operators are finding new ways to deliver both through inventive sourcing, menu simplification, and community-minded offerings. These shifts signal a restaurant landscape defined by balance and one that pairs creativity with practicality and ensures that every innovation connects meaningfully with what guests care about most.
The What’s Hot Culinary Forecast is based on a survey of hundreds of culinary professionals conducted in October 2025. Respondents identified leading trends in dishes, beverages, desserts, ingredients, and macro themes for the coming year.
Views on Gene-Edited Food
Research from The Center for Food Integrity (CFI), and FMI – The Food Industry Association, provides details on how consumers perceive gene editing in food and agriculture and what drives their willingness to buy.
The research, “Consumer Acceptance of Gene-Edited Foods,” found that consumers are significantly more open to gene-edited products when the benefits are clear, personal and values-based. When informed about the purpose and process of gene editing purchase intent rose across all categories tested: pork, eggs, tomatoes and bananas.
Key findings:
-
Context drives comfort. When gene editing was introduced clearly and transparently, acceptance increased across the board, with pork and tomatoes performing above benchmark norms for purchase likelihood.
-
Believability rises with benefits.
-
Pork: Strongest acceptance is driven by reduced antibiotic use and healthier animals.
-
Eggs: Consumers valued stable prices and reliable supply amid disease outbreaks.
-
Tomatoes: Highest perceived value is tied to health benefits like maintaining healthy blood pressure.
-
Bananas: Reduced food waste and longer shelf life resonate as practical, planet-friendly benefits.
-
-
Trust requires transparency. More than 70 percent of consumers said they were satisfied with the information provided, which included benefits and the use of gene editing.
-
Safety signals. Across all products, FDA approval provided important reassurance, confirming the product is safe and effective.
-
Healthy and mainstream consumers both showed high levels of acceptance. Both groups showed openness to gene-edited foods that clearly aligned with their priorities: improved health, reduced waste and animal well-being.
The study, conducted by Circana, surveyed U.S. consumers ages 18–70 through an online predictive research platform that assessed purchase likelihood, believability and willingness to pay. Data was collected in August 2025 from consumers of pork, eggs, tomatoes and bananas.