MRM Research Roundup: QSR Reputations, Menu Price Rises, and Alcohol Out, Cannabis In
16 Min Read By MRM Staff
This edition of Modern Restaurant Management (MRM) magazine's Research Roundup features across-the-board price increases, QSR reputation rankings, holiday season outlook, and chef salaries.
Foodservice Resilience
The U.S. foodservice industry continues to show resilience despite economic challenges and evolving consumer preferences. According to the latest Foodservice Market Sizing report from Circana LLC, foodservice operator spend reached $357.3 billion for the 12 months ending in June 2025, marking a 3.7 percent increase over the prior year. This growth was primarily driven by shifting consumer habits, with commercial foodservice playing a significant role in the industry’s expansion. Circana projects this figure will climb to $385 billion by June 2028, representing a compound annual growth rate (CAGR) of 2.5 percent.
The analysis reveals a 0.9 percent increase in foodservice cases over the past year, with a projected CAGR of 0.8 percent through 2028. Non-commercial foodservice segments — such as Business and Industry, Education, and Healthcare — are set to experience robust growth during this period. Meanwhile, large-chain quick-service restaurants and independent establishments are expected to drive the most incremental dollar growth. Regionally, the Northeast — the smallest market in share of operator spend — is outpacing other areas in growth due to its delayed recovery from the pandemic. From 2025 to 2028, the region is forecasted to achieve a nearly four percent CAGR in spend, driven by expansion across both commercial and non-commercial foodservice sectors.
While total industry traffic has stabilized, indicating that “flat is the new normal,” specific pockets of the market are outperforming. Economic pressures, such as inflation and a slowing job market, have led to consumer uncertainty and a general decline in sentiment. This is causing consumers to be more selective with their dining-out dollars, often prioritizing essential purchases. However, this cautious spending behavior creates opportunities for operators that can deliver on specific consumer demands.
Circana’s analysis reveals several key growth drivers. Increased consumer mobility, largely due to return-to-office mandates, is creating more occasions for the foodservice industry. The fast-casual and large-chain full-service restaurant segments are benefiting as they align with consumer demand for quality, variety and a reasonable price. Furthermore, experiential dining is becoming a powerful differentiator as consumers seek more than just a meal when they choose to dine out.
QSR Reputation Rankings
Chatmeter released its 2025 QSR Reputation Ranking, ranking the best 10 quick-serve restaurants (QSRs) based on customer reviews of food quality, service and value.
This year, Hardee’s took the top spot, edging last year’s winner, Chick-fil-A, into second place. Firehouse Subs rounded out the top three. Chick-fil-A retained the top slot for Customer Service, while Little Caesars was top-ranked in Value and Hardee’s was number one in Food Quality.
-
Customer Service Continues to Slide – The percentage of reviews mentioning customer service increased 17 percent year-over-year and sentiment declined by 1.5 percent, with customers complaining about rude service, long wait times, incorrect orders and negative staff interactions.
-
Menu Items Don’t Live Up to the Hype – Food quality was mentioned 11 percent more frequently as discussions of price declined. While consumers continue to prioritize value, they ultimately want food that feels “worth it,” and QSRs did not deliver, with sentiment around food quality declining 3.4 percent YoY.
-
Consumers Fed Up With “Sauce-Flation” – Sauces have grown in popularity among Gen Z and Millennial consumers who consider them an easy, low-cost way to personalize and improve menu items. But customers are frustrated by extra charges for sauce or not receiving enough sauce with their orders. Chains that offer free sauce saw sentiment improve, while those charging for or limiting sauces saw it decline.
The 10 Best QSRs for Reputation in 2025
-
Hardee’s
-
Chick-Fil-A
-
Firehouse Subs
-
Panda Express
-
Jersey Mike’s
-
Popeyes Louisiana Kitchen
-
Wingstop
-
Chipotle
-
Burger King
-
Domino’s
Chatmeter used Pulse Ai to analyze more than 300,000 reviews across 26 of the largest QSRs to determine the rankings and uncover key trends in customer feedback.
Toast's Menu Price Monitor
Prices have increased across the board since September 2024, according to Toast data.
🍔Burger Prices Hold Steady After Summer Spike:
The median price of a burger in September was $14.48, a slight 0.1 percent increase from August 2025 (following a 0.6 percent jump in August). Year-over-year, prices are up 3.1 percent since September 2024.
🧊Cold Brew Continues Its Climb:
The median price of cold brew in September was $5.49, rising 0.4 percent since August 2025. Year-over-year, prices are up 4.2 percent since September 2024.
☕️Regular Coffee Also Rose:
The median price of regular coffee in September was $3.54, up 0.6 percent since August 2025. Year-over-year, prices are up 2.6 percent since September 2024.
Burrito Prices Are Still Rising:
The median price of a burrito in September was $13.41, rising 0.1 percent since August 2025. Year-over-year, prices are up 3.2 percent since September 2024.
🍻Beer Is Flat in September:
The median price of a beer in September was $6.47, remaining unchanged since August 2025. Year-over-year, prices are up 2.2 percent since September 2024.
🍗Chicken Wings Dip:
The median price of wings in September was $13.78, dropping 0.1 percent since August 2025. Year-over-year, prices are up 2.4 percent since September 2024.
Holiday Outlook
While optimism remains high, businesses are strategically adapting to economic pressures and evolving consumer behaviors to maximize holiday sales, accoridng to Constant Contact's latest report on this year's Small Business Holiday Outlook. Constant Contact's survey included over 1,800 small business owners and over 2,400 consumers in the United States, United Kingdom, Australia and New Zealand.
The study highlights the immense importance of the holiday season, with a striking 60 percent of SMBs attributing up to half of their yearly sales to this crucial period. Q4 has long been known as a high stakes quarter. This year, Constant Contact found that 1 in 3 owners feel the highest revenue pressure of the year during Q4. This sentiment is particularly strong within the retail sector (47 percent), but despite these intense pressures, a resilient majority (77 percent) of SMB owners express confidence in meeting their revenue targets for the year.
Marketing efforts have intensified, with 60 percent of owners planning to increase their marketing communication frequency during this period. Notably, the U.S. saw a significant shift in strategic planning, with the number of businesses launching entirely new marketing campaigns quadrupling from 7 percent in 2024 to 33 percent in 2025, according to the report.
Social media marketing is perceived as the most impactful channel for holiday success by 40 percent of SMBs, significantly outpacing email marketing at 18 percent. Furthermore, discounts and sales remain the most effective promotional strategy, utilized by more than half (51 percent) of businesses offering promotions.
Last year's holiday marketing efforts proved successful for 81 percent of participating SMBs, primarily leading to increased sales and new customers.
However, SMBs are grappling with significant internal and external challenges:
-
Economic Headwinds: Primary external concerns are inflation/rising costs (32 percent) and weak customer spending (22 percent).
-
Operational Strain: Key internal challenges include customer engagement (39 percent), budget limitations (36 percent), and generating new ideas or content (34 percent).
-
Tariff Impact: 46 percent of businesses report being negatively impacted by recent tariff policies, leading many to cut expenses (46 percent) or raise prices (43 percent).
Consumers, too, are navigating economic concerns, which has led 70 percent of shoppers to actively seek deals and promotions. Despite these challenges, consumer loyalty to small businesses remains exceptionally strong, with 72 percent returning to the same ones each holiday season, and 88 percent likely to become repeat customers after a holiday purchase.
Balancing Operational Excellence with Experience Innovation
Agilysys, Inc. released the findings of its 2025 Foodservice Management Industry Impact Study: Balancing Operational Excellence with Experience Innovation. This survey of 412 foodservice executives and F&B technology decision-makers across four sectors — healthcare, higher education, active adult communities and full-service restaurants — unveils critical insights into “readiness to deliver” dining experiences aligned with consumer preferences and reveals significant operational and technology challenges that make doing so difficult.
The revenue potential of offering preference-driven dining rests on serving consumers’ expectations for personalized, seamless interactions across dining experiences – whether choosing a table-service restaurant, using self-service kiosks for orders and payments or taking advantage of ‘anytime, anywhere’ dining using mobile ordering and delivery services. Research shows that when consumers have preference-based dining choices they spend up to 50 percent more per transaction. While 68 percent of foodservice executives want to deliver preference-driven dining options, 50 percent say they need to upgrade their technology to do so and 60 percent cite budget or resource constraints as barriers to adopting modern technology.
Among the findings:
-
Critical “Aspiration-Readiness Gap”: While 68 percent of foodservice executives want to deliver preference-driven dining experiences, 50 percent feel they need technology infrastructure upgrades to do so.
-
Technology Transformation Considerations: To enable preference-driven dining, 49 percent of executives would consider switching POS providers and 40 percent are ready to do so.
-
Sector-Specific Priorities: Experience-focused sectors (restaurants and higher education) prioritize personalization as a competitive advantage, while necessity-focused sectors (healthcare and active adult communities) emphasize operational efficiency and cost management.
-
Operational Excellence Focus: 60 percent of leaders prioritize increasing operational efficiency and profitability over the next two years, with 76 percent focused on improving day-to-day operations and inventory management.
-
Implementation Concerns: 65 percent of foodservice leaders have delayed changing technology platforms due to concerns about implementation difficulty, while 61 percent cite upfront costs as a key barrier.
The 2025 Foodservice Management Industry Impact Study highlights the advantages of expanding traditional operational priorities to include Preference-Driven Dining Excellence – a customer-centric approach that balances operational efficiency with the ability to deliver personalized experiences. This framework equips foodservice providers to address customer preferences while also improving day-to-day operations and increasing revenue.
The study offers a framework for foodservice executives to bridge the readiness gap, optimize both operational efficiency and customer experiences, and stay competitive as consumer preferences evolve.
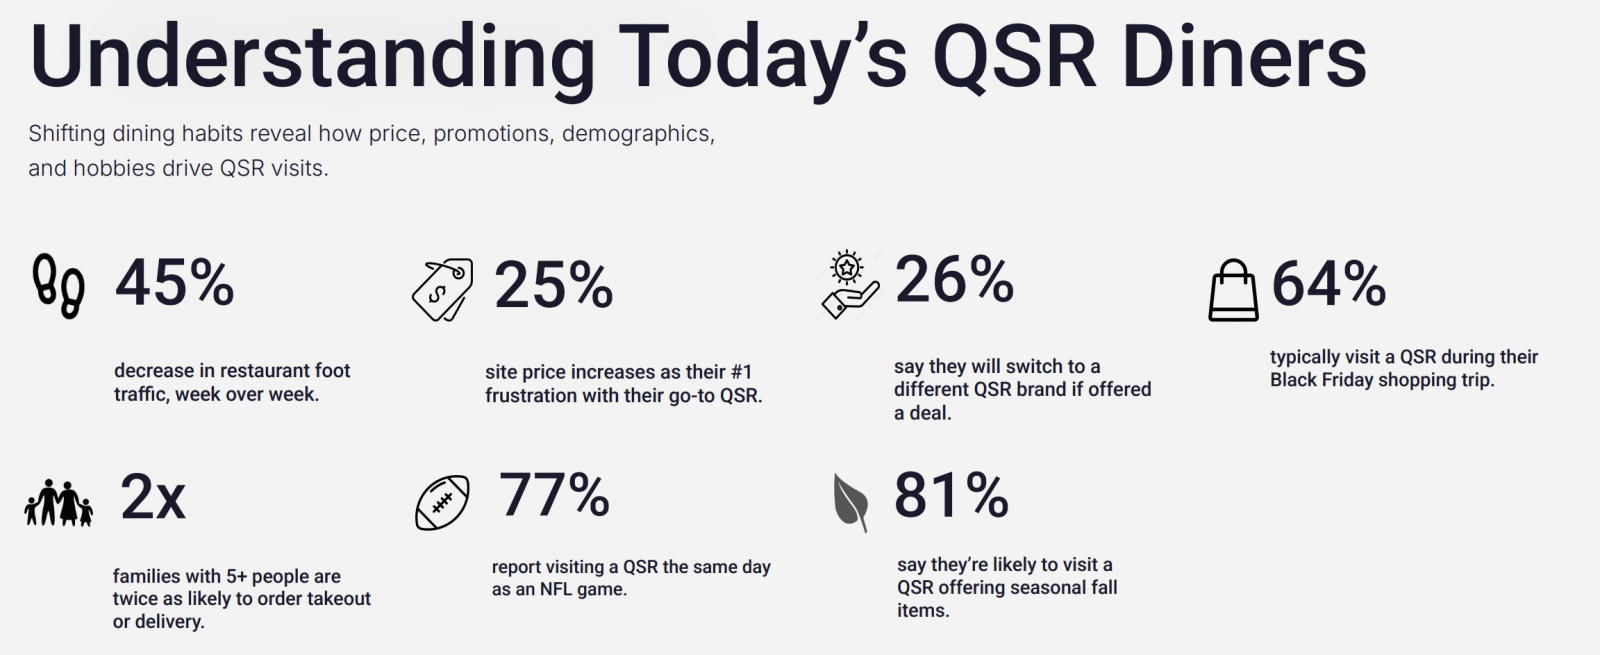
State of QSR
Azira’s State of QSR report showed consumers demonstrating a 45 percent week-over-week drop in QSR foot traffic, and 26 percent say they will switch to a different QSR brand if offered a deal, signaling affordability pressures and possible oversaturation across QSR chains. According to the report, 28 percent say value and price is the single most important factor when deciding which QSR to visit.

Why Dining Out For Thanksgiving Could Cost More This Year
Expert Market's Food & Beverage Report reveals a recent rise in restaurant menu prices, which could affect the cost of dining out for Thanksgiving –
-
62 percent of US restaurants have increased menu prices to offset wage increases
-
47 percent of US restaurants increased menu prices due to the effects of import tariffs
-
US food prices have risen 3.2 percent since last year (U.S. Bureau of Labor Statistics Consumer Price Index 2025)
Expert Market’s 2025 Food and Beverage Report , sponsored by Toast, has revealed a recent rise in menu prices among U.S. restaurant businesses.
For some consumers wanting to eat out this Thanksgiving, these cost increases might see them paying more for their meal this year.
What’s driving up the cost of dining out?
-
Wage increases
According to Expert Market’s survey, 62 percent of restaurants say they have had to raise menu prices to offset wage increases, which in turn could have a direct impact on the affordability of meals for customers.
Over half (57 percent) of US restaurants said that wages are having the highest economical impact on their business operations.
-
Tariffs
The report shows that 47 percent of US restaurants increased menu prices due to the effects of import tariffs.
US tariffs have also had an impact on ingredient prices and supply costs, with 41 percent of restaurants reporting this.
-
Rising ingredient costs
76 percent of US restaurants say rising ingredient costs are having a significant impact on profitability. Rising ingredient costs may also be caused by a combination of inflation and tariffs.
According to data from the U.S. Bureau of Labor Statistics, America has seen a 3.2 percent rise in food prices over the past year.
-
Rising utility costs
40 percent of surveyed restaurants said that the rising cost of utilities such as electricity, gas and water have also had a significant impact on their profitability.
The Entrepreneurial Cost
Launching a restaurant or hotel can be both thrilling and financially daunting. A new LendingTree analysis finds that entrepreneurs in the food and lodging space request an average of $185,679 to kick-start a business – $61,685 more than a typical loan request.
The research offers a picture of the price of entry into the hospitality world — and where the next wave of restaurant and hotel owners hope to plant their roots:
-
Entrepreneurial activity fuels loan demand — 36.2 percent of all inquiries come from people starting (25.7 percent) or buying (10.5 percent) a business.
-
71.0 percent of those entrepreneurs prefer to start from scratch rather than buy — but buyers request nearly double the amount ($287,656 vs. $144,075).
-
Boston leads for hospitality entrepreneurs, with average loan requests of $236,594, followed by Pittsburgh ($233,612) and Seattle ($229,029). Memphis ranks lowest at $111,648.
The Evolving State of Foodservice
The way foodservice operators discover, evaluate and purchase products has shifted dramatically in the last five years. Belle Communication’s report, The Evolving State of Foodservice + 2026 Marketing Playbook, explores these changes in depth, outlining the modern decision-making process and equipping suppliers with the marketing strategies they need to stay relevant.
The report draws on insights from a panel of award-winning and Food Network chefs, along with senior executives and thought leaders across the foodservice sector.
Panelists’ perspectives highlight the urgency for suppliers to expand beyond legacy sales tactics and embrace a new marketing playbook rooted in multichannel engagement, digital content, storytelling over specs, and chef partnerships.
Among the findings and insights:
-
Distributor dependency is risky: Distribution alone doesn’t guarantee sales. Generating operator pull-through is the real driver. When asked, 100 percent of chefs said they have requested specific products from distributors.
-
Chef partnerships deliver: Chef endorsements carry unparalleled influence and drive menu adoption among their peers. Finding more ways to collaborate with popular culinary personalities will be paramount for ongoing supplier success.
-
Social media shapes menus: Operator use of social media as a sourcing tool continues to rise year over year. Platforms like Instagram are directly impacting what shows up in kitchens.
-
Multichannel strategies win: From tradeshows and trade news to email and search-optimized content, suppliers must meet operators across multiple channels to stay competitive. The number of touchpoints continues to rise as buyers do more self-led research.
-
Direct connections with operators pay off: Targeting independent operators has become a profitable strategy, made possible by new segmentation tools and digital marketing tactics. Success hinges on hyper-personalization.
-
Human storytelling is key: Price and quality still top the operator’s priority list, but a supplier’s personality, impact and values matter too. Content and promotions should include people, not just product specs, to connect on an emotional level.
Top Pay for Chefs
A new article by Escoffier analyzed chef income across the US states to find out how geography shapes culinary salaries. The guide breaks down state and regional pay differences, cost-of-living impacts, based on U.S. Bureau of Labor Statistics data. It also offers data-backed career insights to help chefs make informed decisions about where to live and work.
Top 10 Highest-Paying States for Chefs
Hawaii tops the list with average chef salaries approaching six figures ($99.5K), thanks in part to its tourism-driven economy. Other strong performers like Rhode Island ($81.1K), Massachusetts ($77.1K), and the District of Columbia ($75.5K) benefit from dense urban dining ecosystems and institutional demand. These top-paying regions often benefit from strong economies, destination dining scenes, or a high concentration of luxury restaurants and resorts. But at the same time, the high wages frequently come with a high cost of living.
10 States with the Lowest Average Chef Pay
The lowest-paying states in the country range from Oklahoma and Iowa to Montana and Texas, with annual averages between $39,000 and $53,800. Several of these states also show very low job concentration (South Dakota at 0.31 and Idaho at 0.57 LQ), which indicates that chefs are underrepresented in the labor force. While this might suggest fewer opportunities, it can also signal an opening for experienced professionals to fill niche needs in healthcare, institutional kitchens, or emerging restaurant scenes, especially in underserved rural areas.
Cost of Living & Wage Adjustments
When evaluating chef salaries, the analysis took into account the cost of living index (COLI) as well as the real purchasing power of the salary. North Dakota and Rhode Island lead the list for the strongest COLI-adjusted chef salaries through the first quarter of 2025. The unadjusted average salary of $70.9K in North Dakota has a real purchasing power of $78.1K, because of the lower cost of living.
New Mexico and Illinois follow closely, turning their similar unadjusted salaries of $66.6K into $70.7K and $70.3K respectively. Even though Hawaii and Massachusetts boast high unadjusted salaries, their high costs of living significantly reduce take-home purchasing power. Rhode Island, by contrast, offers a better blend of strong wages and more manageable living expenses.
Unexpected High-Paying Regions
While luxury hotspots often dominate salary headlines, some of the highest-paying areas for chefs aren’t bustling cities; they’re remote or rural regions. From oil-rich North Dakota to scenic parts of Hawaii and Colorado, these nonmetropolitan areas reveal how regional demand, limited labor supply, or niche economies can drive up wages.
But before packing up for West Arkansas or West North Dakota, it’s important to consider job availability. Chef roles in these regions are relatively scarce. For example, chefs and head cooks account for just 0.62 jobs per 1,000 in West Arkansas, compared to 2.95 per 1,000 in Napa, where culinary demand is dense and sustained.
Underrated Cities with Strong Culinary Scenes
Not every chef needs to chase sky-high salaries in expensive metros to build a rewarding career. Some cities hit a sweet spot, offering solid wages, a lower cost of living, and a thriving culinary scene, including Nashville, Tennessee,with the average chef salary of $67.7K.
Raleigh, North Carolina, offers an average salary of $60.7K. The city’s cost of living is about 1 percent lower than Atlanta’s, meaning that salary stretches slightly further, about $61.5K in real spending power. Cleveland, Ohio, has a cost of living about 9 percent cheaper than Atlanta, and an average paycheck of $55.5K feels more like earning $60.6K in an average city.
The Shift Away from Alcohol
U.S. sales of beer, wine and spirits continue to fall as more Americans seek to moderate their alcohol consumption. The shift away from alcohol, driven largely by younger generations for health and economic reasons, has given rise to a rapidly growing market for non-alcoholic beer, wine and spirits beverages and an influx of new product offerings.
According to a report from CoBank’s Knowledge Exchange, non-alcoholic beverages have proven to be one of the more resilient segments of the beverage industry and the market shows strong growth potential. Rising sales have prompted traditional adult beverage manufacturers and new market entrants to sharpen their focus on non-alcoholic beer, wine and spirits and increase their investments in the category.
Declining alcohol consumption is not unique to the U.S. In 2024, global wine consumption fell to its lowest level since 1961, according to the International Organisation of Vine and Wine. In the U.S. alone, wine consumption fell by 5.8 percent in 2024. More broadly, volume sales across all alcoholic segments continued to erode in 2025, as noted in NielsenIQ's “The Halftime Report.”
Meanwhile, virtually all alcohol beverage categories have seen competitors enter the market offering low-alcohol or non-alcoholic beverages, with beer alternatives proving most successful. Non-alcoholic beer purchases among U.S. buying households increased 22 percent from December 2023 to November 2024, according to consumer research firm Circana. And while the market size of non-alcoholic wine may pale in comparison to other adult beverages, it registered a 41 percent increase in dollar sales in 2024.
Nearly half of Americans are trying to drink less alcohol in 2025, with the number markedly higher among younger generations. According to data from NCSolutions, the level of interest in sober-curious lifestyles has increased 44 percent in the last two years and a quarter of American adults report drinking no alcohol in 2024. Avoiding or limiting alcohol is not entirely borne of an interest in avoiding mood-altering beverages. Instead, consumers appear much more motivated by economic and wellness reasons.
Alcohol out, Cannabis in
While alcohol use continues to decline, cannabis consumption is rising and the market for cannabis-infused beverages shows significant potential. U.S. sales of cannabis beverages are projected to reach $2.8 billion by 2028. That remains small compared to the U.S. market for alcoholic beverages. However, growth rates for the two product categories differ considerably. Cannabis beverages have a projected compound annual growth rate of 16.9 percent through 2028, while at-home alcoholic beverages are expected to have a CAGR of 2.4 percent through 2030.
The drivers for cannabis drinks varies by generation. Millennials and Gen Z have led the trend, citing the options as a lower-calorie and “more-natural” alternative to alcohol, as well as the ability to consume cannabis in a format such as a seltzer or tonic. For older consumers seeking relaxation or a medical benefit, cannabis beverages offer an appealing alternative to more traditional consumption methods. But headwinds including a higher price point remain a challenge for cannabis-infused drinks.
How Online Reputation Wins Business in the Age of AI
Sogolytics released Beyond SEO: How Online Reputation Wins Business in the Age of AI, which explores how artificial intelligence is transforming the way consumers evaluate businesses and make purchasing decisions.
Based on a nationally representative sample of 1,198 U.S. adults, the report finds that more than half of consumers check reputation “often” or “always” before engaging with a new business. At the same time, the rise of AI-driven discovery tools is reshaping which voices and platforms consumers trust most.
Key findings include:
AI is gaining ground as a decision driver: One in five consumers regularly use ChatGPT, Google AI, or similar tools to research businesses, and 16 percent say AI recommendations most influence their final choices.
Google remains the top trust source — but not unchallenged: 71 percent check Google reviews before deciding, yet younger adults increasingly rely on TikTok, Instagram, and AI-based discovery channels.
Trust depends on authenticity: 38 percent of consumers question credibility when all reviews are positive, and 61 percent expect businesses to show proof of corrective action after a negative incident.
Visibility matters: 13 percent of consumers interpret the absence of a business from AI results as a sign it is “less established” or “less trustworthy.”
The study also highlights emerging risks for brands in the age of algorithmic memory. Negative viral stories, once fleeting, can persist indefinitely through AI summaries. Nearly three-quarters of consumers report that a viral negative post affects their trust at least somewhat, underscoring the long tail of reputational impact.
Youth Dining Patterns
Pion to offer some insights from their latest report, PION100, which surveys 2,000 US youth aged 16-24 (Gen Zalpha) to understand which brands they love and how they interact with them.
The data shows a clear pattern in youth dining: while Food & Drink is their single most loved spending category (65 percent enjoy spending on it), their loyalty is migrating toward brands that master value and convenience.
Top 10 Brands in Food & Beverage ( percent who ‘love’ or ‘like’)
-
Chick-Fil-A (88 percent)
-
Domino's Pizza (81 percent)
-
Subway (80 percent)
-
Panda Express (79 percent)
-
Pizza Hut (78 percent)
-
McDonald's (78 percent)
-
Dunkin' (74 percent)
-
Five Guys (73 percent)
-
Buffalo Wild Wings (71 percent)
-
Krispy Kreme (70 percent)
While the data confirms this generation loves food (65 percent enjoy spending on it), they also want it at the best value with half (48 percent) of Gen Zalpha searching for online discounts or deals when ordering food (higher than any other sector).
With 68 percent admitting they rarely go out socially to the likes of bars or restaurants, as well as 75 percent admitting to being money conscious, the brands topping the PION100 list are winning through offering the quick convenience Zalpha want, backed by a compelling deal.
Essentially, brands that prioritize digital ordering, customization, and swift delivery (ie Chick-fil-A, Domino's) outperform traditional sit-down concepts by making the experience painless, aligning with this generation's pragmatic and cautious spending habits.
BeerBoard's Q3 2025 On-Premise Insights Report
BeerBoard released its Q3 2025 On-Premise Insights Report, providing a look into alcohol performance across U.S. bars and restaurants based on its Alcohol Intelligence platform.
The analysis measures sales and volumes from July 1 to September 30, 2025, compared to the same period last year. BeerBoard manages more than $1 billion in on-premise alcohol sales annually, with an on-premise footprint that spans national chains, casual dining, sports bars, regional and independent concepts.
Key Takeaways
-
Draft beer volumes declined -1.8 percent YoY, while packaged beer products were down -5.1 percent in total units served.
-
Lager and Light Lager styles (domestic and import) continued to dominate both draft and packaged sales, while IPAs remained the #3 draft style poured.
-
Beyond Beer (RTD cocktails, Hard Seltzers) grew +23 percent in packaged volume share, and the rate of sale increased +9 percent. The style now holds a 10.2 percent share of all packaged products.
-
RTD cocktails claimed the 3rd-highest volume share in on-premise packaged and saw the strongest year-over-year growth.
Top Performers – Categories
Ranked by Volume Share
Draft Beer
-
Michelob Ultra
-
Miller Lite
-
Coors Light
-
Modelo Especial
-
Bud Light
Top Draft Gainers
-
Pacifico (+18 percent)
-
Coors Light (+15 percent)
-
Blue Moon Belgian White (+14 percent)
-
Busch Light (+8 percent)
-
Michelob Ultra (+5 percent)
Packaged Beer
-
Corona Extra
-
Michelob Ultra
-
Miller Lite
-
Modelo Especial
-
Coors Light
RTD Cocktails
-
High Noon Sun Sips Pineapple
-
Surfside Iced Tea & Lemonade + Vodka
-
Sun Cruiser Iced Tea & Vodka
-
Nutrl Vodka Seltzer Watermelon
-
High Noon Sun Sips Peach
Hard Seltzers
-
White Claw Hard Seltzer Black Cherry
-
Twisted Tea Original
-
White Claw Hard Seltzer Mango
-
Truly Hard Seltzer Wild Berry
-
Topo Chico Strawberry Guava
The Food & Wine 25
Over the past 25 years, food has moved from the kitchen to the center of culture. To mark this milestone, Food & Wine presents The Food & Wine 25: The Most Influential Trends in Food & Drink from the Past Quarter-Century, spotlighting the recipes, products, restaurants, and cultural shifts that have transformed how we eat and drink. From the bacon boom of the 2000’s to the influence of TikTok on world markets, the list offers a definitive timeline of the trends that have shaped how we eat, cook, dine, and drink today.
The Food & Wine 25 is organized into 10 categories, each category spotlighting the 25 most impactful food and drink trends of the past quarter-century—and those that are poised to shape the next 25 years to come.
Restaurant Movements & Dining Shifts
● The Burgerfication of America
● Farm-to-Table to Fine-Casual
● Black Chefs Tell Their Stories
● Molecular Gastronomy Galore!
● The Pandemic Shakes It All Up
Game-Changing Recipes & Food Trends
● Avocado Everything
● Chili Crisp Crushes It
● Birria Boom
● Hummus Hits the Big Time
● Brassicas Get Their Due
Evolution of Drink Culture & the Modern Bar
● The Craft Beer Revolution
● Classic Cocktail Renaissance
● Agave Spirits Take Flight
● Non/Alcoholic Goes Mainstream
● Wine Dresses Down
Moments That Mattered: News & Culture
● Food Criticism for the People
● Restaurant Culture Gets a Reckoning
● Modern Reality Food TV Era
● TikTok Peaks as Trend Engine
● Smartphones Steal the Scene
Kitchen Design & Culinary Tools
● Pro-Level Pizza at Home
● Meal Kits & Ghost Kitchens
● Global Pantry Staples
● Grocery and Restaurant Delivery Revolution
● Rise of the Open Concept Kitchen