MRM Research Roundup: Buzzing About Coffee, Tipping Trends, and the Evolution of Food Delivery
17 Min Read By MRM Staff
This edition of Modern Restaurant Management (MRM) magazine's Research Roundup features affordable dining cities, coffee prices and trends, hiring and staffing trends, tech adoption, holiday retail outlook, and fast-growing QSR categories.
Post-Pandemic Recovery
After suffering devastating job losses, the restaurant and hospitality industry has made a post-pandemic recovery. A recent article by Escoffier Global analyzed a ‘new normal’ that brings both opportunities and challenges different from the pre-pandemic environment, including employment trends, staffing shortages, and hiring and retention strategies.
Employment in the restaurant and hospitality industry has officially returned to pre-pandemic levels, with 16.99 million jobs in April 2025, and 822K projected new vacancies by 2033.
Labor shortages are still affecting the industry, with 65 percent of the U.S. hotels and 59 percent of the restaurants struggling to fill positions.
The biggest age group in the restaurant and hospitality industry is people from 18 to 24, amounting to 30.5 percent of the total workforce.
The New Normal – Amid Recovery, Hiring Challenges Persist
According to the Federal Reserve Bank of St. Louis, employment surpassed the February 2020 peak of 16.89 million jobs, reaching 16.99 million by April 2025. The sector is projected to add 822.7K new jobs by 2033, indicating long-term growth beyond the recovery phase. However, this recovery is uneven across different segments of the industry. Hotel employment remains about 10 percent below pre-pandemic staffing levels, while restaurant employment has rebounded faster.
Ongoing Staffing Shortages
Despite the overall recovery, staffing challenges persist across the industry. Hotel employment remains about 10 percent below pre-pandemic staffing levels, according to the American Hotel and Lodging Association (AHLA). The AHLA has found that 65 percent of U.S. hotels report ongoing labor shortages, down from 76 percent in May 2024, even after raising wages and offering additional perks.
On the restaurant side, 59 percent of operators said they had positions that were hard to fill, down from 70 percent in 2023. The recovery varies significantly by geography. The NRA has also reported that restaurant employment is significantly above pre-pandemic levels in fast-growing states like Idaho (+13 percent), Utah (+12 percent), and Montana (+11 percent).
Retention Remains a Perennial Challenge
The staffing shortage isn’t just about finding quality workers, but it’s about keeping them on the job. 77 percent of restaurant operators report that recruitment and retention are their top concerns, with 54 percent of restaurants struggling to fill management and skilled back-of-house roles like cooks and chefs. Turnover is often driven by burnout, inflexible schedules, low wages, and limited advancement opportunities. Hospitality jobs are typically in-person, high-stress, and low-paid. These factors make them more vulnerable to quits than other sectors.
Hiring and Retention Strategies in Today’s Landscape
This competitive hiring landscape gives operators an incentive to innovate their hiring tactics to attract quality candidates. Increasingly, this means turning to technology to speed up the process. The NRA reports, 37 percent of restaurant operators plan to use automated hiring tools or labor management systems.
Wage Growth and New Perks
While technology helps streamline the hiring process, the foundation of attracting workers remains competitive compensation. Leisure and hospitality has seen the strongest post-pandemic wage growth of any industry, with a 38 percent increase in new-hire pay from 2018 to 2024. Beyond wage growth, employers are also offering perks and quality of life improvements to help retain staff. Businesses are experimenting with benefits like tuition reimbursement and travel discounts, while research has found that more predictable scheduling leads to increased well-being and economic security for hourly service workers.
Dining Out Affordability
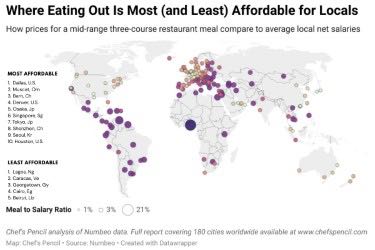
International food magazine Chef’s Pencil’s new report ranks more than 170 cities worldwide by comparing average restaurant prices to local wages. While the conversation around the cost of living is often negative, findings reveal a surprising truth: the U.S. is a global leader in dining out affordability.
Exclusive U.S. insights from the report:
-
The American Advantage: Nine U.S. cities rank in the global "One Percent Club," where a mid-range meal costs just 1 percent or less of the average take-home pay. Dallas, TX tops the global list, and cities like Denver, CO and Seattle, WA rank well ahead of major European capitals like Paris and Berlin.
-
The Tipping Factor: While U.S. cities lead in raw affordability, the common 15-20 percent tip can significantly alter the final cost, raising the price of a mid-range meal by $5-$10 per person and slightly lowering the overall affordability ranking.
-
New York and Miami Rank as the Least Affordable U.S. Cities: Not all U.S. cities are equal. The report shows that major hubs like New York, NY (62nd globally) and Miami, FL (71st) are far less affordable for locals than their counterparts in the Midwest or on the West Coast, once local wages are factored in.
-
Coffee & Beer Culture: The U.S. also shines in the daily indulgences. San Francisco, Seattle, and Boston are among the most affordable cities for a daily cappuccino, while Atlanta, GA and San Francisco, CA rank in the top 10 for beer affordability.
State of Frontline Hiring
iCIMS released its State of Frontline Hiring Report, uncovering urgent demand for frontline workers and the process challenges keeping employers from meeting hiring needs. Frontline hiring managers overwhelmingly say the need is immediate: 91 percent report urgency in filling roles. Yet, most candidates never make it from application to interview. Six in 10 workers have abandoned an application because it was too lengthy or unclear, and nearly one-third of frontline hiring managers see the most drop-off at the interview stage.
Informed by surveys of 1,000 U.S. hourly frontline workers and 1,000 frontline hiring managers across healthcare, hospitality, manufacturing and retail, the iCIMS report maps out the biggest leaks from application to offer throughout the frontline hiring experience.
According to the report, hiring process friction —not candidate interest — is holding companies back from filling critical roles:
-
The job match gap: Sixty-two percent of frontline hiring managers say quality of candidates is their biggest challenge, ahead of turnover (30 percent), no-shows (27 percent) and not enough applicants (24 percent). Yet only 17 percent of frontline workers say they “always” come across jobs that meet their needs.
-
Application abandonment: One-third of frontline hiring managers report candidate drop-off at the interview (32 percent), followed by scheduling (20 percent) onboarding (18 percent) and application (14 percent). On the worker side, 60 percent said they have started but not finished an application, citing that forms are too lengthy or time-consuming (50 percent), uncertainty about qualifications (35 percent) and lack of pay transparency (31 percent).
-
Workers feel unheard: Sixty-nine percent of frontline workers say employers always or sometimes ignore what candidates want in the hiring experience, emphasizing the need for hiring managers to provide role clarity and pay transparency, fewer steps, faster replies and manager authority to decide.
-
Hospitality: With 68 percent of candidates abandoning applications and 26 percent skipping interviews, hospitality has the leakiest funnel. Hospitality hiring managers say the biggest issue is applicant quality (57 percent), but candidates want responsiveness (42 percent) and supportive teams (44 percent). Hospitality employers can prioritize improving candidate experience — not raising the bar — to capture quality talent.
-
Retail: Only 9 percent of retail workers always find a suitable job match, the lowest across industries. Despite high urgency from retail hiring managers (90 percent) and low no-show (12 percent), poor communication drives 22 percent of candidate drop-off and 51 percent want pay posted. With holiday hiring ahead, retailers risk losing talent with stronger job matching, transparent postings and faster replies.
Top QSR Categories
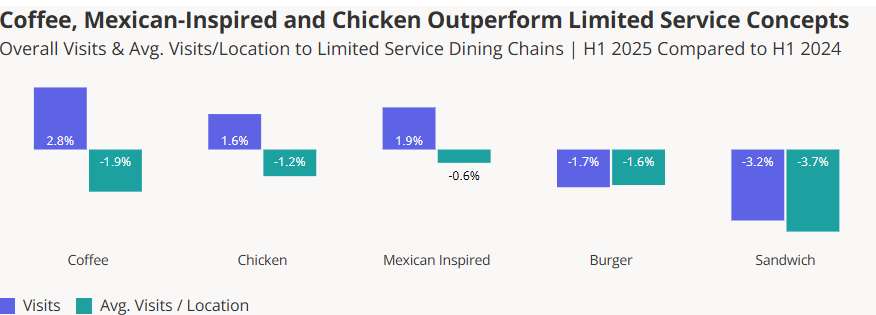
Where has all the action been during the first half of 2025 in the QSR segment? Coffee, chicken, and Mexican-inspired chains, according to a new Placer.ai report.
The report analyzes several QSR categories — coffee, chicken, Mexican-inspired, burger, and sandwich — and finds that among the five, coffee is leading the pack with visits up 2.8 percent year-over-year through the first half of 2025.
Dining Out and Tipping Are Back
In 2020, the COVID-19 pandemic caused Americans to stay at home, upending the restaurant industry and changing the way we eat. Five years later, in 2025, many of those habits haven’t just lingered. Instead, they’ve reshaped how we dine, tip and save money when eating out.
To better understand these shifts, CouponCabin surveyed 1,007 U.S. consumers in August 2025 about their dining and tipping habits. They found that Americans are dining out more than before the pandemic, tipping generously even amid “tip fatigue” and making smart trade-offs like skipping surcharges to keep costs in check
When asked whether they dine out more, less or the same as they did before COVID, more than a third of respondents (35 percent) say they dine out more often in 2025.. And for some, dining out isn’t a rare occasion as 30 percent of respondents indicated that they dine out a few times a week, with 25 percent dining out about once a week.
The most common tip was a 20 percent, with 34 percent of respondents indicating that they pay the gold standard for excellent service. And while eight percent of respondents tip more than 20 percent of the bill, 19 percent tip less than 10 percent. On the bright side, 33 percent indicated that they tip more than they did before COVID, while 62 percent of respondents tip about the same.
According to the survey, 40 percent of respondents are ordering delivery more than they did before COVID. When they do, they’re sure to leave a tip, too. Of those who order for delivery, 88 percent leave a tip in 2025. Of those who choose to tip for their delivery, 71 percent indicated that they tip 10 percent of the bill or more. While 10 percent was the most popular tip, 17 percent of respondents said they tip 20 percent or more for their delivery on average.
When it comes to pickup, it’s becoming even more popular: 45 percent of respondents order food for pickup more than they did before COVID, and the majority of those who order pickup are providing a tip, even without any table service. Among those who tip for pickup, 10 percent of the bill was the most popular amount. However, tipping between 11 percent – 15 percent of the bill wasn’t far behind.
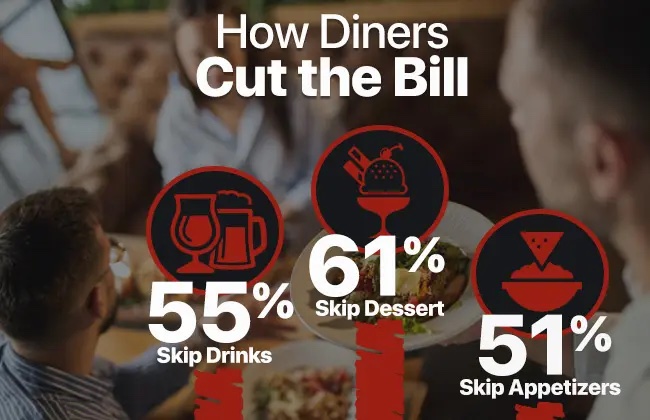
When it comes to saving money, respondents’ most popular selection was skipping dessert (61 percent), top chart. Ditching drinks (55 percent) and appetizers (51 percent) were also popular options, while tipping less was selected by just 12 percent.
Digital Prep List
7shifts released its Digital Prep List, a guide to help restaurant operators prepare their restaurants for the future of technology. This benchmarking report draws on feedback from more than 500 restaurant professionals, and highlights a growing divide between operators who use connected systems to boost profitability and those still relying on manual processes that drain time and cut into margins.
The Digital Prep List maps the journey across four key stages (starting, growing, integrated, and strategic) and provides actionable steps for operators to progress toward a fully connected tech stack. While 65 percent of restaurants adopted a new technology in the last year, a significant divide remains: nearly half (49 percent) describe their systems as mostly or highly connected, but the rest are still dependent on fragmented or paper-based processes.
Key inefficiencies persist in early stages:
-
47 percent still use paper schedules or whiteboards
-
50 percent manage inventory with manual counts
-
57 percent rely on group texts for team communication
Meanwhile, operators who achieve integrated or strategic status report measurable improvements in labor efficiency, payroll automation, and employee experience, key advantages in a competitive market.
Evolving Third-Party Delivery
Intouch Insight has released the second edition of its Third-Party Delivery Study, showing that food delivery continues to evolve. For the first time, first-party apps were measured alongside third-party platforms, and they're already firmly in the mix. Meanwhile, convenience stores are closing the gap with restaurants on key measures of customer satisfaction.
Key Findings from the 2025 Third-Party Delivery Study
-
First-Party Apps Set a New Standard in Personalization: For the first time, the study looked at first-party apps, and they came out swinging. First-party apps took top spot when it comes to creating personal experiences. They offered a greater ability to customize orders and an increased frequency of offering personalization or something "extra", beating their third-party counterparts by 10 points in both categories.
-
C-Stores Are Closing the Gap: Orders placed with convenience stores are moving closer to restaurant orders' performance in terms of overall customer satisfaction. The gap narrowed from 11 points in 2024 to 7 points this year. Order accuracy improved from 77 percent to 82 percent, and C-store orders even equaled restaurants on food temperature satisfaction.
-
Market Shake-Up Among Third-Party Platforms: Uber Eats claimed the top spot for overall satisfaction in 2025. At the same time, platforms lowered their average fees, with DoorDash taking the sharpest cut, dropping service and delivery charges to land at just $4.08.
-
Accuracy and Temperature Drive Satisfaction: The basics still matter most. Accurate orders led to a 45 percentage-point higher satisfaction rate, while food delivered at the right temperature resulted in a 42-point boost. Getting these details right is critical to earning loyalty.
The Buzz on Coffee
The team at Toast uncovered some key trends in coffee with a particular focus on prices. Among the key findings:
-
📈Prices are on the rise. The national median price for a regular coffee in August 2025 was $3.52, while cold brew was $5.47.
-
📍A regular hot coffee will set you back the most in Los Angeles ($4.99) and San Francisco ($4.92). But Seattle saw the biggest price jump, with a 12.4 percent increase since last August.
-
❄️Cold brew is a summer king. Demand for cold brew more than doubles from its low point in the winter to its peak in the middle of summer. In July 2025, customers ordered 35 percent more cold brew than the annual average.
-
☕️Regular coffee still reigns supreme. Despite cold brew's popularity, Americans order more than seven times as much regular coffee. Sales for regular coffee are more stable year-round, peaking in December and March.
-
📍Regional tastes differ. The Midwest and New England are the leaders for regular coffee sales. Cafes in Minnesota sell nearly 45 percent more regular coffee than the U.S. average. The Northeast, however, overwhelmingly prefers cold brew. Maine is the "undisputed cold brew capital," selling 99 percent more than the national average.
Making Girls’ Night Meaningful
New research finds that girls’ nights aren’t just fun, but essential. Women say they need a girls’ night every 22 days to feel balanced, according to a study conducted by Talker Research, on behalf of Bezel Wines.
Highlights include:
-
Nearly eight in 10 women (78 percent) agree that girls’ nights are necessary to feel recharged, not just a nice-to-have
-
Girls’ nights offer a key opportunity to reconnect, and for most women, creating the right environment starts with wine
-
Eighty-eight percent say wine is the beverage of choice for the ultimate girls’ night, more than double any other beverage
-
85 percent say they open a bottle within 16 minutes of the first guest arriving, signaling that the night has officially begun
Fast-Food Spending
WalletHub released its report on the Cities Where People Spend the Most & Least on Fast Food to shed light on where these purchases take the biggest bite out of Americans’ wallets.
To determine where consumers spend the most and least relative to their earnings, WalletHub analyzed the average prices of burgers, pizza and fried chicken sandwiches in 100 of the largest cities, then compared them to the median household income.
|
Highest Percent of Income Spent |
Lowest Percent of Income Spent |
|
|
1. Cleveland, OH (0.68 percent) |
91. Huntington Beach, CA (0.28 percent) |
|
|
2. Detroit, MI (0.67 percent) |
92. Scottsdale, AZ (0.28 percent) |
|
|
3. Newark, NJ (0.62 percent) |
93. Seattle, WA (0.27 percent) |
|
|
4. Baltimore, MD (0.61 percent) |
94. Irvine, CA (0.26 percent) |
|
|
5. Birmingham, AL (0.60 percent) |
95. San Jose, CA (0.26 percent) |
|
|
6. Hialeah, FL (0.59 percent) |
96. San Francisco, CA (0.26 percent) |
|
|
7. Buffalo, NY (0.57 percent) |
97. Gilbert, AZ (0.24 percent) |
|
|
8. Milwaukee, WI (0.56 percent) |
98. Plano, TX (0.24 percent) |
|
|
9. Toledo, OH (0.56 percent) |
99. Austin, TX (0.23 percent) |
|
|
10. Miami, FL (0.53 percent) |
100. Fremont, CA (0.20 percent) |
|
Best Cities for Vegans and Vegetarians
With Oct. 1 being World Vegetarian Day and Nov. 1 being World Vegan Day, and with about 18 million U.S. adults having a vegetarian or vegan diet, WalletHub released its report on 2025's Best Cities for Vegans & Vegetarians, as well as expert commentary.
To determine the best and cheapest places for following a plant-based diet, WalletHub compared the 100 largest cities across 17 key indicators of vegan- and vegetarian-friendliness. The data set ranges from the share of restaurants serving meatless options to the cost of groceries for vegetarians to salad shops per capita.
|
Top 20 Cities for Vegans & Vegetarians |
|
|
|
1. Portland, OR |
11. San Diego, CA |
|
|
2. Los Angeles, CA |
12. Tampa, FL |
|
|
3. Austin, TX |
13. Cincinnati, OH |
|
|
4. San Francisco, CA |
14. Lexington-Fayette, KY |
|
|
5. Oakland, CA |
15. New York, NY |
|
|
6. Phoenix, AZ |
16. Birmingham, AL |
|
|
7. Miami, FL |
17. Atlanta, GA |
|
|
8. Seattle, WA |
18. Chicago, IL |
|
|
9. Orlando, FL |
19. Las Vegas, NV |
|
|
10. Madison, WI |
20. Pittsburgh, PA |
|
Best vs. Worst
-
Scottsdale, Arizona, has the highest share of restaurants serving vegetarian options, which is 14.2 times higher than in Laredo, Texas, the city with the lowest.
-
Scottsdale, Arizona, has the highest share of restaurants serving vegan options, which is 55.3 times higher than in North Las Vegas, Nevada, the city with the lowest.
-
San Francisco has the most community-supported agriculture programs (per square root of population), which is 26.5 times more than in Houston, Texas, the city with the fewest.
-
Atlanta, Georgia has the most salad shops (per square root of population), which is 17.2 times more than in Santa Ana, California, the city with the fewest.
AI Shaping Online Traffic
DataDome released its 2025 Global Bot Security Report, an in-depth analysis of over 16,900 websites across 22 industries that examines businesses' resilience against automated threats.
The findings reveal a stark truth: AI is now the dominant force shaping online traffic, yet most businesses remain dangerously unprepared to manage it.
AI-generated traffic, ranging from large language model (LLM) crawlers to AI-powered agents, has surged to unprecedented levels. In 2025, AI bot and crawler traffic quadrupled across
Key findings:
● AI traffic has exploded: LLM crawler traffic quadrupled across DataDome’s customer base in 2025, rising from 2.6 percent of verified bot traffic in January to over 10.1 percent by August. DataDome alone detected nearly 1.7 billion requests from OpenAI crawlers in a single month. These crawlers scrape massive amounts of web content, usually without consent or oversight, draining server resources and exposing proprietary data.
● Businesses are pushing back, but ineffectively: 88.9 percent of domains disallow GPTBot in their robots.txt files, yet this measure offers little real protection. AI-powered crawlers and browsers ignore these directives, rendering static blocking strategies obsolete. Without active enforcement beyond robots.txt, organizations risk exposing their content, data, and infrastructure to the next generation of automated threats.
● Legacy defenses are failing fast: Only 2.8 percent of websites were fully protected in 2025, down from 8.4 percent in 2024. Most businesses still cannot stop even basic bots, let alone AI- driven ones that dynamically adapt their identity and behavior.
● AI bots target high-value endpoints: Unlike older automation, AI-driven traffic doesn’t stop at scraping. In 2025, 64 percent of AI bot traffic reached forms, 23 percent login pages, and 5 percent checkout flows, creating new vectors for fraud, account takeover, and compliance risk.
● AI traffic is a double-edged sword: While much of it is malicious, AI-driven requests also represent legitimate new use cases. Without the ability to classify intent, businesses risk either blocking innovation or opening the door to abuse.
● High-risk industries remain underprotected: Government, Non-Profit, and Telecoms sectors had the weakest protection. Meanwhile, Travel & Hospitality, Gambling, and Real Estate led the way with the highest combined rates of full and partial protection. Even among the top-performing industries, full protection remains rare, and partial protection alone isn’t enough to stop sophisticated bots.
● Scale doesn’t equal better security: Only 2 percent of domains with over 30M monthly visits were fully protected. Even among enterprises with 10,001+ employees, just 2.2 percent had full protection, and 61 percent were completely unprotected.
● Advanced bots evade most defenses: Anti-fingerprinting bots were only blocked by ~7 percent of websites, leaving most businesses highly vulnerable to account takeover, carding, and advanced scraping attacks. Fake Chrome and curl bots were detected just 21 percent of the time.
● Weak bot defenses are a global constant: Latin America had the highest share of protected websites, yet only 3.5 percent were fully protected and 38.5 percent partially protected— leaving nearly 6 in 10 domains completely exposed. North America and Europe showed similar patterns, with over 60 percent of websites lacking any bot protection. Asia Pacific lagged further, with just 1.6 percent fully protected. This lack of regional variation enables attackers to reuse the same tools across markets, reducing costs and increasing the scalability of global cyberfraud campaigns.
Little Treat Culture
Fall is here and Pumpkin Spice Lattes are spreading across the nation, 55 percent of Americans consume a little treat multiple times a week– including 11 percent who do it daily, according to a survey from NCSolutions.
Why?
-
73 percent say little treats are important to their quality of life, and 62 percent consider treats part of self care
-
Treats can be a coping mechanism: 48 percent purchase a treat after a tough day, and 36 percent consider it mental healthcare
-
Treats can be a celebration: 23 percent treat themselves after completing a major milestone, and 50 percent consider treats to be a reward
-
40 percent confess to buying little treats because they can’t afford bigger things; for Gen Zers, this increases to 53 percent. In an economy where big life milestones seem out of reach, many are turning to instant gratification instead.
Holiday Outlook
AlixPartners released its 2025 U.S. Retail Holiday Outlook, which forecasts an "underwhelming" three to five percent growth rate in holiday retail sales this year. This is a notable decrease from last year's four percent growth and 2023’s six percent rate. Additionally, at the low end this is essentially flat with inflation taken into consideration and only up two percent at the high-end.
The outlook, based on a comprehensive survey of U.S. consumers, reveals a consumer who is more cautious as inflationary pressures take a toll on household spending. The research also revealed a bifurcation between higher-income households and lower-income ones.
In this year’s study, high-income consumers (those making more than $100,000 per year) are the primary drivers of increased spending this holiday season. Over 30 percent said they plan to spend more this year, while less than 20 percent of other income groups intend to increase their budgets. The gap between low- and high-income earners was also seen in prior AlixPartners research that showed 31 percent of higher-income shoppers expecting to increase their spending this year (especially on travel and leisure) versus 16 percent of lower-income households.
The data also showed that about 80 percent of consumers polled said they plan to spend the same or less this year than last, with 35 percent anticipating a reduction in spending (which is a 35 percent increase from last year). The expected decline in spending follows an uptick in retail sales earlier this year as consumers went on a spending spree ahead of anticipated higher prices due to tariffs. Over the past year, shoppers faced ongoing inflation but had shown resilience and continued to spend — until now.
Furthermore, the study found that nearly 40 percent of the polled consumers stated they intend to buy 50 percent or more of their holiday purchases on sale. In addition, the findings revealed significant generational differences in consumer sentiment. For example, Generation X consumers are significantly more promotion-driven (48 percent) when compared to younger Generation Z consumers (30 percent).
Other key findings:
-
Shoppers across all income brackets will be looking to reduce spending in almost every category, with holiday food and beverage enjoyed at home being the sole category with anticipated increases, which is being primarily driven by high-income households.
-
The top strategies for reducing spending include shopping for more affordable brands (including private label), buying fewer gifts overall and purchasing a significant number of gifts on sale or promotion.
-
Households are planning to start their holiday shopping even later this year, with only 35 percent saying they will begin before Halloween (which is down three percentage points from last year).
-
The post-pandemic shift back to in-store shopping is decelerating, with online shopping expected to increase slightly this year. Of those polled, 67 percent of consumers intend to make 30 percent or more of their purchases online.
-
In-stock rates are crucial for in-store shoppers; if an item is out of stock, just one-third of consumers said they will complete the purchase on the retailer's website, with most opting to go to another retailer's store or website.
-
When asked about the economy, 50 percent of respondents believe the economy is worse now than a year ago, and 45 percent expect it to worsen in the coming year.
-
One-third of shoppers report their personal financial health is worse than a year ago, with only 27 percent reporting an improvement.
NFL Season Kick Off: Beverage Edition
America’s most popular sport returned in full force as the 2025 NFL season kicked off, and fans nationwide poured into bars and restaurants to celebrate. From the primetime clash on Opening Night between the defending champion Philadelphia Eagles and “America’s Team,” the Dallas Cowboys, through Sunday night’s instant classic, BeerBoard tracked total alcohol performance across the on-premise channel.
This year’s review compares results from September 4–7, 2025, against the 2024 NFL Opening Weekend (September 5–8, 2024).
Opening Night vs Weekend Show Mixed Results for Draft
Fans came out strong for Opening Night, packing bars and restaurants to watch the defending champion Eagles battle the Cowboys. On Opening Night, draft beer saw a slight uptick (+2 percent), but fell a notable -7.3 percent for the weekend. This marks a pullback from its role as the steady anchor of game-day consumption, especially after +8 percent growth over the 2024 Opening Weekend.
Surprisingly, packaged products slipped −8.3 percent on the weekend (-10.7 percent on Opening Night). Much of that decline fell on beer and seltzers, while RTD and NA options do not claim as much share as Light Lager and Lagers in package sales, they continued to outperform with impressive growth of +37.6 percent and +39.7 percent, respectively.
Top Draft Performers
Despite overall category declines, light beers continued to dominate national Draft rankings:
-
Michelob Ultra
-
Miller Lite
-
Coors Light
-
Modelo Especial
-
Bud Light
In Dallas, the top Draft brand was Michelob Ultra, while in Philadelphia, Miller Lite won the weekend at the taps.
Top Packaged Products
Classic imports and light beers maintained their leadership nationally:
-
Michelob Ultra
-
Corona Extra
-
Miller Lite
-
Modelo Especial
-
Coors Light
In Dallas, the top Packaged brand was Modelo Especial, while in Philadelphia it was hometown driver Surfside Iced Tea and Lemonade + Vodka.
Top RTD Cocktails
RTDs continued their momentum, driven by vodka-based offerings.
-
High Noon Sun Sips Pineapple
-
Surfside Iced Tea and Lemonade + Vodka
-
Sun Cruiser Iced Tea & Vodka
-
Nutrl Vodka Seltzer Watermelon
-
High Noon Sun Sips Peach
Top Hard Seltzers
Hard seltzers remained a popular choice for NFL fans, balancing sessionability with flavor variety.
-
White Claw Hard Seltzer Black Cherry
-
Twisted Tea Original
-
White Claw Hard Seltzer Mango
-
Truly Hard Seltzer Wild Berry
-
Topo Chico Strawberry Guava
Top Non-Alcoholic Products
Non-alcoholic beer and seltzers showed staying power as part of the game-day lineup, appealing to fans who want to enjoy the occasion without alcohol.
-
Heineken 0.0
-
Dos Equis Lime & Salt ZERO
-
Michelob Ultra Zero
-
Athletic Run Wild
-
Athletic Upside Down
Healthy Handwashing
For 16 years, Bradley Company’s Healthy Handwashing Survey™ has tracked how Americans’ public restroom expectations shape their behavior – offering an unmatched view of shifting hygiene trends and their business impact.
The 2025 results confirm a powerful truth: restrooms aren’t just functional spaces – they’re a mirror of a facility’s management, brand, and values. Whether they fall short or exceed expectations, the impact on customer perception, loyalty, and spending is immediate.
Bradley’s nationally representative survey finds:
-
84 percent say an unclean or poorly stocked restroom damages a business’s image
-
75 percent will think twice before returning after a bad restroom experience
-
71 percent are more likely to return — and spend more — at businesses with clean, well-maintained restrooms
Since 2009, the survey has consistently identified the same top frustrations: clogged or unflushed toilets, unpleasant odors, and restrooms that look outdated, dirty, or unkempt. Women are more likely than men to observe unclean restroom conditions. These issues don’t just create discomfort; they signal to users that cleanliness and care aren’t priorities.
To turn these pain points into positives, Americans say the most impactful improvements are:
-
Increased cleaning and restocking: The #1 request for the past decade
-
Paper towels as an option, even with dryers: 60 percent use them to avoid touching restroom surfaces
-
Touchless fixtures throughout: Nearly 80 percent say they’re important and provide a better restroom experience
These preferences represent a permanent shift in public expectations. Over the past ten years, and especially in the wake of COVID-19, their importance has surged with the most dramatic gains between 2020 and 2022. Today, cleanability, hygiene, and convenience are no longer extras; they’re the baseline for earning customer trust.
Key recommendations for meeting rising expectations include:
-
Design for hygiene and maintenance: Sleek, seamless surfaces and fingerprint-resistant finishes improve both appearance and cleanability
-
Go touchless: From faucets to towel dispensers, no-touch fixtures are essential for user convenience and ease of cleaning
-
Integrate handwashing: All-in-one, sensor-activated soap, water, and drying improves user traffic flow and reduces water mess
-
Smart monitoring of supplies: Maintenance indicators and top-fill, multi-feed soap systems cut downtime and labor
Survey participants rated hospitals/clinics (43 percent), hotels/resorts/conference centers (43 percent), and restaurants (37 percent) as having the best restrooms in 2025. At the bottom: drug stores (15 percent), gas stations (15 percent), and schools (10 percent) – a clear opportunity for improvement.
Bradley’s Healthy Handwashing Survey™ is conducted annually and reflects responses from a nationally representative sample of over 1,000 American adults.