MRM Research Roundup: Delivery Fraud, the Playground Effect, and Top 100 Places to Eat
15 Min Read By MRM Staff
This edition of Modern Restaurant Management (MRM) magazine's Research Roundup features Yelp's Top Places to Eat in the U.S., decline in veganism, shift away from seed oils, Starbucks Monday, and spirts holding steady.
Identifying Challenges and Uncovering Opportunities
SpotOn unveiled its 2025 Restaurant Business Report, revealing the financial challenges restaurant operators face and the opportunities to strengthen their businesses. While economic pressures persist, the report highlights that with the right tools and insights, operators can take control of their financial future in 2025 to strengthen profitability and position their businesses for long-term success.
SpotOn worked with Penta to conduct a nationwide survey of 200 independent and chain restaurant operators to better understand the state of financial literacy among US operators in major markets including including Seattle, San Francisco, Los Angeles, Dallas, St. Louis, Chicago, New York, Pittsburgh, Washington DC, Miami, Denver, and Detroit.
Key Findings:
Economic Pressures Are Rising: 93 percent of operators are concerned about the impact of rising interest rates on their business, while nearly one in three worry about financial stability in 2025. Independent operators feel the squeeze the most.
Financial Systems Need an Overhaul: While 99 percent of operators agree that strong financial management is critical, 84 percent say their current systems need improvement, and nearly half admit they should spend more time on financial tracking but struggle to do so.
Data Gaps Hinder Pricing Strategies: 73 percent of operators lack full confidence in their pricing strategy, with most relying on gut instinct or competitor pricing instead of real-time cost analysis.
Access to Capital Remains a Challenge: 66 percent of operators anticipate needing additional funding in 2025, yet fewer than 12 percent have explored POS-based lending, despite its potential to provide faster, more flexible capital.
A Path Forward for Restaurants
The report highlights key opportunities for restaurants to strengthen their financial future through better data access, automation, and smarter financial tools:
Bridge the Data Gap: With real-time financial reporting and automation, restaurants can spend less time tracking numbers and more time running their business.
Streamline Financial Management: Integrating financial systems with payroll and accounting software reduces administrative burdens, freeing operators to focus on profitability.
Turn Pricing into a Growth Strategy: A smarter approach to menu pricing can boost revenue and profitability without compromising guest experience.
Explore Easier Access to Capital: Traditional loans aren’t the only option. POS-based lending solutions give operators quick access to working capital, helping them invest in their business without the lengthy approval process.
Restaurants Grow Compared to January, but Headwinds Persist
Fiserv published the Fiserv Small Business Index for February 2025, with the seasonally adjusted Index holding steady at 147, unchanged from January. While total spending growth was nearly flat compared to January, sector-level trends showed consumers shifting more spend to retailers and restaurants in February and spending less at service-based businesses.
On a year-over-year basis, small business sales (+2.1 percent) and total transactions (+4.0 percent) showed healthy growth. Month-over-month sales (+0.1 percent) and transactions (+1.6 percent) also grew.
Year-to-date, combined sales growth for January and February is 3.5 percent, which is about 1.5 percentage points less than sales growth from the same two-month period in 2024. The slowing growth is the result of lower average ticket size, while transaction growth remains steady.
Consumer spending at small business restaurants declined (-2.4 percent) year over year despite transactions (or foot traffic) growing (+5.9 percent). These annualized sales declines despite foot traffic growing reflect the ongoing trend of consumers trading down for lower-cost options when dining out.
On a month-over-month basis, restaurants experienced a welcomed bounce, growing both total sales (+2.3 percent) and transactions (+3.9 percent). Similar to the annual trend, average ticket sizes declined (-1.6 percent) month over month.
Top 100 Places to Eat in the U.S.
Yelp, unveiled its 12th annual list of the Top 100 Places to Eat in the U.S. Yelp analyzes the millions of reviews on its platform, along with nominations from its community of users, to generate a diverse list of local eateries, from food trucks to fine dining.
Yelp has named Holbox in Los Angeles the top restaurant of 2025. Known for its fresh Mexican seafood, Holbox offers grilled octopus, fish tacos, and a variety of ceviches, all crafted by Michelin-starred Chef and Owner Gilberto Cetina. The restaurant boasts 1,000-plus 5-star reviews and Yelp users rave about the vibrant flavors, affordability, and eco-friendly practices that make Holbox a standout.
Since 2014, Yelp’s list has recognized over 900 establishments in more than 400 cities, boosting local businesses’ visibility and revenue. This year, 23 states and 42 cities are represented. California leads with 37 restaurants, including Holbox (#1) in Los Angeles and Big Jims Roast Beef (#33) in San Diego. Texas featured nine, including The Mayor's House By Selda (#87) in Dallas. Nevada is home to eight, including R Town Pizza (#44) in Reno and Slater’s 50/50 (#77) in Las Vegas.
Yelp’s engaged community of locals enables its community to connect with affordable businesses. Casual dining is on the rise, with spots like Chellas Arepa Kitchen (#5) in Lancaster, Pennsylvania and Cardelli's Italian Market Deli (#45) in Riverside, California offering budget-friendly options. In fact, 80 businesses on the list are priced under 30 dollars per person.
To access, follow, or embed Yelp’s 2025 list of the Top 100 restaurants in the United States, visit the Collection
To determine the Top 100 Places to Eat in 2025, Yelp’s data science team analyzed user submissions to determine the top restaurants by ratings, number of reviews, and volume of submissions, and finalized the rankings with the expertise of our Community Managers.
Delivery Fraud
Incognia released the Gig Economy Edition of its annual Frontline Report. This edition ranks the top fraud challenges faced by global food delivery and ride-hailing companies in 2024. The findings show that fake accounts were used in 57 percent of driver-side fraud, while refund and promotion abuse were tied as the top consumer-side fraud type, each representing 48 percent of total high risk assessments returned by Incognia respectively.
In one scenario analyzed by Incognia, a fraudster created 800 fake accounts to exploit new user coupons and was able to steal 1.5 percent of the total redeemed coupon value that month. Another case showed how a bad actor was able to access 400 different accounts on a single device in order to consume thousands of dollars worth of promotions in just 30 days.
Similarly, refund abuse—which accounted for 48 percent of the consumer-side fraud detected by Incognia—was also reported to impact nearly 50 percent of merchants worldwide, according to the MRC 2024 Global eCommerce Report. In one case, Incognia identified a single Samsung device that accessed over 200 accounts to fraudulently return more than $5,000 worth of stolen merchandise. The fraudster then likely resold the items to double their profits.
Veganism in Decline
Recent data from Chef’s Pencil suggests that veganism has hit a significant decline, with interest levels dropping back to 2015-2016 levels. Here are some key takeaways from their latest report:
-
Google Trends Decline: Searches for “vegan recipes” and “vegan restaurants” have dropped sharply since their 2020 peak, particularly in the U.S., U.K., and Australia.
-
Vegan Restaurants Struggling: Many are shutting down or adding non-vegan options to survive, with industry leader saying "strict veganism has seen a major pushback".
-
Social Media Engagement Falling: Veganuary’s Instagram growth has slowed dramatically, dropping from 49,600 new followers in 2020 to just 5,500 in 2024, according to a social media analytics tool. While Veganuary reported record 2025 engagement numbers, a Veganuary spokesperson clarified that this growth was mainly due to expansion into additional countries, not necessarily increased enthusiasm in existing markets.
-
Number of Vegans in the US: Flat or Declining Trend: Two organizations, Gallup and IFIC, which have tracked data over multiple years, suggest that the number of people following a vegan diet is either declining or stagnant.
-
Consumer Shifts: While veganism is declining, interest in less processed plant-based foods like tofu, lentils, and chickpeas is rising.
Rent Deliquency Decline
Alignable’s latest Small Business Revenue & Rent Report is out , revealing a complex picture for small business owners in 2025. While 62 percent of entrepreneurs are optimistic about the year ahead—one of the highest positivity rates in four years—financial challenges remain significant.
The report found 40 percent of independent restaurant owners couldn't afford to pay rent in full and on time in January. While that's a significant number, it does reflect a major drop in this sector's rent delinquency compared to December, when it was 46 percent. And it's three percentage points better than the annual average for restaurants (43 percent), as well as the lowest figure since July.
Other key findings:
- Optimism is surging: 62 percent of small business owners feel hopeful about 2025, with 48 percent feeling more confident than last year.
- State and Industry bright spots: Business owners in Texas, Pennsylvania, North Carolina, New York, and Ohio report improved financial conditions. Automotive and manufacturing sectors also show progress.
IHOP and Applebee's Foot Traffic
Visits fell at IHOP and Applebee’s during 2024, according to a new report from Placer.ai, titled Dine Brands Maintains Their Broad Appeal. Placer.ai’s report also notes that the chains are trying out a few new things to see if they can reverse the foot traffic trend.
Here’s the key visit data:
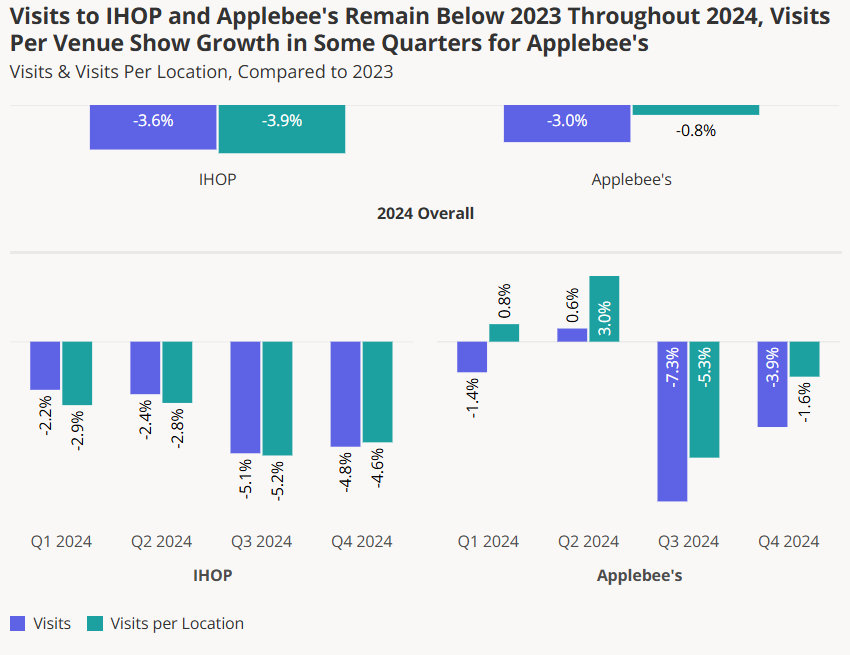
Additionally, the report notes that “Dine Brands unveiled its newest concept – a dual-branded IHOP-Applebee’s, with the first opening in February in Seguin, Texas and another twelve slated to open throughout 2025. This approach, which Dine Brands already piloted in international markets, allows diners the option to mix and match from IHOP and Applebee’s most popular menu items.”
Fake ID Spikes
St Patrick’s Day marks a big weekend for bars, restaurants, and dispensaries across the country. Yet with fake IDs rapidly growing in sophistication and accessibility, such establishments are facing huge challenges in protecting consumer safety and ensuring valid purchasing of age restricted products.
ID verification firm IDScan.net have found that Fake ID usage spikes to 7.78 percent during St Patrick’s Day weekend, up from a yearly average of 4.16 percent. They have extensive data, sourced from the 18 million IDs which IDScan.net verifies every month on where the fake IDs originated from and where they were most commonly used.
In addition, in a survey of 1,000 US consumers, IDScan.net found:
-
70 percent of US consumers encounter deepfaked or AI-generated content more than once per week (22 percent everyday)
-
The average consumer encounters deepfaked or AI-generated content 13 times per month
-
One-third (33.5 percent) are confident that they would know how to create a deepfake photo or video online
-
Less than half (43.7 percent) agree that they could spot the difference between a real ID and a fake ID – less than a third (28.7 percent) disagree
-
4 in 5 (78 percent) are concerned about the potential misuse of deepfakes
Shift Away from Seed Oils
Coast Packing Company released new findings from a new consumer survey highlighting a significant shift away from seed oils as a cooking fat.
The Coast study posed the question: Do you currently use seed oils (canola, soybean, cottonseed, grape seed, sesame, corn, safflower, rice bran, sunflower oils)? Respondents with a “Yes” were also asked their reasoning for using seed oils. Respondents who replied “No, but I used to” were asked the reasonings for changing from seed oils to alternative cooking fats or shortenings. The survey polled 2000+ respondents nationwide.
The survey revealed a notable shift among consumers away from seed oils, driven by various factors. Twenty percent of total respondents no longer use seed oils, with 39 percent citing health risks as their primary reason for this change. Other concerns include the highly processed nature of these oils (33 percent), performance issues in cooking (26 percent), and flavor preferences (24 percent). Additionally, 13 percent of respondents reported that they had intentionally switched to using animal fats.
Overall, health concerns emerged as the leading factor driving this shift, but the desire for less processed ingredients and better flavor also plays a significant role. In fact, in a 2023 Coast survey on animal fats, half the sample of 1,000 respondents gave a thumbs-up to animal fats for taste and versatility in the kitchen.
The Coast Packing Company study was fielded from Jan. 6-8, 2025. The survey consisted of 2008 completes with a general population aged 18+ years of age in the contiguous United States. For a copy of the survey results, email info@researchoncommand.com.
Do Playgrounds in Restaurants Boost Business?
Intouch Insight surveyed over 1,000 consumers—both parents and non-parents—to see how playgrounds impact restaurant choice, atmosphere, and recommendations. The results show that while playgrounds can be a powerful branding tool, their financial viability depends on the right audience. Parents of young children are the most influenced, with many saying a playground makes a restaurant feel more family-friendly. However,most diners are unwilling to pay extra for the amenity, and digital alternatives don’t hold the same appeal as physical play.
-
Playgrounds drive traffic, but mainly for families with younger kids – 86 percent of parents with 4-6-year-olds say they’d be more likely to visit a restaurant with a playground.
-
A strong family-friendly perception leads to recommendations – 88 percent of parents with kids 4-6 would recommend a restaurant with a playground to other families.
-
Willingness to pay extra is low – Only 17 percent of parents with older kids (10+) say they’d pay a small premium for meals to support playground upkeep.
Spirits Industry Holds Steady
The Distilled Spirits Council (DISCUS) reported that U.S. spirits maintained its market share while revenues slipped in 2024 and warned that tariffs on spirits would further curtail industry growth, during its annual economic briefing for media and analysts.
“While the spirits industry has proven to be resilient during tough times, it is certainly not immune to disruptive economic forces and marketplace challenges, and that was definitely the case in 2024,” said DISCUS President and CEO Chris Swonger.
Swonger reported that spirits supplier sales in the United States were down -1.1 percent in 2024 totaling $37.2 billion, while volumes rose 1.1 percent to 312.2 million 9-liter cases.
For the third year in a row, the spirits sector maintained its market share lead in 2024. Spirits market share totaled 42.2 percent, with gains for more than two decades. The spirits sector has gained more than 13 points of market share since 2000. Each point represents $880 million in supplier revenue.
Swonger noted that spirit sales were still continuing to normalize following the robust sales spikes during the pandemic, and economic headwinds including high prices and inflation rates created additional challenges for the industry.
“Consumers were contending with some of the highest prices and interest rates in decades, which put a strain on their wallets and forced many to reduce spending on little luxuries like distilled spirits,” said Swonger. “Our sales dipped slightly but consumers continued to choose spirits and enjoy a cocktail with family and friends.”
Swonger noted that higher interest rates also impacted the three-tier supply chain with wholesalers and retailers continuing to deplete inventory build ups and cautiously restock products.
Presenting an overview of the spirits sales trends in 2024, Christine LoCascio, DISCUS chief, policy, strategy & membership, reported that despite the overall slowdown, spirits ready-to-drink (RTD) products and Tequila/Mezcal continued to grow in popularity in 2024, with sales up 16.5 percent and 2.9 percent, respectively.
Top Five Spirits Category by Revenue
-
Vodka sales flat totaling $7.2 billion
-
Tequila/Mezcal sales up 2.9 percent totaling $6.7 billion
-
American Whiskey sales down -1.8 percent totaling $5.2 billion
-
Cordials sales down -3.6 percent totaling $2.8 billion
-
Premixed cocktails including spirits RTDs up 16.5 percent to $3.3 billion
Policy Wins
In the public policy arena, Swonger highlighted a number of important victories in 2024 at the federal and state levels including:
-
The suspension of the EU’s retaliatory tariff on American Whiskeys until March 31, 2025
-
Wins on spirits RTDs in three states
-
Defeated tax threats in 11 states
-
Third party delivery enacted in Delaware & Maryland
-
Tastings laws expanded in Ohio & West Virginia
-
Cocktails to-go permanency in five new states, plus a 5-year extension in New York
During the briefing, DISCUS discussed the recent tariff threats impacting spirits imports and exports, and sounded the alarm over the scheduled reimposition and doubling of the EU’s tariff on American Whiskey to 50 percent on April 1 related to the steel and aluminum trade dispute.
“One of the most critical issues facing U.S. distillers in 2025 is the threat of tariffs,” said Swonger. “Since the suspension of the EU’s tariffs on American Whiskey, our exports have rebounded to record highs. The reimposition of these tariffs at a 50 percent rate would gut this growth and do irreparable harm to distillers large and small. It would be a catastrophic blow that will force many distillers out of our largest export market.”
Special guest speaker, Sonat Birnecker Hart, president and founder of KOVAL Distillery in Chicago, underscored the devastating impact tariffs have had on small craft distillers.
“These tariffs have wreaked havoc on our craft distilling community,” said Birnecker Hart. “Many craft distillers have expended great time, effort and resources to expand into international markets only to see their dreams shattered by tariffs that have absolutely nothing to do with our industry. The return of tariffs will not only hurt my distillery but my local farmer too, and this pain will be felt in towns and cities across the country where 3,000 small craft distilleries are boosting jobs, tourism and agriculture.”
Swonger said the global spirits industry is united in urging their respective governments to continue to negotiate to ensure that spirits products do not get caught up in trade disputes.
“The global spirits associations are working side-by-side to urge our governments to exclude distilled spirits from these trade disputes,” said Swonger. “Tariffs on spirits not only harm distillers, they also severely impact farmers and hospitality businesses including restaurants and bars, which are continuing their fragile recovery after the pandemic. We are making our case to the Trump administration that our industry has thrived with zero-for-zero tariffs and that distilled spirits’ ‘distinctive products’ status, which is recognized by the U.S. and our trading partners, means that these special spirits can only be made in their designated countries.”
Cocktails Raising Spirits
Cocktails can help sustain spirits sales in the US On Premise if suppliers meet consumers’ changing needs, CGA by NIQ’s latest data shows.
The exclusive Cocktail Sales Tracker highlight the resilience of the market. Cocktail value velocity in the third quarter of 2024 was down year-on-year, but it was
10 percent higher than in the second quarter—an indicator that momentum may be building.
With cocktails attracting 35 percent of total spirits value in the On Premise—a year-on-year increase of 6 percentage points. The average price of a cocktail rose 50 cents to
$13.50, and average check value climbed more than $3 to $86.35. These numbers put the value of cocktails ahead of all other mega-categories like wine, beer and the spirits market as a whole.
However, shifting consumer behavior presents new challenges for brands. More drinkers are weighing up cost versus quality, with 52 percent now willing to pay more for a cocktail with branded ingredients—a 4pp drop from last year. This trend highlights the growing polarization in spending habits, with some consumers continuing to opt for premium experiences while others seek greater value.
Emerging trends also present fresh opportunities, particularly among younger consumers. Draft and pre-batch cocktails, for example, are gaining traction, with a third (33 percent) of 21 to 34-year-olds having either tried or expressing interest in trying them. State-by-state analysis highlights particularly high appeal in key markets like New York, California, and Texas.
Cocktails remain a driving force in fine dining and polished casual venues, reinforcing their broad appeal across different segments. Among the standout performers in the category, the Espresso Martini, Sangria, and Gin Fizz continue to see strong demand.
Matthew Crompton, CGA by NIQ’s vice president – Americas, said: “In a tough trading environment for spirits, cocktails will be absolutely pivotal to the growth plans of suppliers and operators in 2025. We see ample opportunities across the category, but seizing them will require a deep understanding of what consumers want, and why, where and when they want it. Our Tracker and Report are essential building blocks for precise and data-driven strategies that can sustain interest in spirits in US bars and restaurants in 2025 and beyond.”
BeerBoard Report: 2025 Big Game On-Premise Performance
Draft Beer Volume Down Nationally
One of the biggest party days of the year, America celebrated as Kansas City went for a three-peat and Philadelphia was looking for its second title in team history. The day of the “Big Game” saw draft beer volume decline -4.6 percent nationally when compared to 2024. This is coming off a flat performance last year, when draft ticked up only 0.34 percent.
Draft Style and Brand Performance
Coming off two years of decline for the Big Game, Light Lager saw an increase of +5.6 percent on the day. Lagers, the #2 style, saw a noted decline of -6.5 percent in share. IPAs, the third-ranked style, decreased for the second straight year, down -7.9 percent over 2024.
Michelob Ultra was again the top-poured brand nationally on the day, and was up a noted +11.9 percent. Bud Light, the #2 brand on the day, was -3.0 percent versus 2024. Miller Lite (+5.4 percent), Modelo Especiál (+9.6 percent) and Coors Light (+3.4 percent) rounded out the Top 5 for draft.
Big Game Impact on Cities
Hosting the Big Game for a record-tying 11th time, New Orleans did not see the bump a host city typically experiences. On the day of the Big Game, the "Big Easy" was -13.7 percent in draft volume when compared against 2024. The brand which realized the biggest growth on the day was Modelo Especiál, seeing an increase of +32.5 percent in volume.
In Philadelphia, fans were clamoring for their Birds to bring home the title. Draft volume was up +33.4 percent in the city on the day. Miller Lite dominated the taps, claiming a 34.3 percent volume share and was +15.6 percent over 2024.
Fatigue has set in for fans in Kansas City (at least in the on-premise). Making its fifth appearance in the Big Game in the past six years, Kansas City’s draft volume was down a significant -18.5 percent when compared to 2024. The biggest gainer on the day was Busch Light, which was up an incredible +145 percent in volume on the day.
Packaged Products Performance
Overall packaged volume decreased by 9 percent on the day of the Big Game (2025 v 2024). Light Lagers were the #1 packaged style and grew by +4.0 percent. Lagers checked in at #2, but saw a decline of -12.8 percent. RTD Cocktails were the biggest mover of the day, growing an eye-popping +189.7 percent. Non-Alcoholic (+31.8 percent) and European Lagers (-2.9 percent) were fourth and fifth, respectively.
Corona Extra, the #1 packaged brand, saw a noted decline of -13.4 percent. Michelob Ultra, the #2 brand, grabbed most of that void, jumping an impressive +11.1 percent on the day. Rounding out the Top 5 brands were Miller Lite (+3.7 percent), Coors Light (-3.5 percent) and Bud Light (-1.2 percent).
Beyond Beer Products Performance
Stateside / Surfside led the charge in Beyond Beer. Would being based in Philly have anything to do with it?
Surfside Iced Tea and Lemonade + Vodka came in this year and grabbed 16.6 percent of Volume Share from competitor brands in the Beyond Beer category. White Claw Hard Seltzer Black Cherry is the top brand in Beyond Beer with a 17.6 percent share, though Surfside is quickly closing the gap.
Spirits Performance
Agave led all spirits with a 24 percent volume share for the day. Whiskey checked in at #2 with a 21 percent share, followed by Vodka at #3 with a 14 percent share.
Tito's Handmade Vodka, the #1 Spirits brand with a 6.4 percent share, was down a notable -13.5 percent in volume on the day. Sauza Hacienda Tequila Gold, the #2 poured brand, was +52.1 percent in volume, while third-ranked Jameson Irish Whiskey grew +75.8 percent for the Big Game.
Starbucks Monday
The Super Bowl is a big day for millions of Americans — the day after was a big day for Starbucks!
On Monday, February 10, Starbucks gave out free coffee to Starbucks Rewards members for “Starbucks Monday.” Placer.ai’s data shows that the promotion clearly worked, as foot traffic spiked on the newly minted day of celebration:
|
Visits to Starbucks on Feb. 10, 2025 |
|
|
Compared to Daily Average Visits (Jan. 1, 2024 – Feb. 10, 2025) |
11.30 percent |
|
Compared to Average Monday Visits (Jan. 1, 2024 – Feb. 10, 2025) |
26.30 percent |
Further, R.J. Hottovy, Head of Analytical Research at Placer.ai, had this to say about the promotion:
“The "Starbucks Monday" promotion achieved several key objectives. First, it significantly increased Monday visit counts versus recent months. Second, by offering the promotion exclusively to Starbucks Rewards members, it likely contributed to loyalty program growth, creating new opportunities for customer engagement through the app. Lastly, it reintroduced lapsed customers to some of Starbucks' early changes under CEO Brian Niccol, including streamlined operations and the return of milk and sugar stations.”