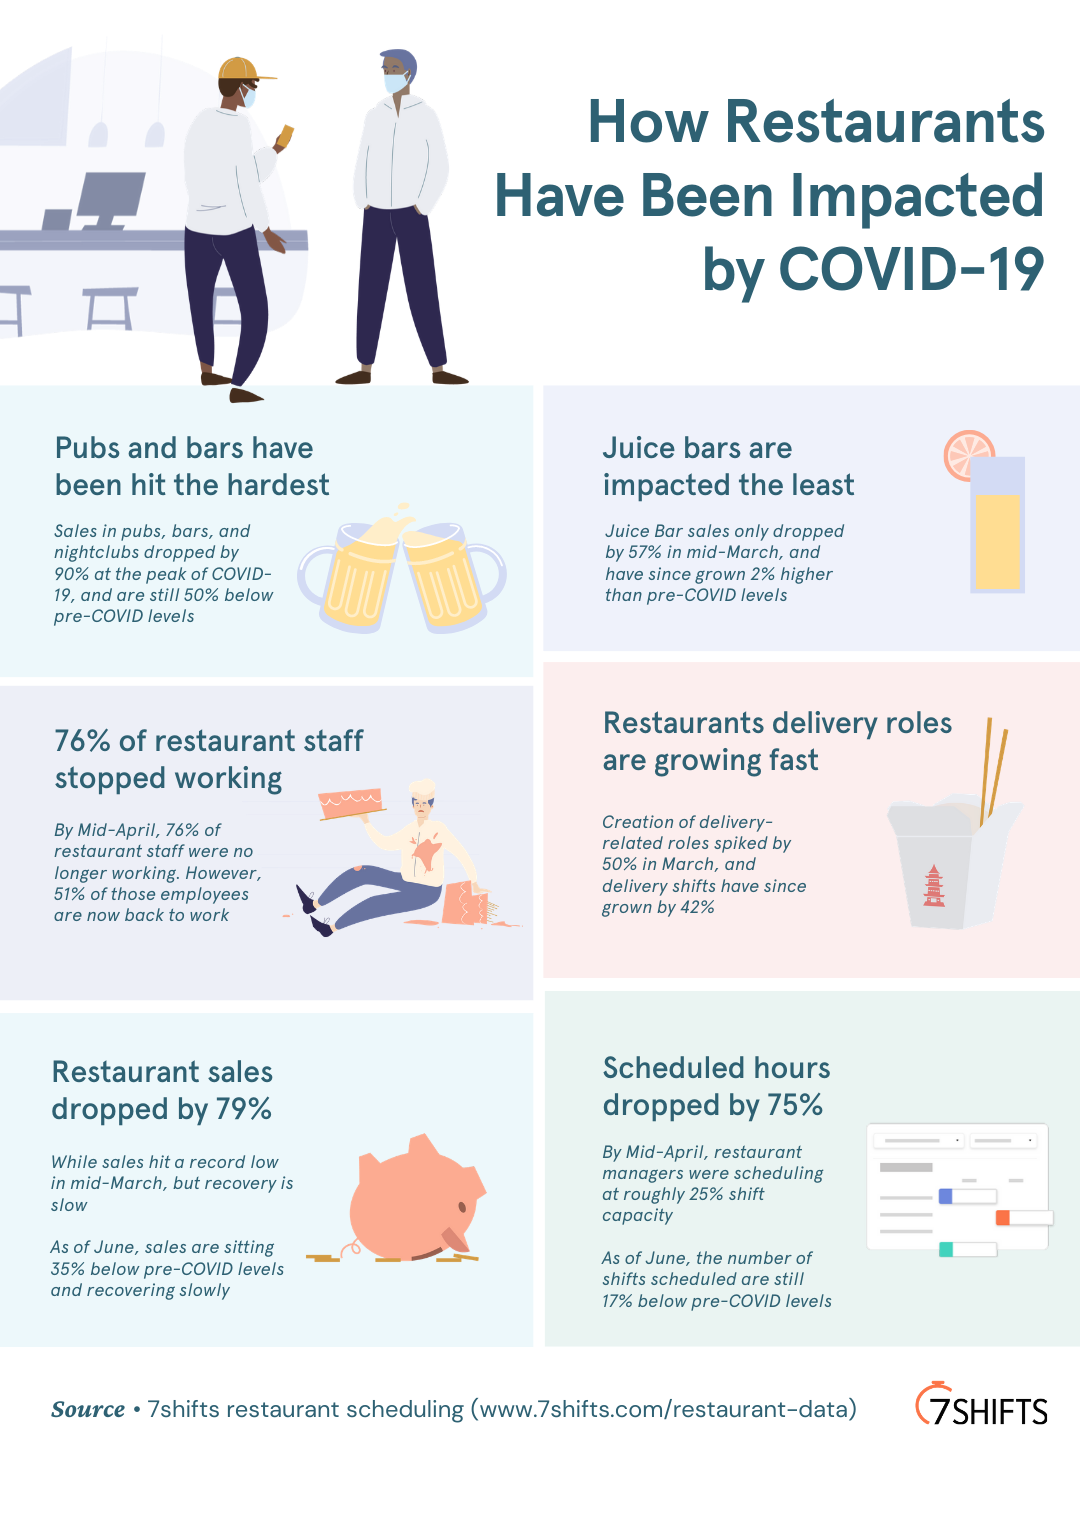
By the Numbers: How Restaurants Have Been Impacted by COVID-19 (Infographic)
1 Min Read
Tapping into its data hub that shows real-time data from more than 350,000 restaurants and restaurant professionals across the US and Canada., the team at 7shifts created an infographic that tells how restaurants have been impacted by COVID-19 as well as indicators of what to expect moving forward.
“While we're seeing strong early signs of restaurants bouncing back, it's going to happen slowly and not without precautions," said CEO Jordan Boesch. "With restaurants cutting seating by 50 percent, it's going to be difficult to get the sales back to pre-COVID levels. However, restaurant operators are taking advantage of new channels, like take-out and delivery, to help offset sales lost from reduced seating—this is reflected in the data we're seeing such as a 42% increase in delivery-related shifts being scheduled since March.”


